As usual, the introductory paragraphs of the latest Gold Market update apply equally to silver so they will not be repeated here.
It is hard to make sense of the seemingly aimless meandering of the silver price on shorter-term charts so we’ll start by trying to identify the patterns in play by looking at silver on a long-term chart.
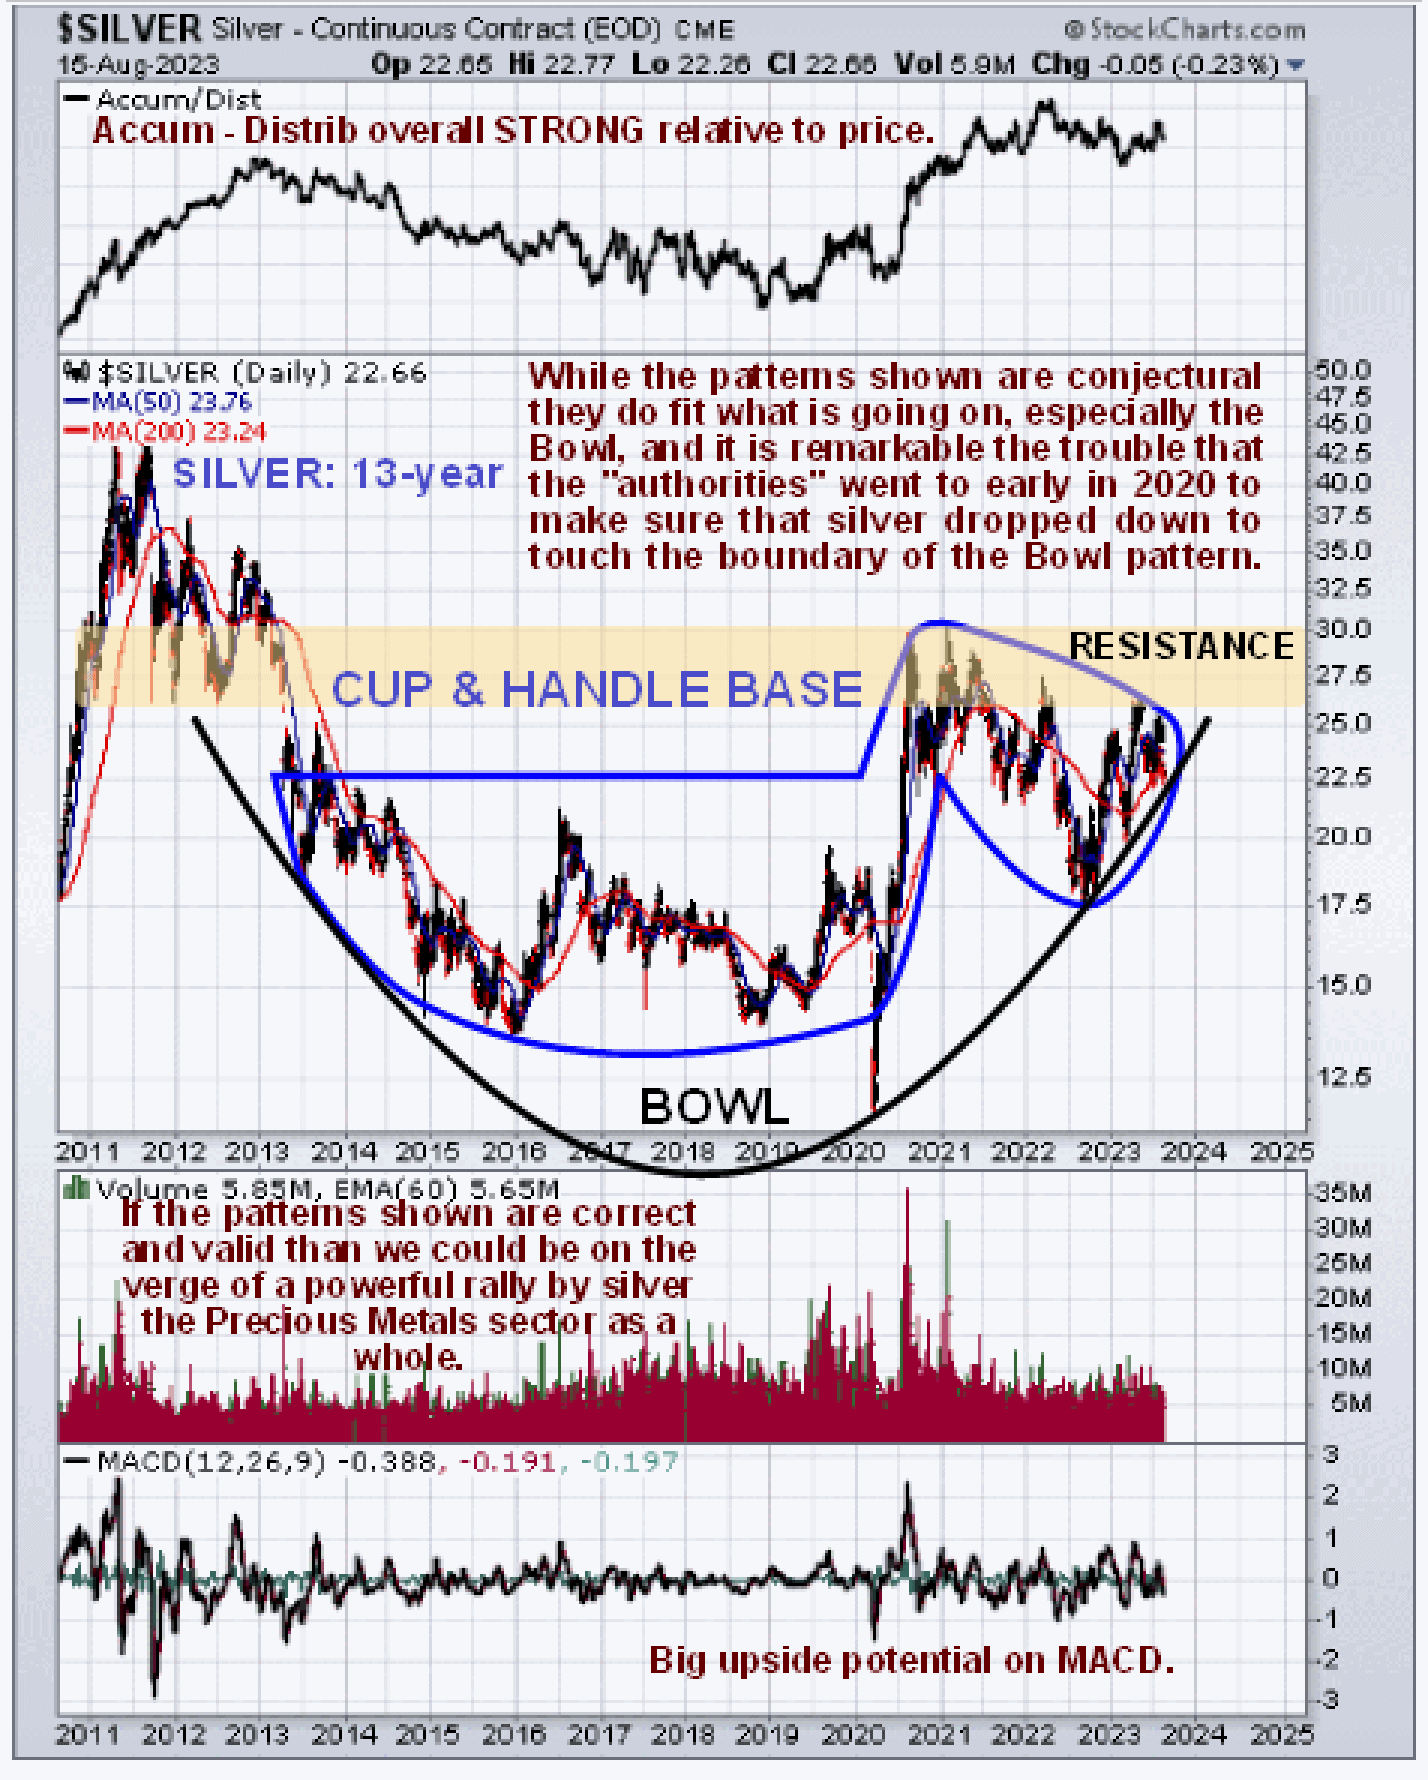
On the 13-year chart we can see that all of the action from the 2011 blowoff top is contained by the giant Bowl pattern shown and frankly I am amazed at the trouble the “authorities” went to in the Spring of 2020 to ensure that the silver price dropped vertically to briefly touch our Bowl boundary. However, within the Bowl pattern we can see that a distinct giant Cup & Handle base has formed and this explains the seemingly random downward drift from mid-2020 to the present – the price has been marking out a Handle to complement the Cup. Whatever else we may infer, one thing that is crystal clear on this chart is the importance of the resistance at the upper boundary of this base pattern – it bespeaks a powerful and possibly massive rally once the price breaks above it.
One complication that we need to include in our thinking is to consider what will happen if we see a general market crash in the Fall, which is certainly possible. In this event it is thought likely that silver will tank along with everything else, as it did in the Spring of 2020 at the time of the Covid crisis, but then come roaring back strongly to leave a “stalactite” pattern on the chart as money floods out of intrinsically worthless paper assets into tangibles, especially commodities. That may not happen – they may elect to paper over the cracks by creating more trillions to rescue all failing Banks etc. This is the hyperinflationary route and our chart by itself suggests that they will take it, and if they do, both silver and gold will “go ballistic”.
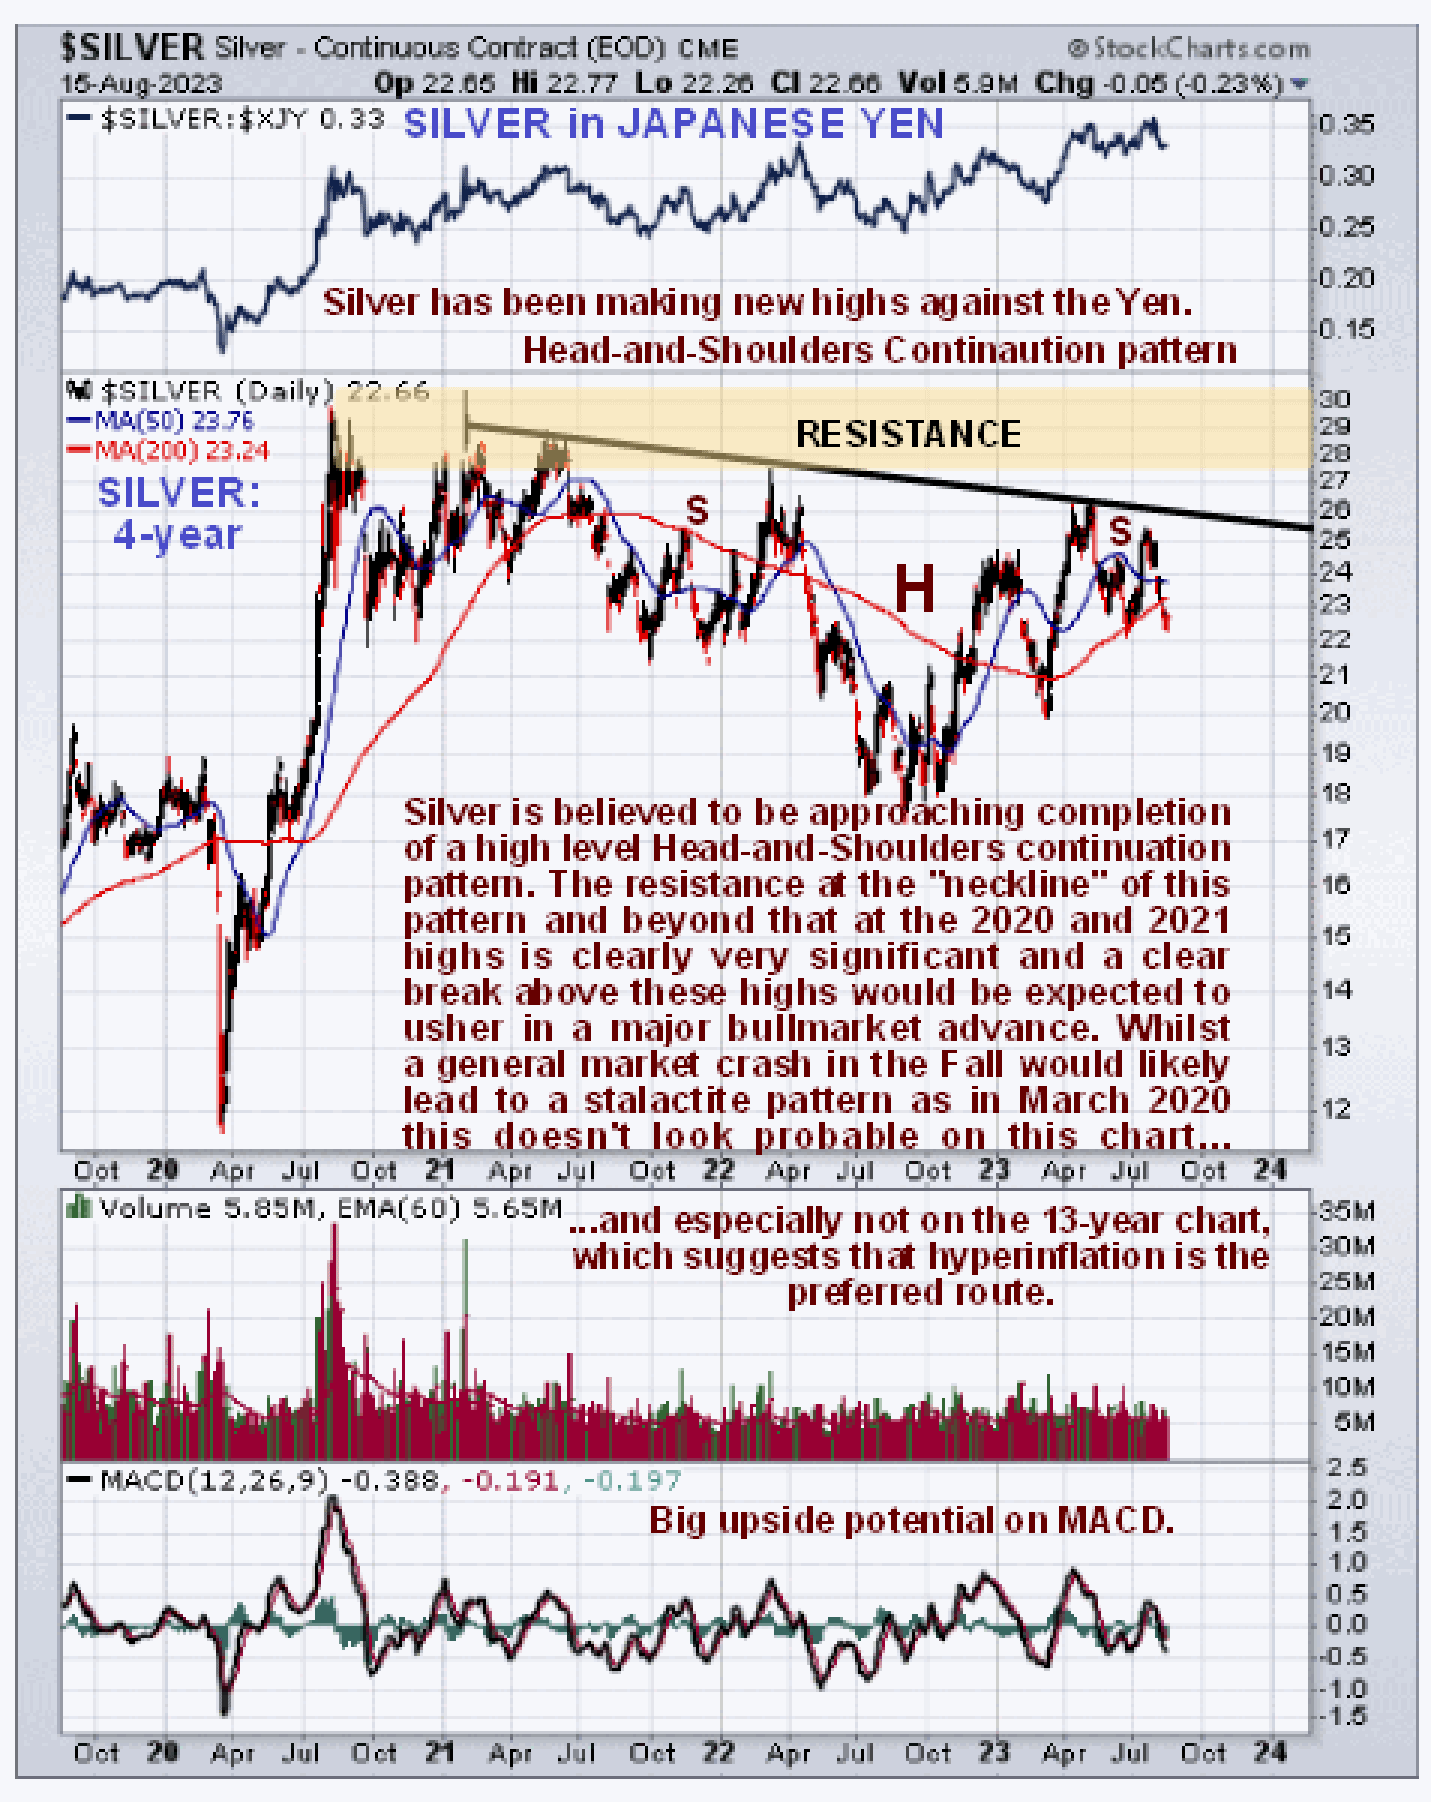
Having established what is going on regarding the The Big Picture, we will now proceed to look at the strong rally out of the Cup of the Cup & Handle base and the Handle itself in more detail on a 4-year chart. Following the impressive big rally from the March 2020 lows to complete the right side of the Cup the price drifted off sideways / down with a disconcerting drop (to bulls) in the middle of last year after which the trend has improved. What appears to have been going on is that the price has marked out a large Head-and-Shoulders continuation pattern which is a form of consolidation pattern where an H&S bottom forms at a high level without much of a drop preceding it. The measuring implications of this pattern, if it doesn’t abort, point to a breakout and advance towards the 2011 highs in the $47 area. If bond and stock markets hold up and don’t crater, admittedly a big if, this looks likely to happen soon.
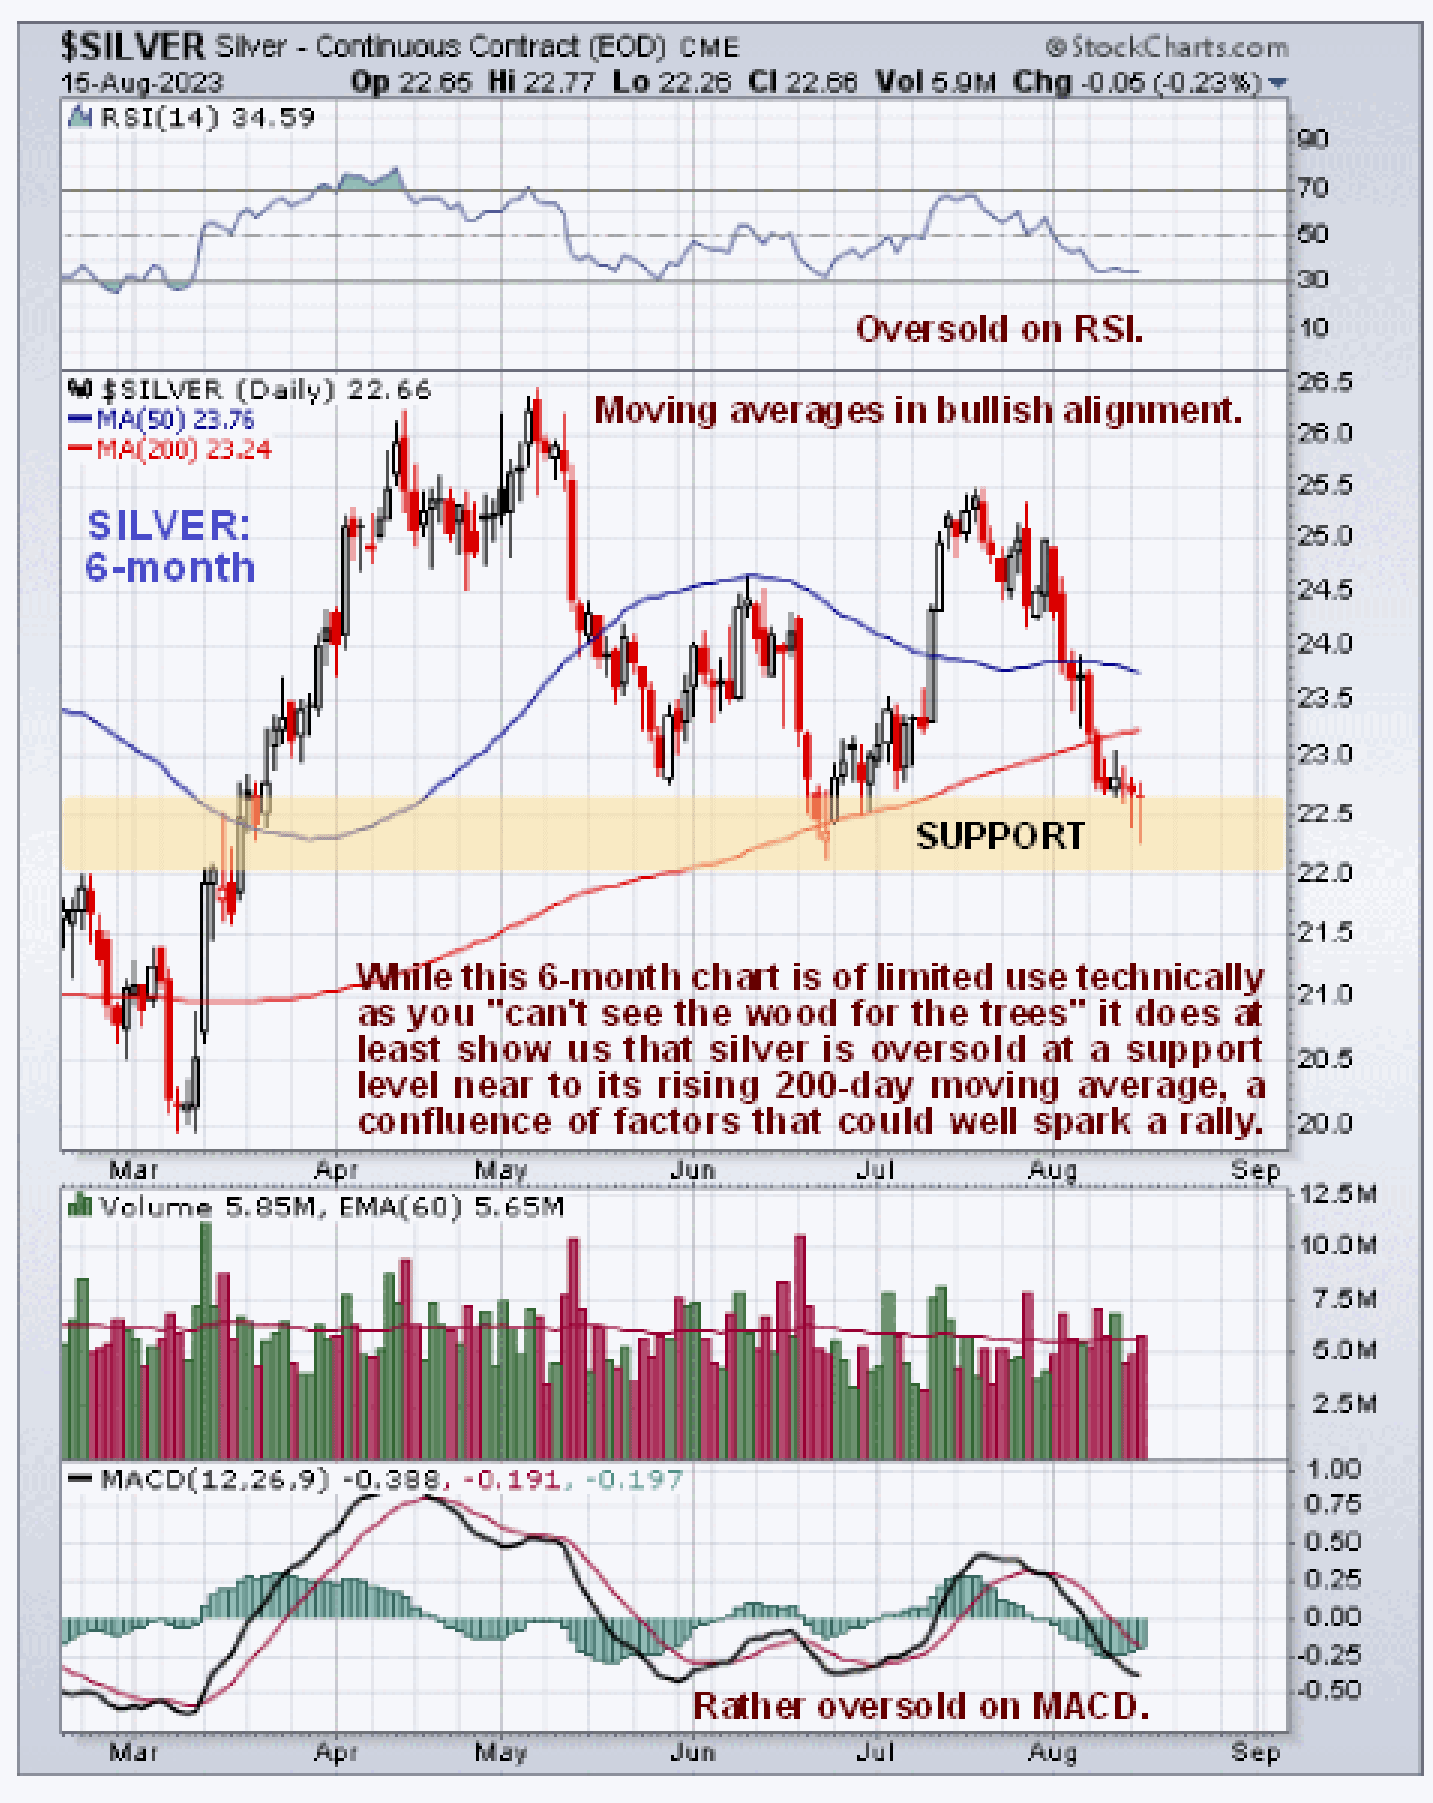
Lastly we will look at recent action in detail on the 6-month chart. Whilst this chart is of limited use technically, we can at least see that silver is currently oversold and at a support level near to its rising 200-day moving average and a couple of quite bullish looking candles have formed here over the past couple of days suggesting that it is about to turn higher gain.
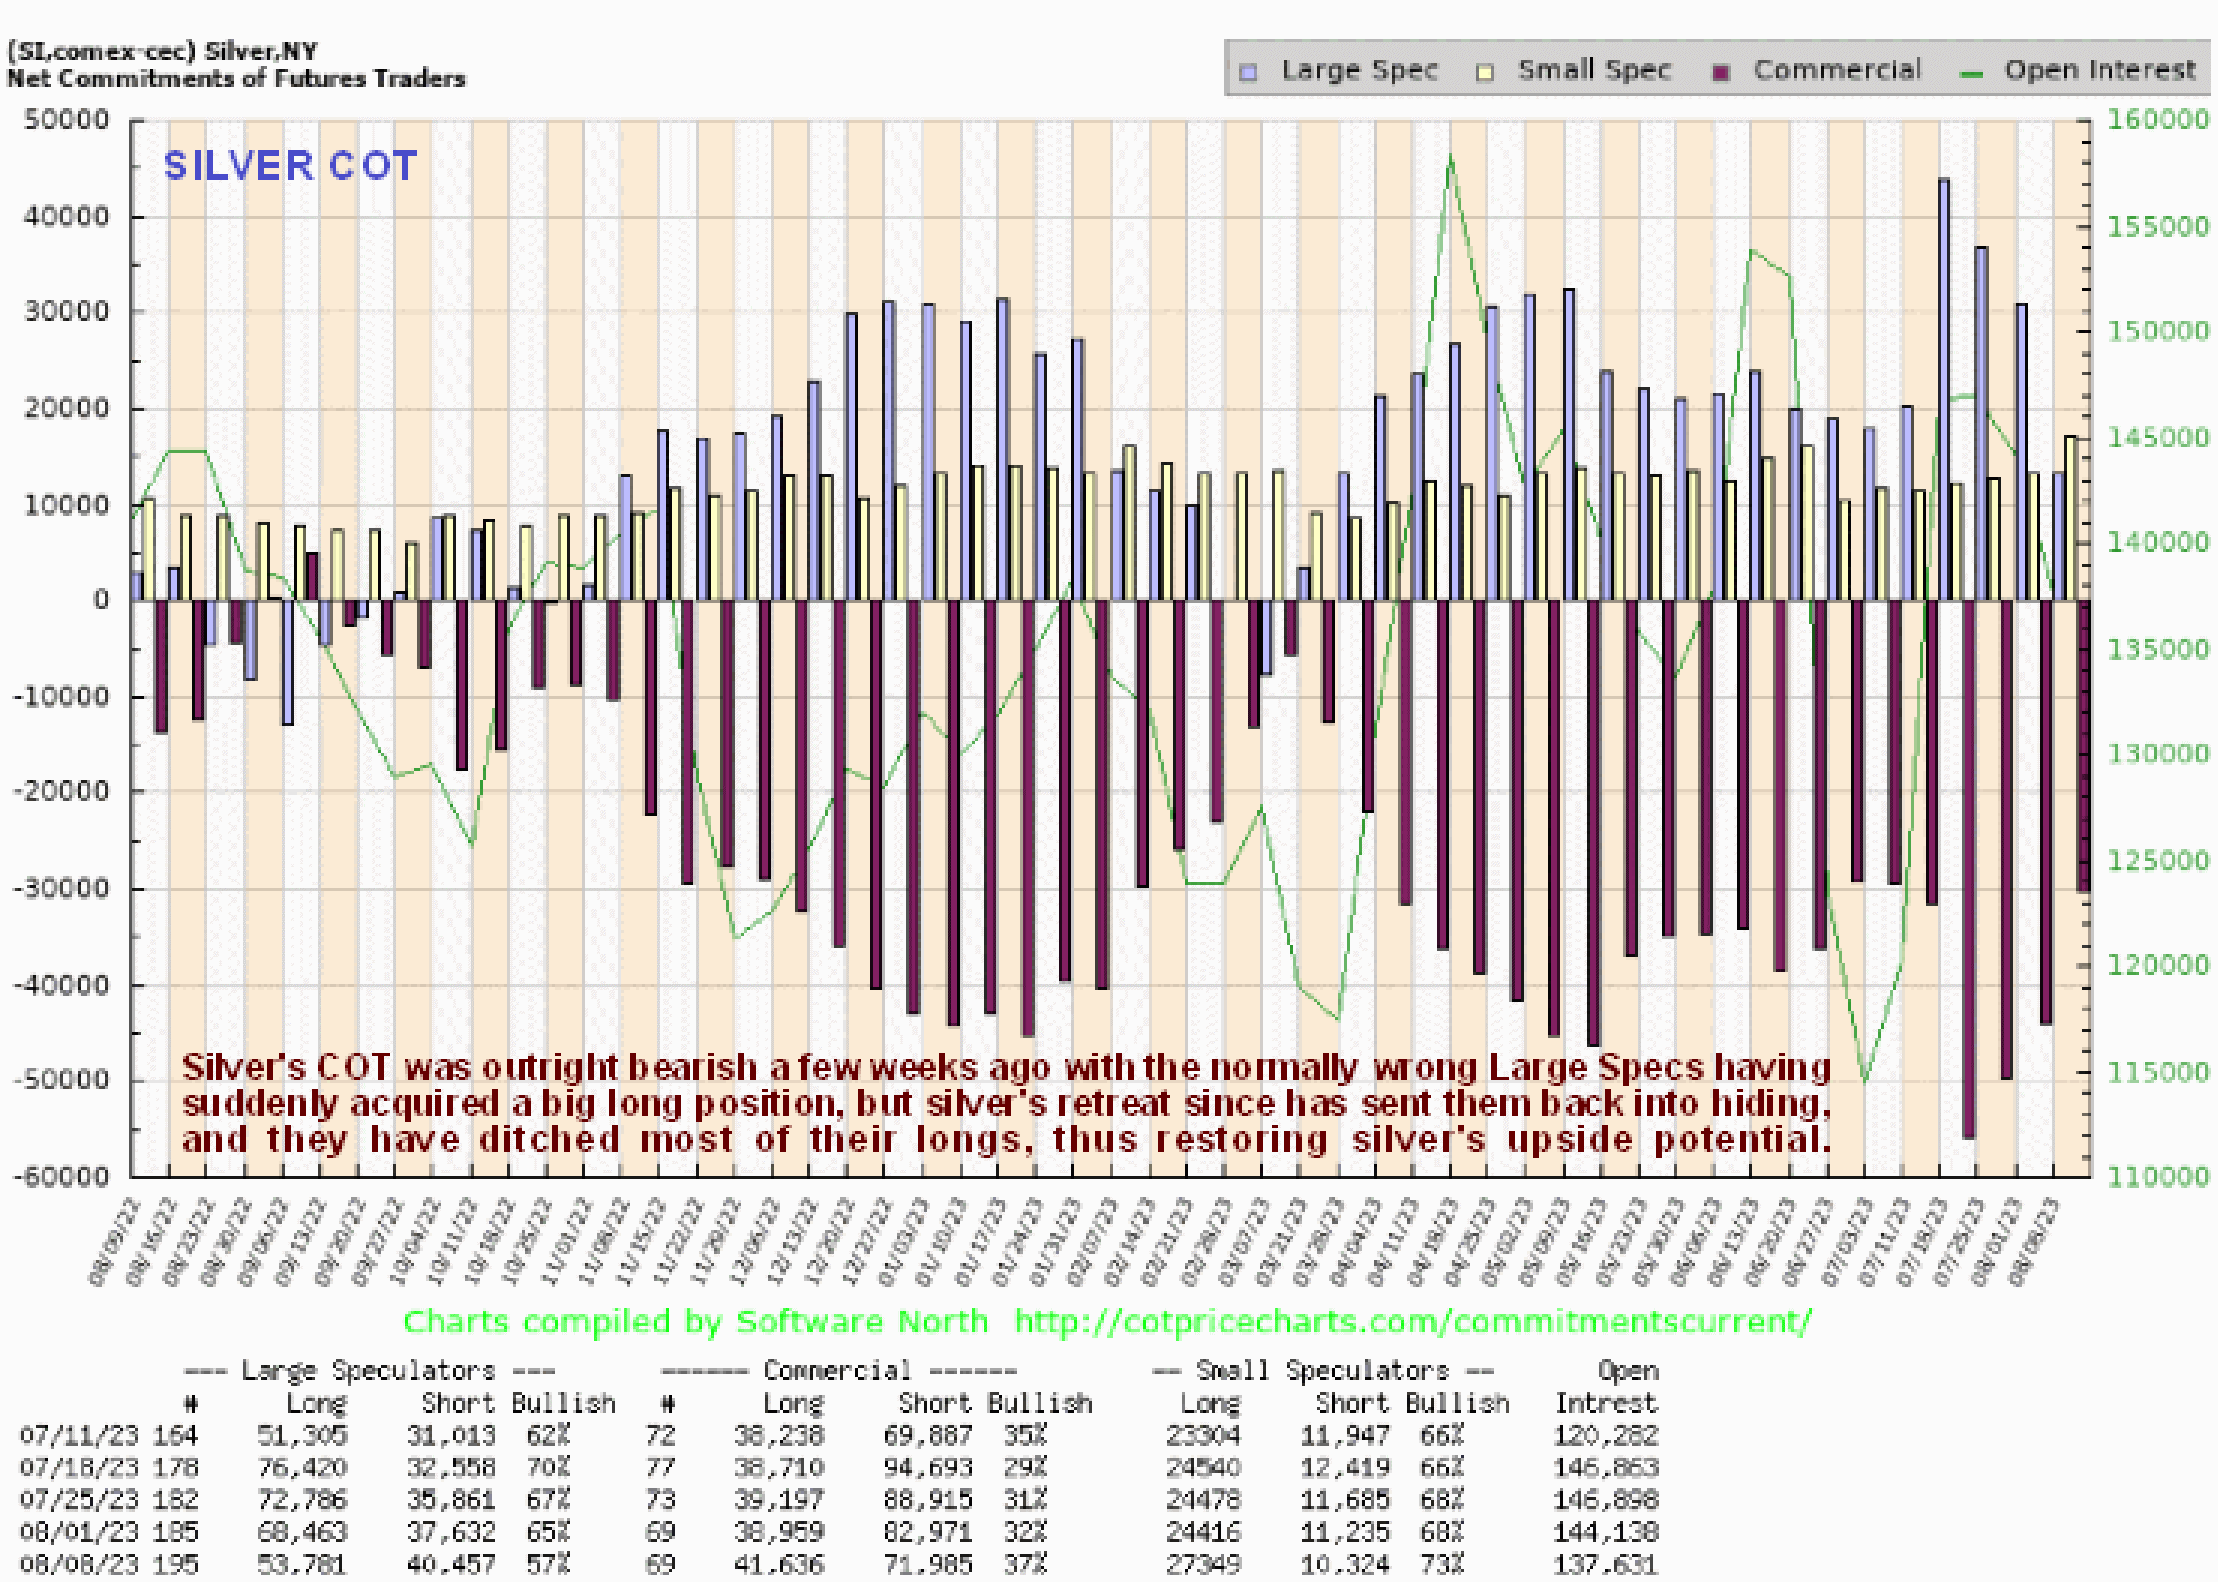
Silver’s latest COT chart is more bullish than that for gold. A few weeks ago the normally wrong Large Specs suddenly built up a big long position which was of course “the kiss of death” for silver. This problem has been solved by silver’s drop of the past several weeks which caused them to disgorge these long positions and go back into hiding, thus restoring silver’s upside potential.
End of update.
About the author