Source: www.stockcharts.com
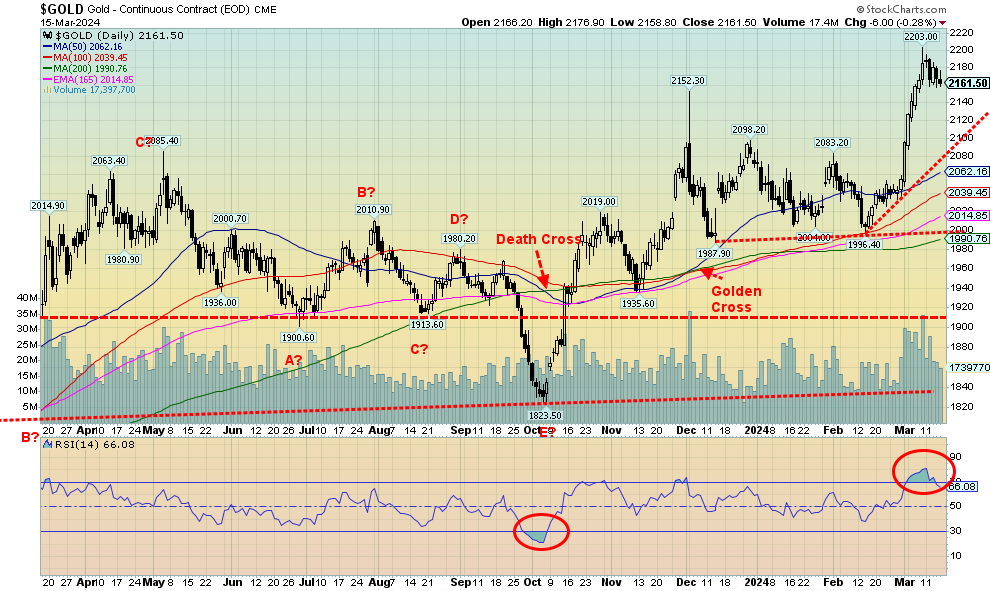
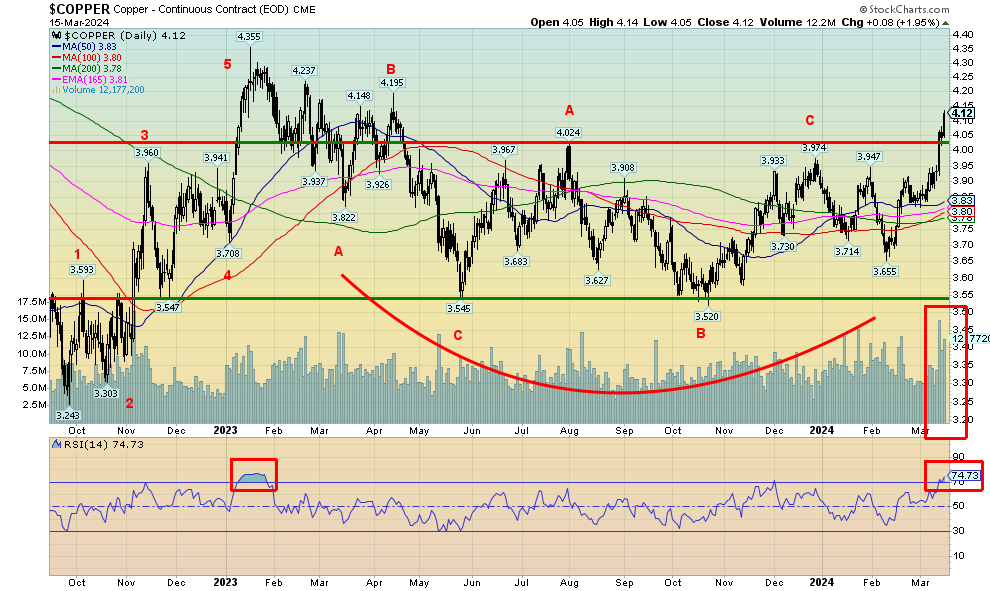
After a sharp run-up from about $2,000 to new record highs at $2,200, gold became overbought. A consolidation appears to be now settling in. Gold was the only casualty of thoughts of rate hikes this past week, falling 1.1%. Silver rose 3.4%, while platinum was up 3.1%. The near precious metals got into the act as palladium rose 6.3% and copper (see next) jumped 6.0%. The gold stocks also rose with the Gold Bugs Index (HUI) up 1.8% and the TSX Gold Index (TGD) gaining about 1.0%.
The catalyst for gold to pull back was the better than expected CPI and PPI released this past week. With some signs that inflation is picking up once again, gold reacted negatively to thoughts that the Fed would keep rates higher for longer. The question is, do thoughts of higher for longer interest rates outweigh thoughts of the growing risk of a significant default? We have previously noted the risks involved in a major sovereign default or a very large financial institution failing; for example, a Russian default à la 1998 that busted Long Term Capital Management (LTCM) and in turn almost busted the entire global financial system. Or a large institutional failure à la Lehman Brothers 2008 that again almost busted the financial system, with the Fed and all the other major central banks (i.e. Bundesbank, BOE, ECB, BofC, BOJ) coming to the rescue. But, as we have noted, the central banks are between a rock and hard place. Are they out of bullets for another major financial failure? The previous incidents resulted in a massive upward move in debt (government, corporate, and household). As did the pandemic, which in turn led to bubbles in the stock market and housing in particular.
For gold, $2,200 is now a resistance zone. Support can be seen down to $2,100, but below that level a fall to $2,000 is possible (although unlikely, given the conditions). A consolidation could continue for a week or more before another assault on $2,200 is made. Targets remain to at least $2,300 with secondary targets up to $2,500.
Besides the risk of a financial black swan, the geopolitical situation remains on edge. And, as we march towards the U.S. election in November, the risks of negative fallout from that remain. All would be positive for gold as gold acts positively in the face of loss of faith in government.
On the week, gold had an inside week, suggesting that this is merely a pause and not a potential top. That tells us that one could buy pullbacks towards $2,100. Gold’s performance since 2000 suggests as well that, given it’s the leader, one could favour owning gold over both silver and gold stocks, both of which have underperformed. But if a strong rally gets underway, then silver and gold stocks should outperform. Gold has no liability, unlike stocks. Silver is still rated as poor man’s gold. Premiums above spot to buy silver remain high.
Source: www.stockcharts.com
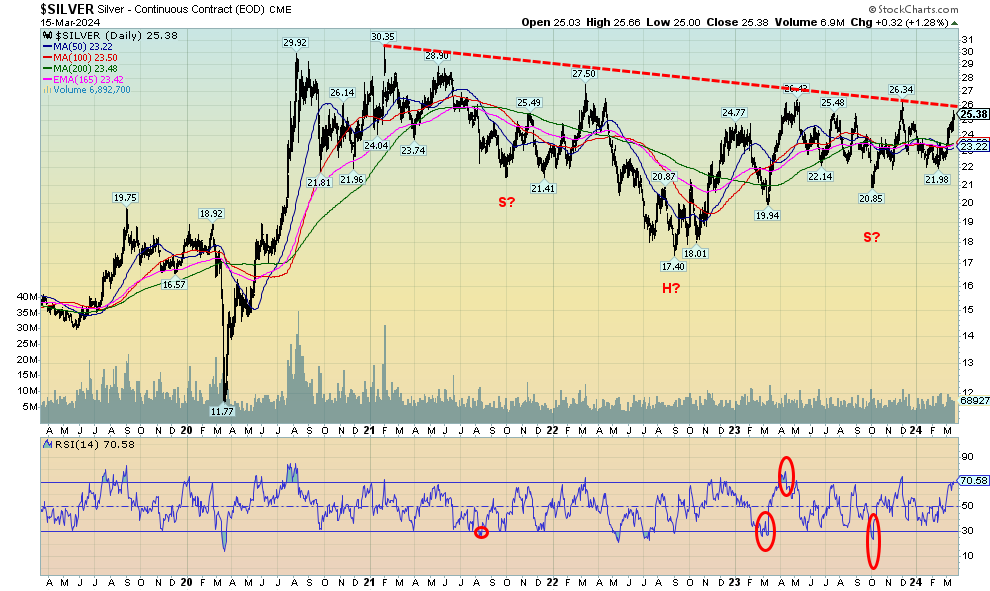
While gold faltered this past week on fears of rate hikes, silver wasn’t too bothered and put in another good week, gaining 3.4%. Silver is now up in 2024 by 5.4%. We continue to note what appears to be a large head and shoulders reversal pattern on silver. A firm break above $26 could project up to about $39. The $26 breakout level is now so well known by traders it almost could prove to be difficult to break through. Or it could generate a false breakout. More important then would be a move above $27.50, the high seen in early 2023. Above that level would be confirmation of the breakout. A few negatives. First, the RSI is now above 70, in overbought territory. That suggests silver could consolidate in front of the $26 breakout level. Second, the commercial COT is down to 30%, a level we are not overly comfortable with as the commercials appear to be getting ready for a pullback. Bullish levels are seen over 40%. Nonetheless, despite the weakening commercial COT, it doesn’t mean we will fail at $26. As well overbought conditions can remain in place for some time. The runup in 2020 from $11.77 to $29.92 saw silver overbought for a good couple of weeks, at least. The potential head and shoulders pattern is compelling, but we need to see it realized. The gold/silver ratio is at 85.61, down from a high of 92.41 but still quite high. In December 2022 it fell to 73.90 and has been in an upswing ever since. If we were at 73.90, silver would be trading at $29.25.
Source: www.stockcharts.com
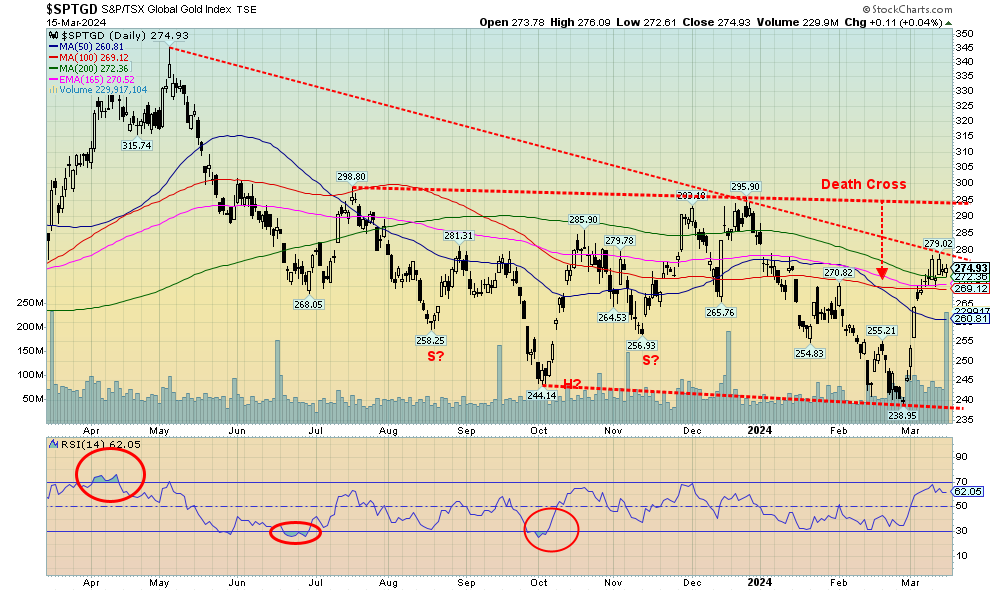
Despite gold consolidating this past week, the gold stocks added to their gains. However, the two main gold stock indices remain below breakout points. The TSX Gold Index (TGD) gained about 1.0% this past week while the Gold Bugs Index (HUI) was up 1.8%. Having different holdings does that. The TGD remains under its breakout level of 280 and still below a more important breakout level at 295/300. The HUI is under its breakout level of 245/250. For the TGD a move above 320 suggests new highs above the May high ahead. It’s important now to hold above 270. Below 260 a test of the lows could be coming. The move up thus far has been on volume, an important ingredient if we are to go higher. The TGD remains 40% below its all-time high seen in 2011 while the HUI is worse, down almost 64% from its 2011 all-time high. Meanwhile, gold has made new all-time highs but silver is still down 50% from its all-time high. Only gold shines. And certainly not the junior miners where the TSX Venture Exchange (CDNX) remains depressed.
The Gold Miners Bullish Percent Index (BPGDM) is at 35.7, suggesting it has considerable room to move higher before it hits overbought territory above 75. So far, the TGD is not showing any significant overbought signs, suggesting as well that it has room to move higher. Just heed the support zones of 260 and 270. The gold/HUI ratio is at 9.29, so gold stocks remain cheap relative to the gold price. In 2020 the ratio hit 5.31. If we were at that level today the HUI would be trading at 407, not the current level of 233.
Source: www.stockcharts.com
Read the entire report: Technical Scoop: Possible Tops, Metal Rise, Geopolitical Tensions
Disclaimer
David Chapman is not a registered advisory service and is not an exempt market dealer (EMD) nor a licensed financial advisor. He does not and cannot give individualised market advice. David Chapman has worked in the financial industry for over 40 years including large financial corporations, banks, and investment dealers. The information in this newsletter is intended only for informational and educational purposes. It should not be construed as an offer, a solicitation of an offer or sale of any security. Every effort is made to provide accurate and complete information. However, we cannot guarantee that there will be no errors. We make no claims, promises or guarantees about the accuracy, completeness, or adequacy of the contents of this commentary and expressly disclaim liability for errors and omissions in the contents of this commentary. David Chapman will always use his best efforts to ensure the accuracy and timeliness of all information. The reader assumes all risk when trading in securities and David Chapman advises consulting a licensed professional financial advisor or portfolio manager such as Enriched Investing Incorporated before proceeding with any trade or idea presented in this newsletter. David Chapman may own shares in companies mentioned in this newsletter. Before making an investment, prospective investors should review each security’s offering documents which summarize the objectives, fees, expenses and associated risks. David Chapman shares his ideas and opinions for informational and educational purposes only and expects the reader to perform due diligence before considering a position in any security. That includes consulting with your own licensed professional financial advisor such as Enriched Investing Incorporated. Performance is not guaranteed, values change frequently, and past performance may not be repeated.
About the author


Website: https://www.enrichedinvesting.com
Disclaimer: David Chapman is not a registered advisory service and is not an exempt market dealer (EMD) nor a licensed financial advisor. We do not and cannot give individualised market advice. David Chapman has worked in the financial industry for over 40 years including large financial corporations, banks, and investment dealers. The information in this newsletter is intended only for informational and educational purposes. It should not be considered a solicitation of an offer or sale of any security. The reader assumes all risk when trading in securities and David Chapman advises consulting a licensed professional financial advisor before proceeding with any trade or idea presented in this newsletter. David Chapman may own shares in companies mentioned in this newsletter. We share our ideas and opinions for informational and educational purposes only and expect the reader to perform due diligence before considering a position in any security. That includes consulting with your own licensed professional financial advisor.