Excerpt from this week's: Technical Scoop: Precious Sense, Job Divergence, Astronomical Debt
Source: www.stockcharts.com
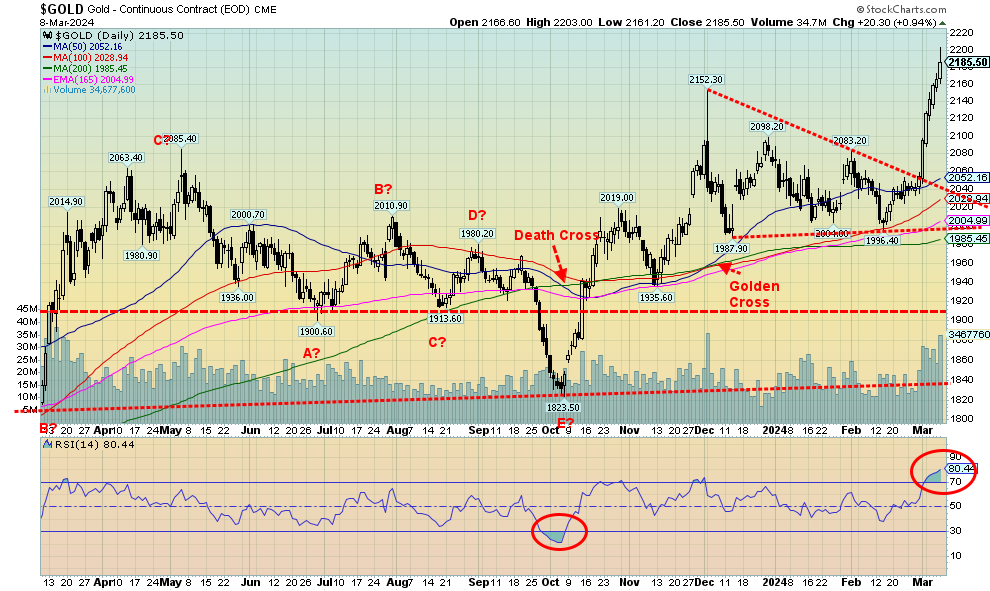
Gold joined the all-time high crowd this week when it burst to a high of $2,203 before settling back to close at $2,185. Yes, $2,200. The gold bugs must have been dancing in the street. Maybe best said by Peter Spina, President and CEO of Gold Seek (www.goldseek.com), who noted when gold was languishing and the gold stocks were sinking, he received all sorts of hate mail and insulting messages. We know the feeling. One of the best was that gold bugs have been blinded by the belief that the future is AI and crypto, not gold. Martin Armstrong of Armstrong Economics says that the gold bugs get slaughtered with their unwavering support for gold. There is a time to own it, and there is a time not to own it. The time to own it may be about to occur. Even Armstrong is getting friendly towards gold, but he is not a raging bull and warns that a short-term top could be nigh.
Since the major top in 2011 followed by the devastating wipeout in 2013, gold bugs have had little to cheer about. There was a nice little run-up in 2016 before settling back and then there was an even better run from 2018 to 2020, interrupted by the COVID pandemic in March 2020. Gold soared 79% during that run. Silver hit new lows during the COVID collapse, then leaped 160% into February 2021 while the Gold Bugs Index (HUI) rose 185% during 2018–2020 and the TSX Gold Index (TGD) was up 183% in the same period. The much-maligned junior gold mining market also had a nice run as the TSX Venture Exchange (CDNX) rose 236% from March 2020 to a peak in February 2021. Alas, after that they all sunk again, sending the gold bugs into despair.
Yes, the CDNX fell 54%, the HUI also fell 54%, the TGD dropped 48%, silver fell 43% and gold, the best performer, was down only 23%. While gold has now surpassed its all-time highs, silver is still down over 50% from its all-time high, the HUI is down 64%, and the TGD is down just over 40% from its respective all-time highs seen in 2011. Yet, gold itself has been the best performer of the century so far (not counting Bitcoin), outpacing the stock market. It’s now been a good three years since those last highs in 2021. So maybe the sector is overdue.
This past week gold rose 4.3%, silver was up 5.1%, palladium gained 3.0%, and the near precious metals also saw gains as palladium rose 6.5% and copper was up 0.8%. The HUI rose 8.5% and the TGD gained 7.5%. All in all, a good week. But the sector needs to follow through. The catalyst was signs of the economy slowing, a potential Fed pivot, geopolitical uncertainty, domestic political uncertainty, and maybe a desire to hold a hard asset rather than a virtual one. Funds that had been flowing out of gold ETFs flowed back in. Gold set aside the stronger than expected nonfarm payrolls and, instead, focused on things like weak wage gains and some perception that inflation was easing. Gold is the ultimate safe haven asset. Now, if only silver and the gold stocks would recognize that.
With $2,200 now in sight, the next stop above that level could be $2,300, which is our minimum target. And it could also mean a temporary top anywhere from $2,250 to $2,300. If $2,300 were exceeded, then the next target could be $2,500. But let’s not get ahead of ourselves. Clearly now, $2,100 is major support and below that $2,000. If $2,000 ever fell, it’s all over and another wipe-out is on the way. For the short term, gold is somewhat overbought so a pullback wouldn’t surprise. But the weeklies and monthlies still have room to move higher, even if the dailies wobble. This could be the big move and perfect storm the gold bugs have long dreamed about. But the fear is that the gold bugs, as usual, get ahead of themselves and then get slaughtered. The conditions are perfect with a trapped Fed, record debt, political divisions everywhere, war, and the potential for more devastation from climate change. But, as we rise towards $2,300, beware of a temporary top.
Source: www.stockcharts.com
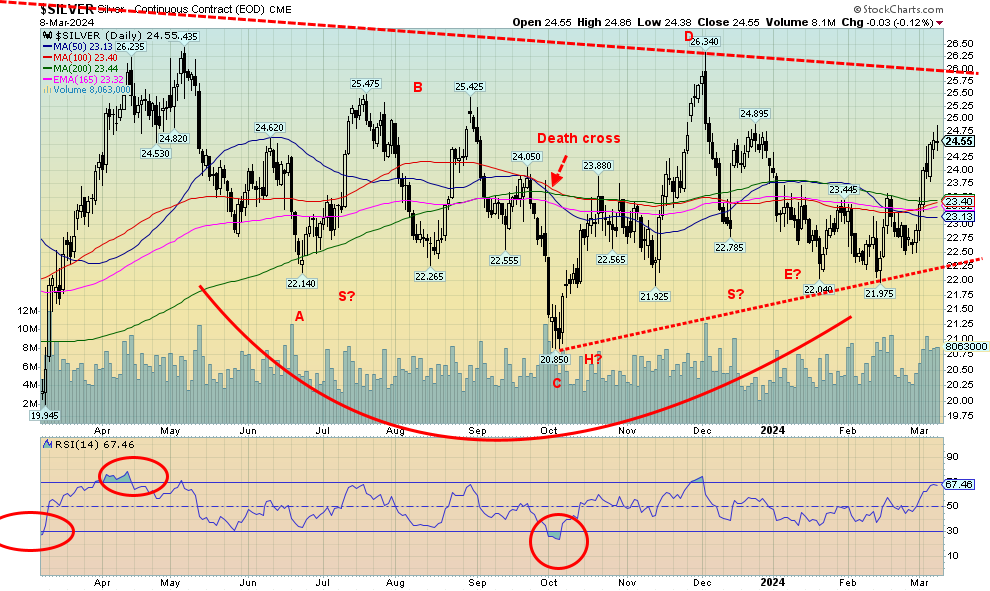
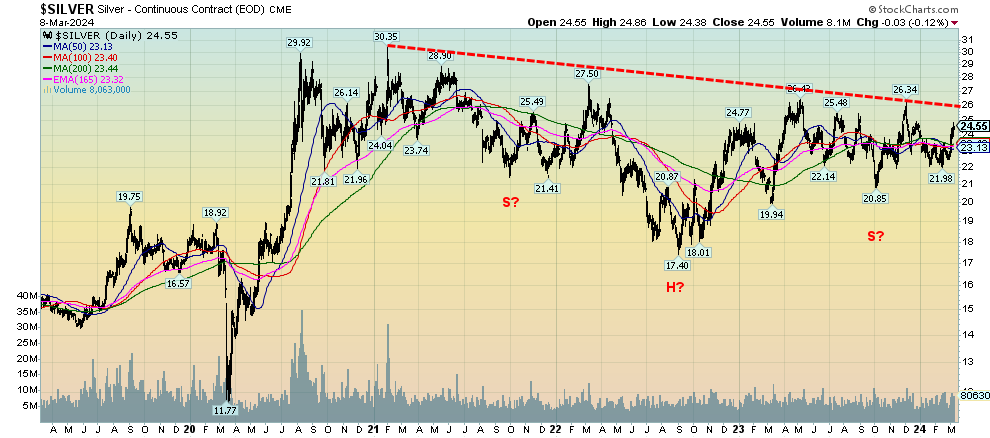
Silver had a good move this past week, outpacing even record-breaking gold. But, alas, while gold is setting new records, silver isn’t even close. That’s a very distant almost $50. Instead, we’re half that at $24.55. Still, silver gained 5.1% this past week, outpacing gold’s 4.3%. Despite the gain, a big breakout above $26 still seems far away, although with another week like this past one, we could soon break it down. Above $26 silver still has resistance up to $27.50/$28.00. Silver tends to ride high when it’s going up as we saw last October to December with a move from $20.85 to $26.34, but then it equally takes it on the chin when it falls from $26.34 to $21.98. Silver, it seems, is either loved or hated with little in-between. So right now, it’s loved, or at least it looks like a love-in is underway. We’ll save our joy until we break above $26, but that is merely a start. After that we need to break over the high of the past decade at $30.35. That high occurred in February 2021 and we’ve come nowhere near it since.
We decided to stretch out the chart to see what silver looked like over the past five years. And the first thing that caught our attention was the look of a potential head and shoulders reversal being formed. That’s bullish. The breakout is, of course, above $26 and the pattern has potential to see silver rise to at least $39. That would please the silver bulls, but a rise once again to $50 would be even better. In the interim, we wouldn’t want to see silver fall back under $23 and especially under $22.50. The pattern is encouraging.
Source: www.stockcharts.com
Read the entire report: Technical Scoop: Precious Sense, Job Divergence, Astronomical Debt
Disclaimer
David Chapman is not a registered advisory service and is not an exempt market dealer (EMD) nor a licensed financial advisor. He does not and cannot give individualised market advice. David Chapman has worked in the financial industry for over 40 years including large financial corporations, banks, and investment dealers. The information in this newsletter is intended only for informational and educational purposes. It should not be construed as an offer, a solicitation of an offer or sale of any security. Every effort is made to provide accurate and complete information. However, we cannot guarantee that there will be no errors. We make no claims, promises or guarantees about the accuracy, completeness, or adequacy of the contents of this commentary and expressly disclaim liability for errors and omissions in the contents of this commentary. David Chapman will always use his best efforts to ensure the accuracy and timeliness of all information. The reader assumes all risk when trading in securities and David Chapman advises consulting a licensed professional financial advisor or portfolio manager such as Enriched Investing Incorporated before proceeding with any trade or idea presented in this newsletter. David Chapman may own shares in companies mentioned in this newsletter. Before making an investment, prospective investors should review each security’s offering documents which summarize the objectives, fees, expenses and associated risks. David Chapman shares his ideas and opinions for informational and educational purposes only and expects the reader to perform due diligence before considering a position in any security. That includes consulting with your own licensed professional financial advisor such as Enriched Investing Incorporated. Performance is not guaranteed, values change frequently, and past performance may not be repeated.
About the author


Website: https://www.enrichedinvesting.com
Disclaimer: David Chapman is not a registered advisory service and is not an exempt market dealer (EMD) nor a licensed financial advisor. We do not and cannot give individualised market advice. David Chapman has worked in the financial industry for over 40 years including large financial corporations, banks, and investment dealers. The information in this newsletter is intended only for informational and educational purposes. It should not be considered a solicitation of an offer or sale of any security. The reader assumes all risk when trading in securities and David Chapman advises consulting a licensed professional financial advisor before proceeding with any trade or idea presented in this newsletter. David Chapman may own shares in companies mentioned in this newsletter. We share our ideas and opinions for informational and educational purposes only and expect the reader to perform due diligence before considering a position in any security. That includes consulting with your own licensed professional financial advisor.