Silver Excerpt -- Read the full weekly report on GoldSeek.com
Silver fell 3.8% this past week. As with gold, silver was propelled lower following the U.S. job numbers and a rising US$ Index. Silver did spike lower earlier in the week on March 29 but that was the day of the reversal when buying came right back in and silver closed only marginally lower on the day at $24.74, off the low of $24.05. It was important that silver hold above $24 as that was where the uptrend line came in from the $21.99 low of February 3. The silver uptrend remains intact. The breakdown level this coming week is seen at $24.20 with further support down to around $23.80. But a break of $23.50 would be dangerous and under $23.30 new lows could lie ahead. To the upside, silver needs to break above $26 to suggest higher prices. Above $26.70, new highs above $27.50 could be seen. Is silver in short supply as some claim? We haven’t heard of any huge short position on the futures exchanges as what happened to nickel. Our expectation is that silver should hold its uptrend line and once we clear $26.50, we could start moving substantially higher. Above $28.25 silver could see new highs above the February 2021 high of $30.35.
Source: www.cotpricecharts.com
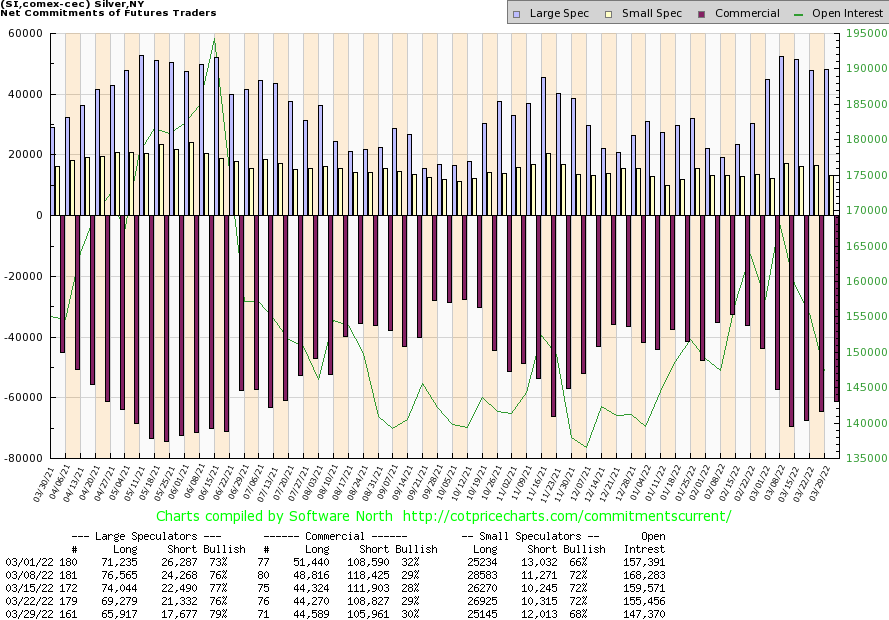
The silver commercial COT rose to 30% this past week. Long open interest was relatively flat but short open interest fell about 3,000 contracts, suggesting that the week saw short covering. The large speculators COT rose to 79% as they saw both long and short positions fall. Longs fell over 3,000 contracts while shorts were down almost 4,000 contracts. On the week, open interest fell about 8,000 contracts, suggesting that the week was all about short covering during a down week. We view this as at least mildly positive.

Source: www.stockcharts.com
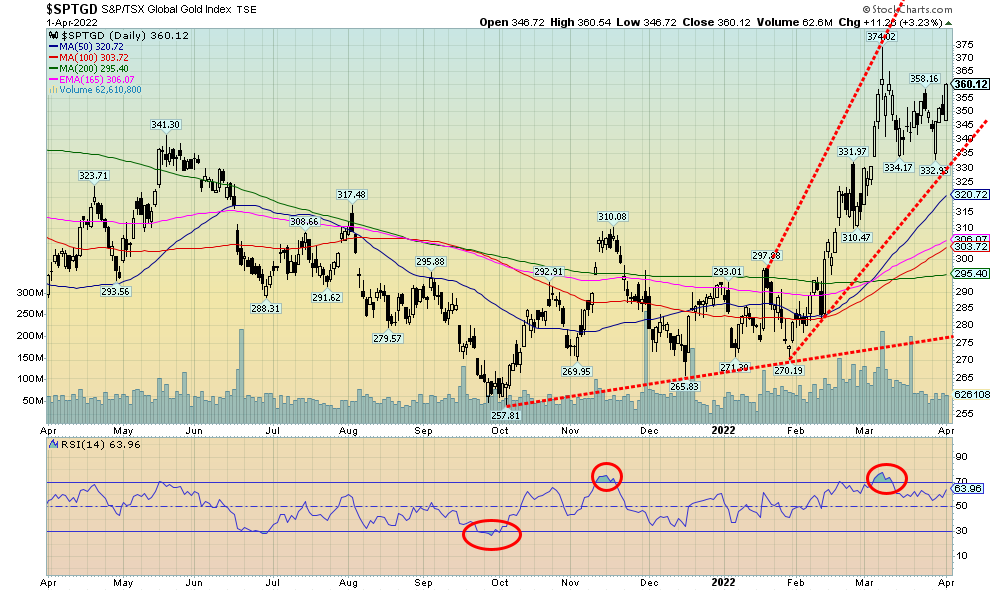
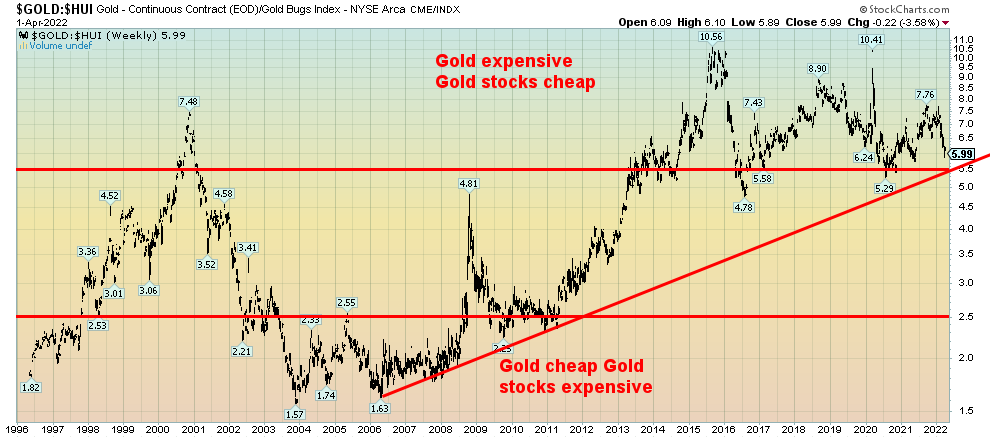
Are the gold stocks leading the way? This past week, even as both gold and silver fell on the week, the gold stocks put in a positive week. The Gold Bugs Index (HUI) jumped 2.1% while the TSX Gold Index (TGD) was up almost 3.0%. The big up day was on Friday when the TGD gained 3.2% and the HUI jumped 3.1%. Meanwhile, gold fell 1.6% and silver was down 3.8%. So why the big difference? Our suspicion is that the gold stocks are anticipating upward pressure on gold prices following the announcement that Russia wants payment for its oil and gas in rubles and backing the ruble at 5,000 rubles per gram of gold. The anticipation is that this will eventually be very good for gold and ultimately the gold stocks. As we noted, the decline in gold and silver on Friday may have been a takedown to get some players in at lower prices. The gold stocks didn’t have to wait for that moment and leaped instead on Friday. The recent drawdown to a low near 332 for the TGD held the up-trend line from the early February low of 270. The TGD appears to be forming a funnel, meaning the channel is widening as it goes higher. Funnels are quite bullish normally. The current breakdown point is around 330, but the pattern suggests we could move higher and eventually see new highs. The TGD is not yet overbought and the Gold Miners Bullish Percent Index (BPGDM) is currently at 79.31 so it has room to move higher. Other indicators support that as well. Follow-through to the upside this coming week will help solidify the up move. For the record, the August 2020 high was at 417 and the all-time high seen in 2011 was at 455. Given current levels of 360, we still have room to move higher. The Gold/HUI ratio is at 5.99, implying that gold stocks remain cheap vs. gold. If the gold stocks were expensive vs. gold, the ratio would be at 2.5.
Gold/HUI Ratio 1996–2022

Source: www.stockcharts.com

Source: www.stockcharts.com
Was it the nuclear option? Faced with rising complaints against the high cost of gasoline at the pump, the Biden administration took the unprecedented decision to release some 180 million barrels of oil from the U.S.’s strategic reserves (SPR) over the next six months—the equivalent to one million barrels a day. As a result, oil prices plunged the most in two years as WTI oil fell 12.8% this past week.
To put that in perspective, we note that in 2021 the U.S. imported some 405,000 bpd from Russia. This release more than doubles that loss. The U.S. is the world’s largest consumer of oil, consuming some 19.7 million bpd. The U.S. also imports roughly 8–9 million bpd, including a million bpd from OPEC countries. On March 28,
2022, the U.S. paid on average $4.63/US gallon for gasoline. The highest in the world is Hong Kong at $10.90/US gallon while the global average is $5.07/US gallon. Canada paid the equivalent of $5.90/US gallon.
Meanwhile, U.S. crude oil stocks are declining at a rapid pace, well below their 5-year average, last at about 410 million barrels. This release will run those stocks down even further and eventually they will have to be replaced. The result is, this is nothing more than a short-term fix and may actually accomplish little.
OPEC met this past week and refused to up their production increases of an additional 432,000 bpd in May. This was designed to stay in alignment with Russia. Russian oil faces more headwinds, given the Russian request to pay for their oil and gas in rubles, although euros deposited with Russia’s Gazprombank are acceptable. Gazprombank would then convert the euros to rubles. Meanwhile, India is in the process of paying Russia for its energy in rubles/rupees. It has quickly drawn the ire of the U.S. that could result in U.S. sanctions. It also sends a message to other countries that they will be restricted if they do business with Russia. Saudi Arabia and China are looking at China paying for its oil from Saudi Arabia in yuan. All of these moves are attacks against the U.S. dollar that has been the prime currency of payment for all commodities for 50 years.
Nonetheless, it’s the Biden administration move to release 180 million barrels from the SPR that has the market abuzz, but, as many observers point out, it is also a sign of how desperate things have become.
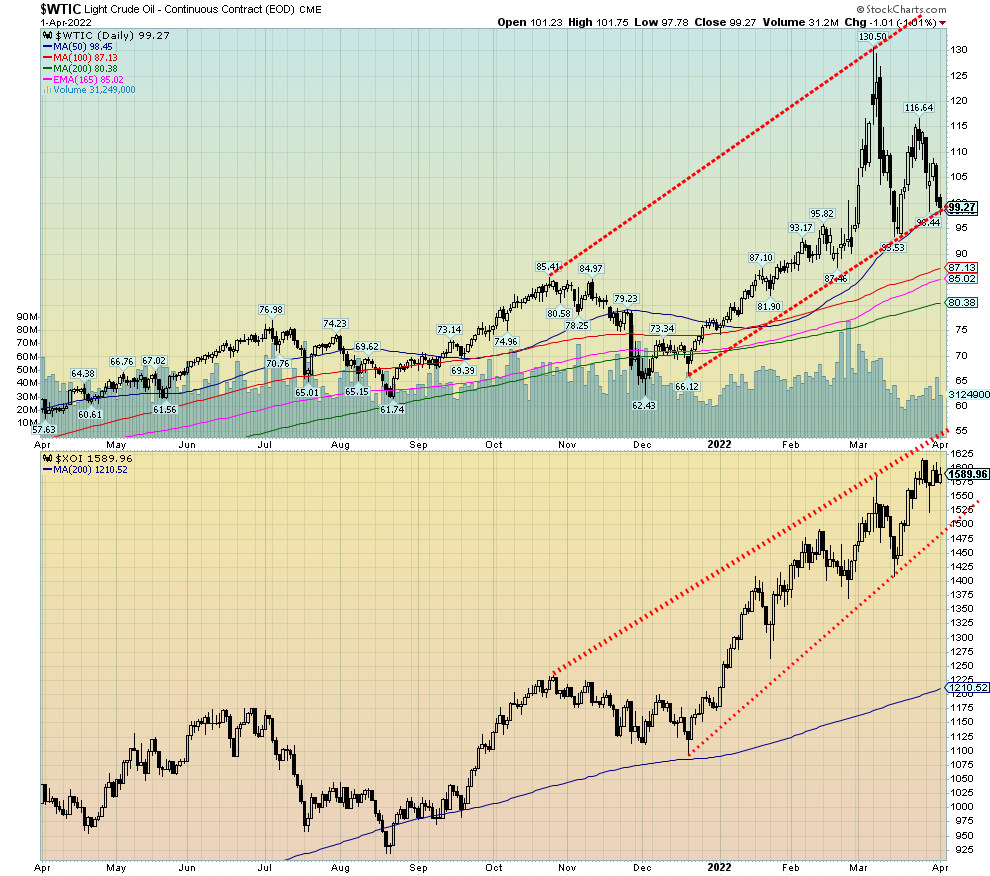
Despite the fall for WTI oil and Brent (down 10.8% this past week), natural gas (NG) rose almost 2.0%. The energy indices were off but not by a lot. The ARCA Oil & Gas Index (XOI) fell 1.5% this past week while the TSX Energy Index (TEN) was down 1.3%. Both remain up strong on the year with the XOI up about 35% and the TEN up 38.5%. WTI oil has fallen to the bottom of the channel up from the December 2021 lows. Could WTI oil break down under the channel and break under the March low of $93.53? It could and that would raise the potential for a real washout for oil as it could then fall to swing targets down to around $70. That’d be a big relief at the pumps.
But there is a difference between could it happen and will it happen. Yes, it could happen. Even a fall to the 200-day MA near $80 is a possibility as well. But will it? That’s a more difficult question as it could only take some further deterioration in the ongoing Ukraine war or the EU refusing to bend to the Russian request to pay in rubles (euros, then Gazprombank converts to rubles) and Russia follows through on their threat to cut them off. There are insufficient global supplies to replace all the oil and gas the EU would lose if Russia cut them off. And Russia does not have immediate outlets to sell its oil and gas elsewhere. Both would suffer, with the EU falling into a recession and Russia’s economic woes deepening further. The question then becomes who could absorb the hit better.
The oil stocks are holding up relatively well. They also remain relatively cheap vs. oil towards the upper range of the WTI Oil/XOI ratio over the past 40+ years. Oil stocks were relatively expensive vs. oil back in 1998 and again in 2015/2016. Oil was expensive vs. the energy stocks during the 1980s and again in 2002 and 2008.
Silver Excerpt -- Read the full weekly report on GoldSeek.com
Copyright David Chapman, 2022
|
GLOSSARY Trends Daily – Short-term trend (For swing traders) Weekly – Intermediate-term trend (For long-term trend followers) Monthly – Long-term secular trend (For long-term trend followers) Up – The trend is up. Down – The trend is down Neutral – Indicators are mostly neutral. A trend change might be in the offing. Weak – The trend is still up or down but it is weakening. It is also a sign that the trend might change. Topping – Indicators are suggesting that while the trend remains up there are considerable signs that suggest that the market is topping. Bottoming – Indicators are suggesting that while the trend is down there are considerable signs that suggest that the market is bottoming. |
Disclaimer
David Chapman is not a registered advisory service and is not an exempt market dealer (EMD) nor a licensed financial advisor. He does not and cannot give individualised market advice. David Chapman has worked in the financial industry for over 40 years including large financial corporations, banks, and investment dealers. The information in this newsletter is intended only for informational and educational purposes. It should not be construed as an offer, a solicitation of an offer or sale of any security. Every effort is made to provide accurate and complete information. However, we cannot guarantee that there will be no errors. We make no claims, promises or guarantees about the accuracy, completeness, or adequacy of the contents of this commentary and expressly disclaim liability for errors and omissions in the contents of this commentary. David Chapman will always use his best efforts to ensure the accuracy and timeliness of all information. The reader assumes all risk when trading in securities and David Chapman advises consulting a licensed professional financial advisor or portfolio manager such as Enriched Investing Incorporated before proceeding with any trade or idea presented in this newsletter. David Chapman may own shares in companies mentioned in this newsletter. Before making an investment, prospective investors should review each security’s offering documents which summarize the objectives, fees, expenses and associated risks. David Chapman shares his ideas and opinions for informational and educational purposes only and expects the reader to perform due diligence before considering a position in any security. That includes consulting with your own licensed professional financial advisor such as Enriched Investing Incorporated. Performance is not guaranteed, values change frequently, and past performance may not be repeated.


