Excerpt from this week's: Technical Scoop: Topping Signs, Material Rise, Defensive Energy
Source: www.stockcharts.com
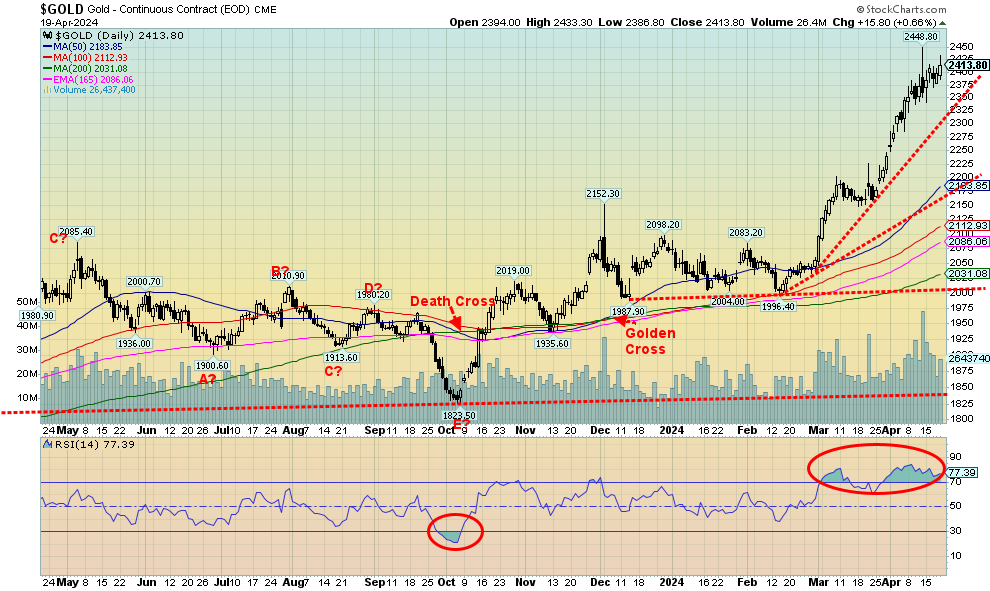
Despite rising interest rates (in the long end of the yield curve) and a rising US$ Index, gold once again managed to go against that, gaining 2.2% this past week. This seems to be prompted by fear of expansion of the Russia/Ukraine war and, increasingly, the risk of a much bigger war in the Middle East as the focus moves from Israel/Hamas to Israel/Iran. The bombing this week of some facilities in Isfahan, Iran sparked concern of a bigger conflict. While the hit was largely a slap on the wrist, it did have its impact. Corrections along the way would help with the overbought conditions as gold’s RSI has been at 70 or higher now since mid-March. However, a powerful bull market appears to be underway and the RSI can stay higher for longer. The commercial COT is not overly friendly at 27.2%. We’d prefer to see that well over 30. But the 2009–2011 bull saw the commercial COT remain below 30 throughout.
Gold is now up 16.5% in 2024, outpacing the stock market. Silver gained 2.8%, but the metal that was the big winner this past week was copper, up 4.4% to fresh 52-week highs. We expect that copper is going higher, possibly over $5. The all-time copper high was at $5.04 for front month futures set in March 2022. We have now passed the point that suggests new all-time highs lie ahead. Platinum lost 4.7% while palladium was down 3.0%. Both have struggled in 2024, particularly platinum which should be more closely aligned with gold. Platinum is also known as white gold. The gold stock indices were mixed with the Gold Bugs Index (HUI) off about 0.1% and the TSX Gold Index (TGD) up 0.5%. They both seemed to be trading more in line with the stock market that fell this past week.
Gold rising despite rising long interest rates and a rising US$ Index is interesting, as it appears to indicate a shift in sentiment. Yes, we have the fear trade, but we also have inflation eroding all fiat currencies. They are also concerned about the U.S. dollar and the U.S.’s dominance in international bodies such as the IMF. Attempts to take Russia’s assets are also catching their attention, as they believe if it can happen to Russia it could happen to them as well. We also see a rise in demand by central banks to shore up their gold reserves to protect their currency.
We appear to have entered a strong bull market with potential targets now up to $2,500/$2,600. A drop through $2,350 now could signal a correction. Below $2,250 would give a better sell signal. But with this strong market and a background conducive to gold, our expectations are for higher prices. A reminder that gold has no liability, it has been currency and money for over 5,000 years, it’s real (unlike Bitcoin), and when confidence is flagging against government it acts as a hedge.
Source: www.stockcharts.com
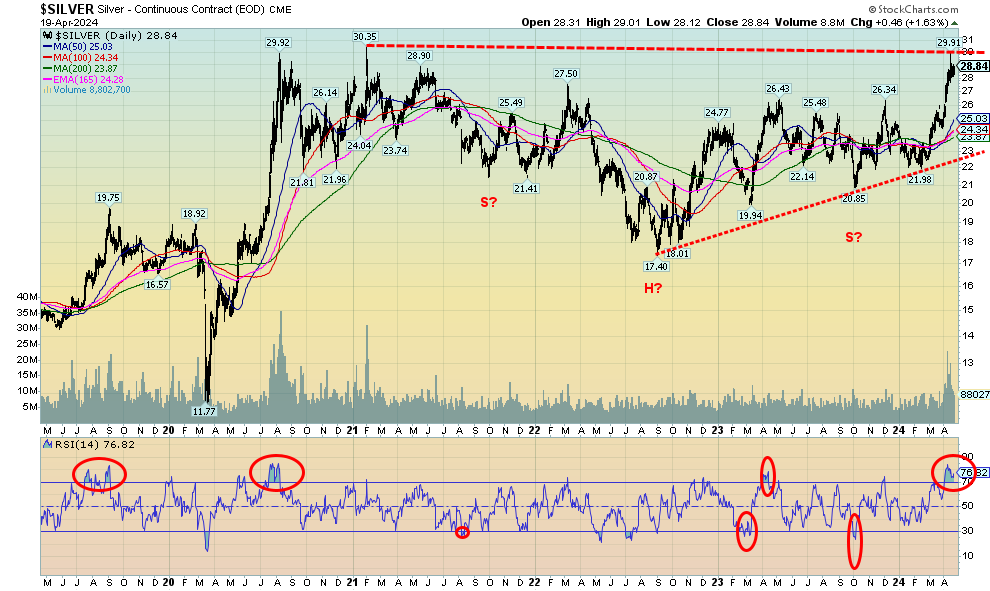
Silver enjoyed another solid week up, gaining 2.8%. Silver is now up 19.7% in 2024. Silver is the poor man’s gold and, with gold soaring to over $2,400, many are instead shifting to silver. That in turn has helped the gold/silver ratio that has fallen to 83.68 last vs. a high of 92.41 in February 2024. Still, that is a long way from the 31.53 seen at the 2011 high and especially the 14.57 level seen at the 1980 high. The latter is more closely aligned with the gold/silver ratio in nature. To reach those levels, silver would need be at $76 to equal 2011 or $164 to equal the 1980 ratio. It assumes gold at $2,400. What’s key for silver will be breaking above $30 and the February 2021 high of $30.35. That in turn could spark a sharper run-up with potential to reach as high as $43 and at least $39/$40, according to that head and shoulders pattern visible on the charts. We’ve noted before the huge potential of a what appears to as a multi-year cup and handle pattern that could project to $75. Global silver demand is projected to reach 1.2 billion ounces in 2024, roughly the same as 2023. Industrial demand and, increasingly, demand for investment purposes are driving prices higher. Production in 2023 was 25,831 metric tonnes but demand was 37,168 metric tonnes. The shortfall of 11,377 metric tonnes has to be made up with melt of old silver (scrap silver). Demand could be higher in 2024. India had record imports in 2023. The commercial COT isn’t too friendly at 27.8%. We’d prefer to see that over 40%. Volume has picked up recently, suggesting buying power behind the up move. We’re optimistic that silver prices should soon be through $30.35 and then move to higher targets near $40. A drop back through $27.50 would be our first sell signal. Back under $26 would confirm a breakdown.
Source: www.stockcharts.com
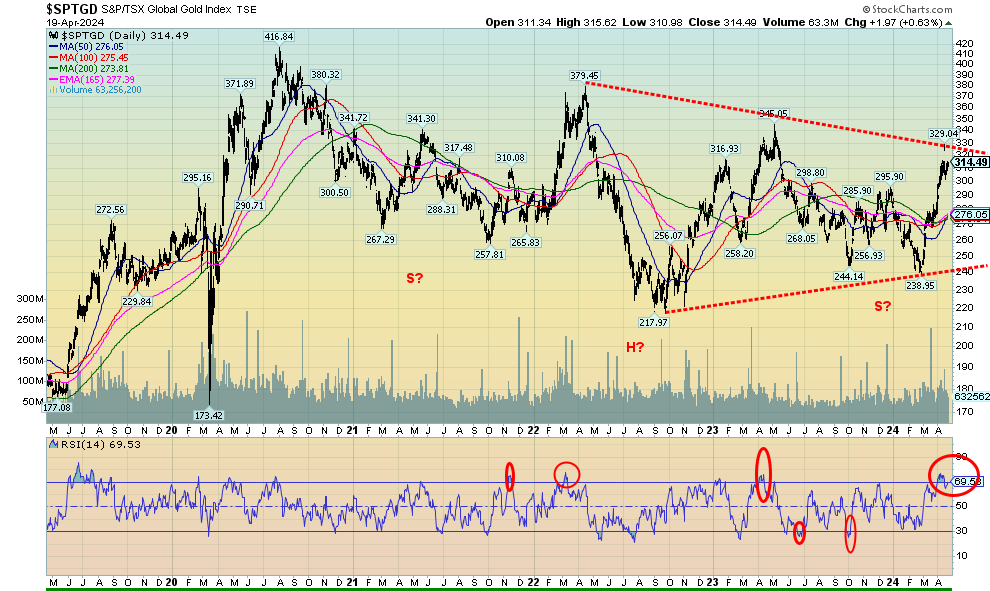
The gold stock indices did not do a lot this past week, despite an up week from both gold and silver. In that respect they underperformed. They may have been influenced by the weak broader stock market that sold off. On the week, the TSX Gold Index (TGD) gained 0.5% while the Gold Bugs Index (HUI) lost about 0.1%. It was the second down week in a row for the HUI. However, the declines were very small. The TGD gained both weeks but not a lot. This leaves the TGD hanging above the 300 breakout point but under another breakout over 330. We seem to be indicating that we should break above the May high of 345. The rather awkward-looking head and shoulders bottom reversal pattern (awkward as usually the right shoulder does not fall below the left shoulder; thus, it makes the pattern somewhat suspect) points to potential targets up to around 425/430. The all-time high of 455 was set in 2011. The 417 high of August 2020 was the closest we’ve been since. We did get a little overbought, but not seriously. The odds continue to favour higher prices for the gold stocks that remain grossly undervalued vs. the price of gold. And, as we note next, gold and gold stocks make up a very small proportion of global assets. Ergo, that’s why these indices can be volatile as the market is quite small by comparison. The gold miners remain cheap despite the recent run-up. And they remain cheap vs. gold as well with the Gold/HUI ratio at 9.19. At its lows through 2003–2006, lows were seen at 1.6. Even in gold stock rallies in 2016 and 2020 the ratio got between 4.75 and 5.30. 5.30 today would imply that the HUI would be 450/455. The HUI’s all-time high was 639 in 2011. Today, that would imply a Gold/HUI ratio of 3.75. If we ever got down to those 2006 lows, the HUI would be at 1,500. Instead, today it is at 263 while gold is at $2,400. We have a way to go.
Source: www.crescat.net, www.bloomber, www.mckinsey.com, www.erste.com, Courtesy of Octavio Tavi Costa of Crescat Capital
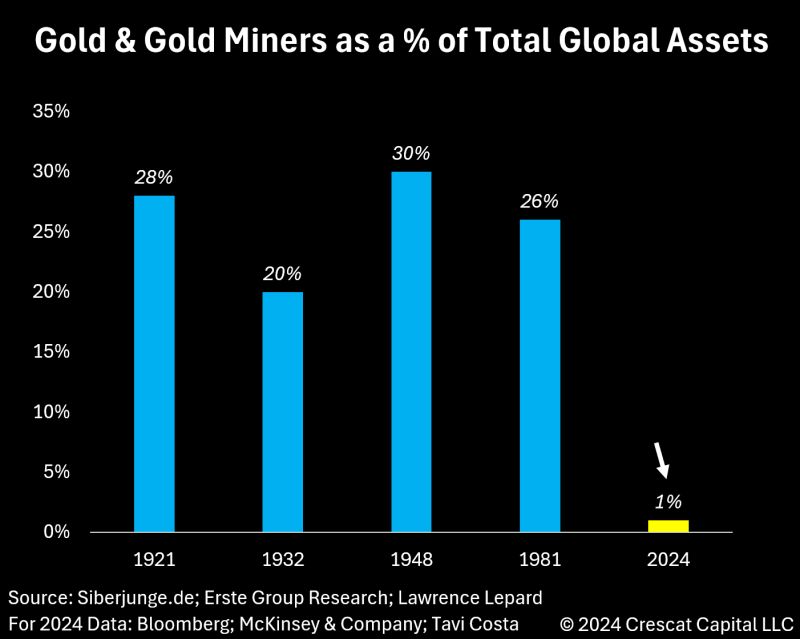
We’ve always said that gold and gold miners were a small percentage of total global assets. Now here is a chart that appears to support that thesis. According to this chart, gold and gold miners are at their lowest point in the past century as a share of global assets. This also fits our own thoughts that the past decade since the top in the gold and gold miners’ market in 2011 has, for the most part, been in a depression. We are now seeing signs that this could be changing. Could it be another false hope as was seen in 2016 and again in 2020/2021 or are we to embark on an historical bull market as we saw from 2001 to 2011? The market is small and it wouldn’t take much of shift from the broader market into gold and the gold miners to move the market higher quickly.
Read the full report: Technical Scoop: Topping Signs, Material Rise, Defensive Energy
Disclaimer
David Chapman is not a registered advisory service and is not an exempt market dealer (EMD) nor a licensed financial advisor. He does not and cannot give individualised market advice. David Chapman has worked in the financial industry for over 40 years including large financial corporations, banks, and investment dealers. The information in this newsletter is intended only for informational and educational purposes. It should not be construed as an offer, a solicitation of an offer or sale of any security. Every effort is made to provide accurate and complete information. However, we cannot guarantee that there will be no errors. We make no claims, promises or guarantees about the accuracy, completeness, or adequacy of the contents of this commentary and expressly disclaim liability for errors and omissions in the contents of this commentary. David Chapman will always use his best efforts to ensure the accuracy and timeliness of all information. The reader assumes all risk when trading in securities and David Chapman advises consulting a licensed professional financial advisor or portfolio manager such as Enriched Investing Incorporated before proceeding with any trade or idea presented in this newsletter. David Chapman may own shares in companies mentioned in this newsletter. Before making an investment, prospective investors should review each security’s offering documents which summarize the objectives, fees, expenses and associated risks. David Chapman shares his ideas and opinions for informational and educational purposes only and expects the reader to perform due diligence before considering a position in any security. That includes consulting with your own licensed professional financial advisor such as Enriched Investing Incorporated. Performance is not guaranteed, values change frequently, and past performance may not be repeated.
About the author


Website: https://www.enrichedinvesting.com
Disclaimer: David Chapman is not a registered advisory service and is not an exempt market dealer (EMD) nor a licensed financial advisor. We do not and cannot give individualised market advice. David Chapman has worked in the financial industry for over 40 years including large financial corporations, banks, and investment dealers. The information in this newsletter is intended only for informational and educational purposes. It should not be considered a solicitation of an offer or sale of any security. The reader assumes all risk when trading in securities and David Chapman advises consulting a licensed professional financial advisor before proceeding with any trade or idea presented in this newsletter. David Chapman may own shares in companies mentioned in this newsletter. We share our ideas and opinions for informational and educational purposes only and expect the reader to perform due diligence before considering a position in any security. That includes consulting with your own licensed professional financial advisor.