The full weekly commentary is available on GoldSeek -- Silver excerpt is below:

Source: www.stockcharts.com
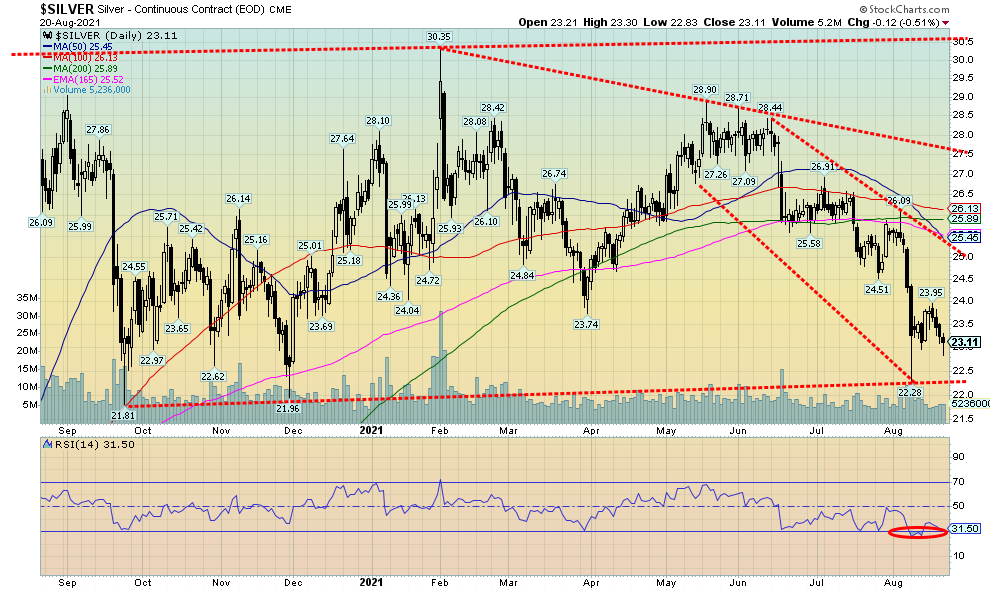
Silver prices are struggling. Strange for a sector in supply deficits. Like gold, silver spiked sharply downward on August 9, hitting a low of $22.28 that was perilously close to the November 2020 low of $21.96 and the September 2020 low of $21.81. We view those areas as key support. The spike down on August 9 was followed by a strong rebound the same day and silver closed the day at $23.27 a good $1 higher. Since then, silver has waffled, failing to get back over $24 and this past week fell 2.8%, leaving silver down 12.5% on the year and down about 24% from its high seen in February 2021. Like gold, we could argue two things here but it is the bear case that is dominating. Silver is forming a potentially huge descending triangle with a relatively flat bottom along $22 and declining highs with the key on the high at $30.35, but since then highs were seen at $28.90, next at $26.91, and then lastly at $26.09. A firm breakdown under $22 could in theory target silver to collapse to $14. If that happened, and we can’t rule it out, then that would, we believe, coincide with the key cycle lows we are looking at for gold. Silver generally follows gold but its cycles are slightly different. Our concern here is that silver tends to lead, both up and down, and right now silver is outperforming to the downside. Silver’s RSI has fallen under 30 or just around that level so a rebound could be in the offing. But there is strong resistance up to $25 with interim resistance at $24. Failure to break over those levels would be quite negative and we have to look out below. Ultimately, silver needs to break over $27.50 to convince us that this is over. Right now, the bear case is dominating despite the desires of the letter writers.

Source: www.cotpricecharts.com
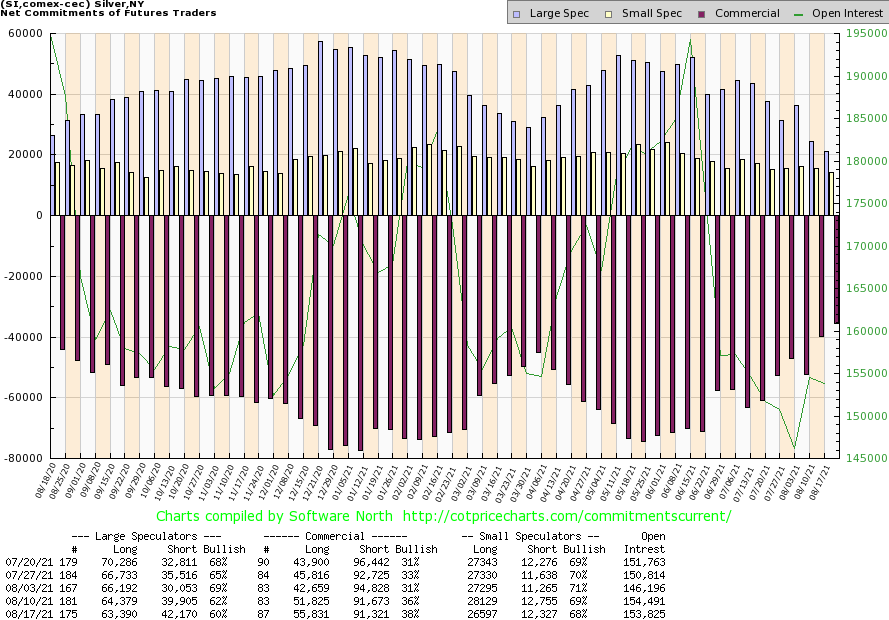
Further improvement for the silver commercial COT that jumped to 38% this past week from 36% the previous week. While the short open interest position was relatively unchanged, long open interest rose roughly 4,000 contracts. The large speculators COT got more bearish, falling to 60% from 62% as the large speculators added almost 3,000 contracts to their short open interest while long open interest fell about 1,000 contracts. At significant lows the commercial COT is usually rising while the large speculators COT is falling. We’d love to see the commercial COT over 40% to help convince us that low could be nigh.

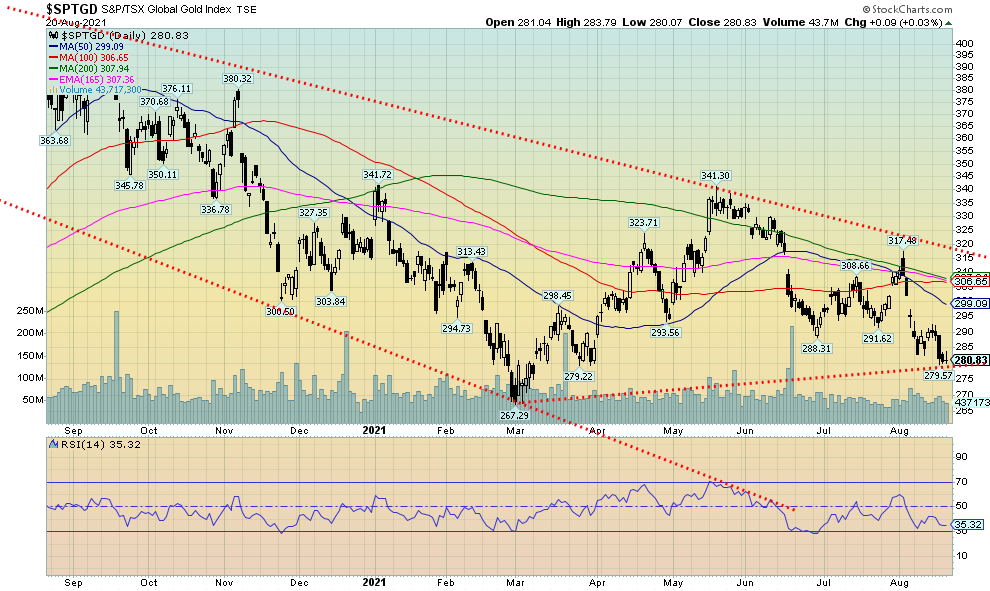
Woe is the gold stocks. They are in a real bear market. And now that bear market in the intermediate and senior gold stocks is flowing into the junior exploration market where we saw a number of small juniors get hit this past week on what we believe was profit-taking, which it was done on very low volume. The TSX Venture Exchange (CDNX), an index more than 50% of which are junior mining stocks, is down 22% from its recent high but a number of junior exploration gold stocks are down 30% to 50% from their highs. The drop in the gold stocks has been on low or at least receding volume. The Gold Bugs Index (HUI) fell 5.9% this past week and is now down almost 20% on the year. The HUI also made a fresh 52-week low. Overall, the HUI is down almost 36% from its August 2020 high. The TSX Gold Index (TGD) is actually faring better, down only 3.1% this past week, down 10.9% on the year and down about 33% from the August 2020 high. The HUI, as noted, made new lows, while the TGD did not—a divergence. Yes, they do have different components with the HUI having more of an international bent whereas the TGD is primarily Canadian-based gold stocks.
With the gold stocks entrenched in bear territory, one is naturally seeking a low. Both indices are treading in oversold territory for many indicators. Sentiment, as measured by the Gold Miners Bullish Percent Index (BPGDM), is at 30%, nowhere near the low of 24.14% seen at the March lows and definitely nowhere near the 7.69% seen in March 2020 or the absolute 0% in December 2015. The BPGDM has room to move lower. Numerous gold letter writers remain upbeat and bullish, but the reality is the gold stocks have been in a bear market for a number of months now. The TGD needs to regain back above 300 for some sign of relief. The TGD doesn’t fully break out until it is firmly over 315, some distance from the current 280. Support is down to the March low at 267, a level that should provide solid support.
Read the full report: https://goldseek.com/article/technical-scoop-delta-rise-heat-impact-gold-view-toppy-market-downward-revision-taper-watch
Copyright David Chapman, 2021
|
Charts and commentary by David Chapman Chief Strategist, Enriched Investing Inc. Phone: 416-523-5454 Email: david@davidchapman.comdchapman@enrichedinvesting.com Twitter: @Davcha12 August 23, 2021 |
Disclaimer
|
GLOSSARY Trends Daily – Short-term trend (For swing traders) Weekly – Intermediate-term trend (For long-term trend followers) Monthly – Long-term secular trend (For long-term trend followers) Up – The trend is up. Down – The trend is down Neutral – Indicators are mostly neutral. A trend change might be in the offing. Weak – The trend is still up or down but it is weakening. It is also a sign that the trend might change. Topping – Indicators are suggesting that while the trend remains up there are considerable signs that suggest that the market is topping. Bottoming – Indicators are suggesting that while the trend is down there are considerable signs that suggest that the market is bottoming. |
David Chapman is not a registered advisory service and is not an exempt market dealer (EMD) nor a licensed financial advisor. We do not and cannot give individualised market advice. David Chapman has worked in the financial industry for over 40 years including large financial corporations, banks, and investment dealers. The information in this newsletter is intended only for informational and educational purposes. It should not be considered a solicitation of an offer or sale of any security. Every effort is made to provide accurate and complete information. However, we cannot guarantee that there will be no errors. We make no claims, promises or guarantees about the accuracy, completeness, or adequacy of the contents of this commentary and expressly disclaim liability for errors and omissions in the contents of this commentary. David Chapman will always use his best efforts to ensure the accuracy and timeliness of all information. The reader assumes all risk when trading in securities and David Chapman advises consulting a licensed professional financial advisor before proceeding with any trade or idea presented in this newsletter. David Chapman may own shares in companies mentioned in this newsletter. We share our ideas and opinions for informational and educational purposes only and expect the reader to perform due diligence before considering a position in any security. That includes consulting with your own licensed professional financial advisor.


