Excerpt from this week's: Technical Scoop: Fed Unchanged, Precious Lid, Oily Bounce
Source: www.stockcharts.com
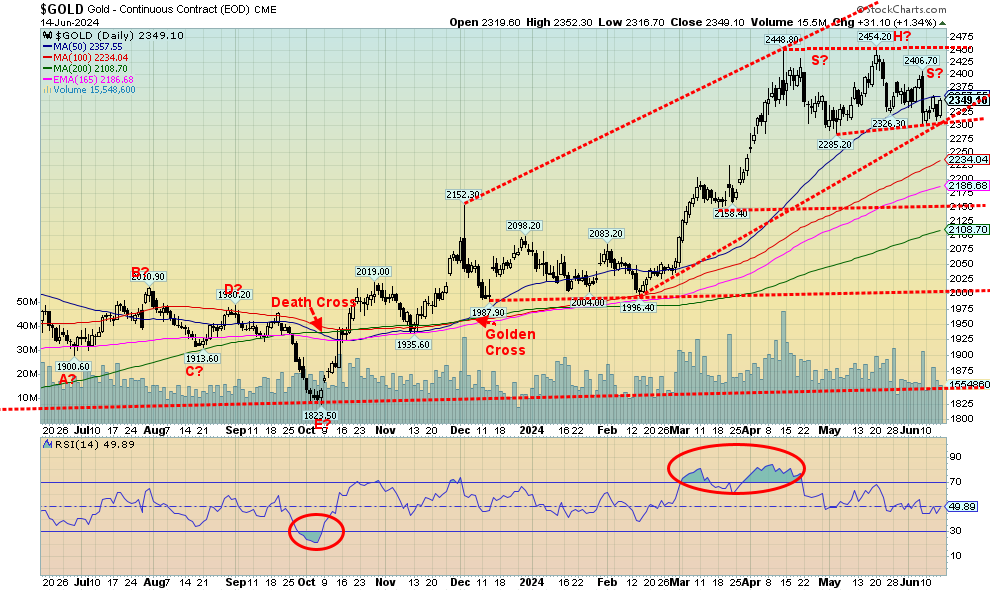
A week ago, we had that sharp scary drop on Friday bringing back memories of April 12/15, 2013 when gold along with silver and the gold stocks crashed. However, the downside follow through has been negligible and we spent the week basically whipsawing with ups and downs closing the week slightly up. It might be the sign we are trying to make a bottom but then we observed a potential small head and shoulders top pattern (it’s not a clean one) so we will have to watch $2,300 for any potential breakdown. Potential targets on the H&S pattern are $2,125/$2,150. However, if we were to regain back above $2,400 then we’d negate the potential H&S pattern. Until then we wait but be wary of a break under $2,300. It could break but unless it is sustained it could be a false hook.
On the week gold gained 1.0%, silver was up an anemic 0.1% while platinum was hit again falling 1.3%. Of the near PMs palladium was down 2.7% while copper was up a feeble 0.2%. The Gold Bugs Index (HUI) fell 0.4% while the TSX Gold Index (TGD) was off 0.9%. Gold, silver and the gold stock indices remain up in 2024 but platinum is in negative territory. It’s surprising for what is known as white gold as it is rarer than gold itself.
Nonetheless, gold remains in solid demand from central banks particularly Asia and steady demand in India and China. As we keep repeating gold has been around for upwards of 3,000 years as money and of course as jewelry because of its lustrous quality and doesn’t tarnish. And also, as we often say, gold is no one’s liability. Money is worth more when it is backed by something other than the governments promise to pay (an IOU).
Under a gold standard, things were generally more stable but when the gold standard was removed things
became more volatile as debt and money grew. Given today’s unsustainable debt and massive monetary growth there are those who believe that a return to a gold standard of some sort is inevitable to bring stability. China and Russia haven’t been buying gold just because they like the colour. The purpose is to bring stability to the yuan and ruble and strengthen their currency as they continue the process of de-dollarization.
Gold has gained some 35% since that low last October 2023 so pullbacks are not unusual. Despite the current correction the trend remains firmly to the upside. This is the second corrective period since that low so this might be a fourth wave up. The fifth wave up could take us as high as $2,800 once we surpass $2,500. May/June is typically a weak period for gold with a stronger up cycle starting in July that could take us into October. The background is there with geopolitical divisions, domestic political divisions, an upcoming deeply divisive election, unsustainable debt, persistent inflation and a slowing economy. Gold has been leading the way with record highs even as silver and the gold stock indices remain well below their all-time highs. The junior gold mining market remains moribund as the focus seems to be more on AI stocks, cryptos and GameStop. It is, however, a small market and if there is any shift started towards it, a sharp rise could follow.
Resistance at $2,400, support at $2,300 and then $2,200.
Source: www.stockcharts.com
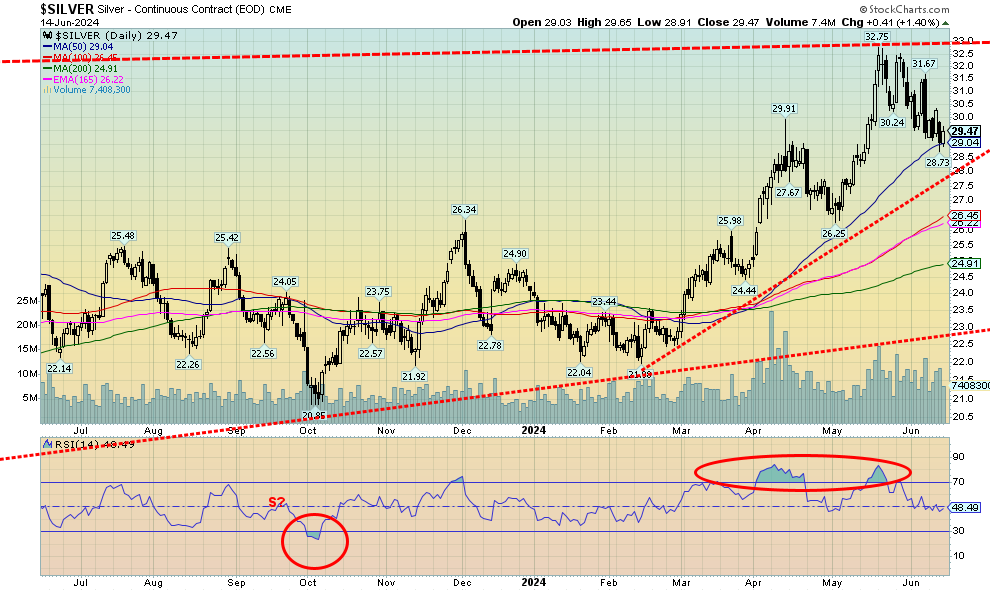
Silver continued its recent correction this past week even as it gained a small 0.1%. We can’t rule out a test of that uptrend line from the February low that is currently near $28. Only a breakout above $32 and particularly the resistance up to $33 would convince us that the correction is over and we’re on our way to the next level with targets up around $39/$40. Many believe targets are considerably higher but we prefer to take it one step at a time. We have dropped from overbought levels but we are not yet oversold with the RSI at a respectable 48. That’s neutral. As with gold, we’ve been a bit volatile of late but nonetheless currently rest on the 50-day MA. A break of $29 could take us down to $28. Regaining $30 might suggest a low but we prefer to use $32 to convince us a low is in.
Source: www.stockcharts.com
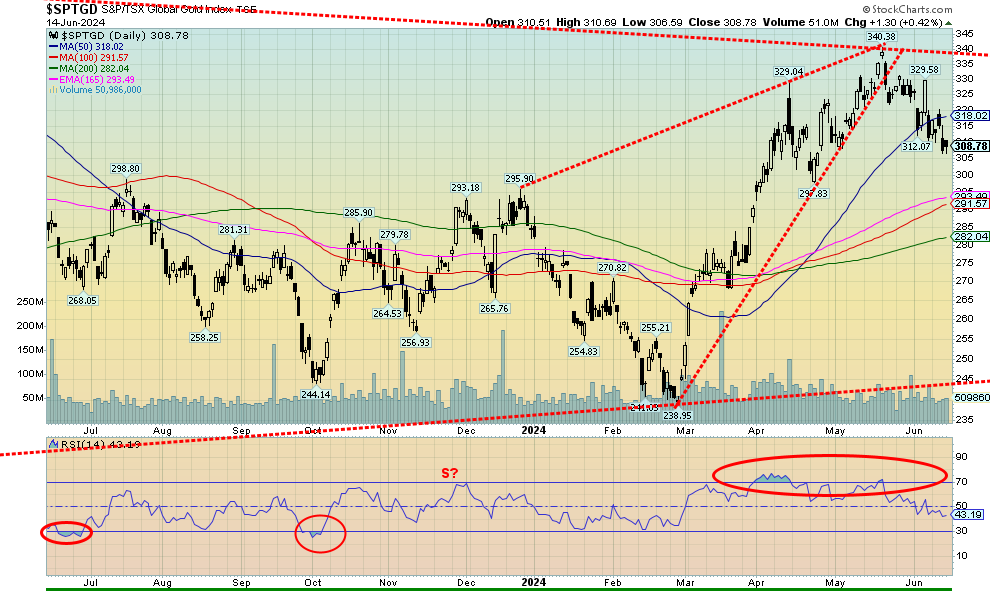
Weakness continues for the gold stocks as they consolidate below potential more important breakout points. On the week the TSX Gold Index (TGD) fell 0.9% while the Gold Bugs Index (HUI) was off 0.4%. Both remain up in 2024 by 8.5% and 7.7% respectively. All this occurred despite gold being up marginally on the week while silver was basically flat. Key points remain for both the TGD and HUI. The TGD needs to firmly take out 340 while the HUI needs to break above 300 to suggest higher prices. Meanwhile we appear to be correcting that good upward move in February to the top in May. The TGD gained 42% during that period so the current 9.5% pullback feels rather normal. During the 2009-2011 bull market for gold stocks where the TGD gained over 200% there were 3 pullbacks of 20% or more. Each pullback served the purpose of shaking out the weak hands as others bought in. So, the current 10% pullback is not unusual especially following a sharp upswing. In fact, the initial 200% plus gain from October 2008 to a high in March 2009 was met with a 25% pullback. May/June tends to be weak seasonally for gold and gold stocks so in many respects this is not a surprise especially after a period of good gains. We still have a potential compelling head and shoulders bottom pattern but we need to firmly break above 340 to confirm the next phase. It has targets up to 540 some 75% from current levels. In the interim we’ve dropped under the 50-day MA so could we test the 200-day MA near 28. Interim support is at 290.
Read the full report: Technical Scoop: Fed Unchanged, Precious Lid, Oily Bounce
Disclaimer
David Chapman is not a registered advisory service and is not an exempt market dealer (EMD) nor a licensed financial advisor. He does not and cannot give individualised market advice. David Chapman has worked in the financial industry for over 40 years including large financial corporations, banks, and investment dealers. The information in this newsletter is intended only for informational and educational purposes. It should not be construed as an offer, a solicitation of an offer or sale of any security. Every effort is made to provide accurate and complete information. However, we cannot guarantee that there will be no errors. We make no claims, promises or guarantees about the accuracy, completeness, or adequacy of the contents of this commentary and expressly disclaim liability for errors and omissions in the contents of this commentary. David Chapman will always use his best efforts to ensure the accuracy and timeliness of all information. The reader assumes all risk when trading in securities and David Chapman advises consulting a licensed professional financial advisor or portfolio manager such as Enriched Investing Incorporated before proceeding with any trade or idea presented in this newsletter. David Chapman may own shares in companies mentioned in this newsletter. Before making an investment, prospective investors should review each security’s offering documents which summarize the objectives, fees, expenses and associated risks. David Chapman shares his ideas and opinions for informational and educational purposes only and expects the reader to perform due diligence before considering a position in any security. That includes consulting with your own licensed professional financial advisor such as Enriched Investing Incorporated. Performance is not guaranteed, values change frequently, and past performance may not be repeated.
About the author


Website: https://www.enrichedinvesting.com
Disclaimer: David Chapman is not a registered advisory service and is not an exempt market dealer (EMD) nor a licensed financial advisor. We do not and cannot give individualised market advice. David Chapman has worked in the financial industry for over 40 years including large financial corporations, banks, and investment dealers. The information in this newsletter is intended only for informational and educational purposes. It should not be considered a solicitation of an offer or sale of any security. The reader assumes all risk when trading in securities and David Chapman advises consulting a licensed professional financial advisor before proceeding with any trade or idea presented in this newsletter. David Chapman may own shares in companies mentioned in this newsletter. We share our ideas and opinions for informational and educational purposes only and expect the reader to perform due diligence before considering a position in any security. That includes consulting with your own licensed professional financial advisor.