Excerpt from this week's: Technical Scoop: Rising Inflation, Golden Haven, Oily Bottom
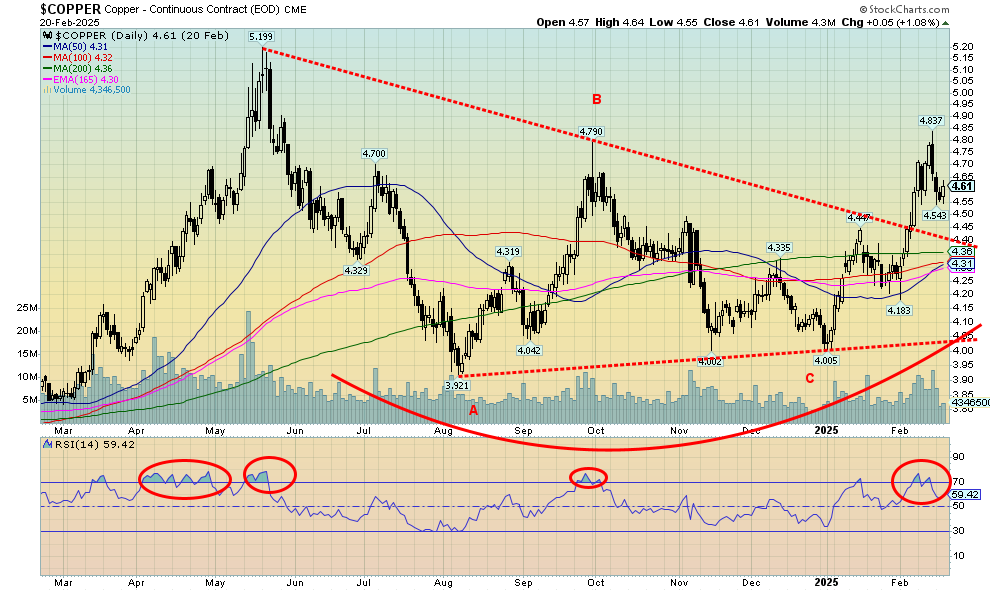
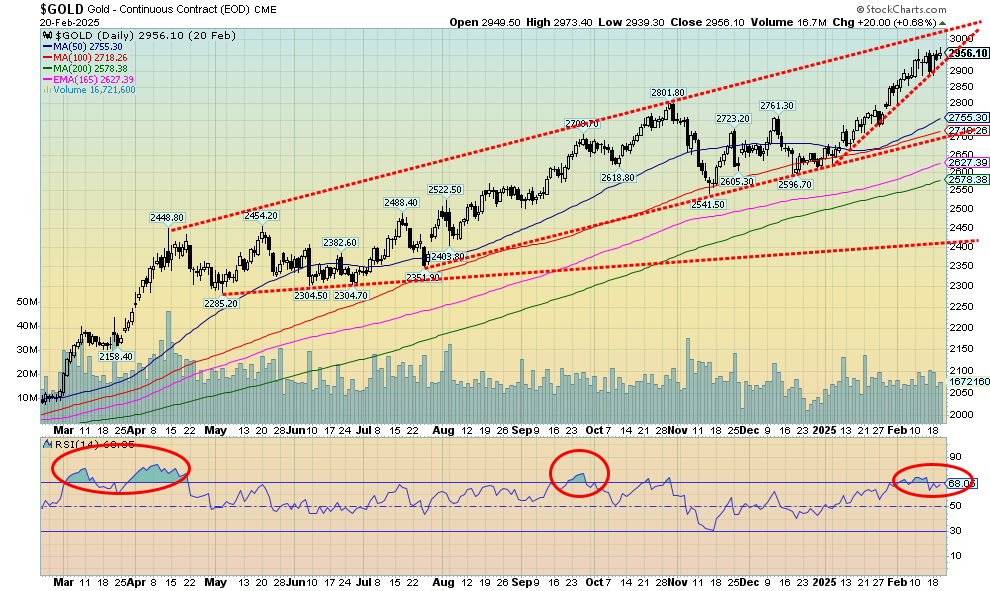
Copper prices have broken out and are rising. This is a sign of inflationary pressures. Copper is also a leading indicator for gold. As noted, gold has already been making new all-time highs. As the chaos continues, we expect it to rise further. We continue to have targets up around $3,600 although expect resistance along the way. There continues to be signs that gold is being pulled out of the London markets and transferred to the U.S. to avoid tariffs down the road. The only bothering sign for gold, at least in the near term is what appears as an ascending wedge triangle. If correct it is short-term bearish and gold, if it were to break under $2,900, could in effect see a decline to $2,700. Gold stocks took it on the chin on Friday Feb 21, 2025 alongside the 700+ point drop for the DJI. Not a good sign. If we do get that break (a real possibility) the next move up for gold would take us to $3,000 and higher.
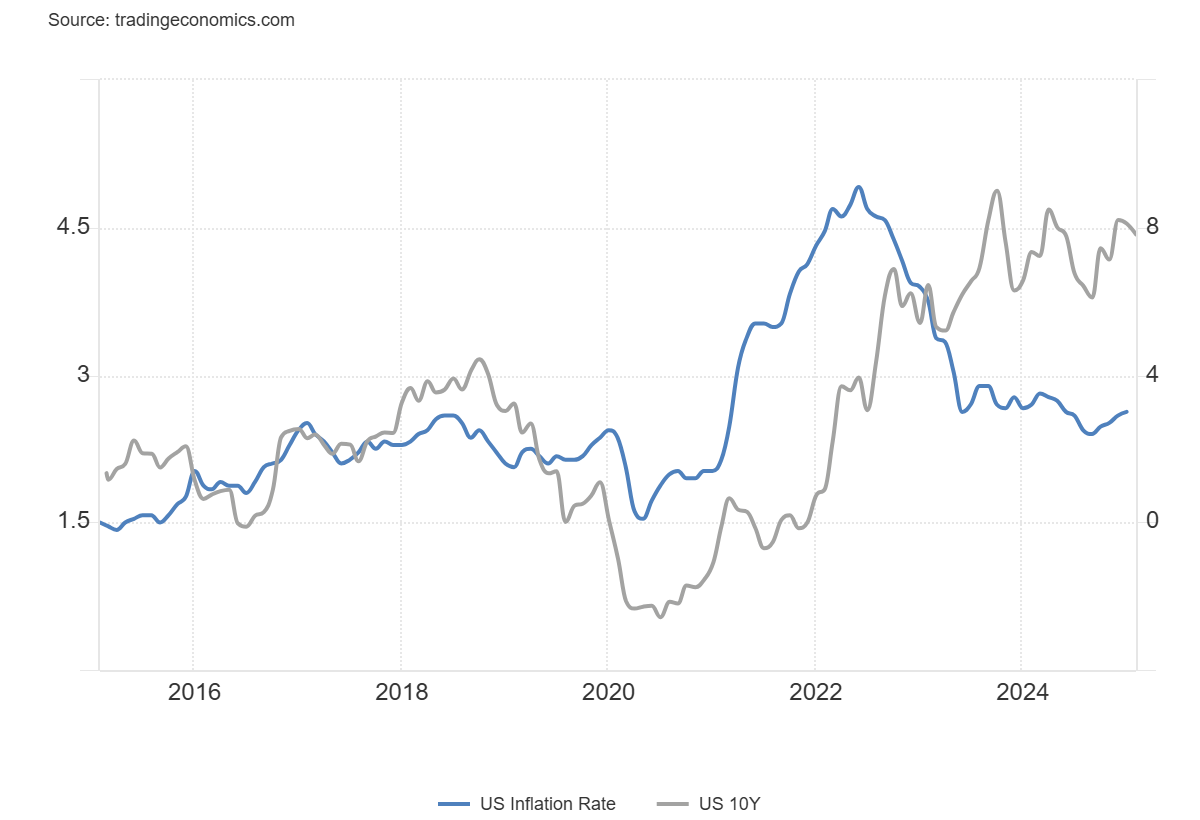
U.S. 10-Year Treasury note vs. CPI rate of change 2016-2025

Source: www.tradingeconomics.com, www.bls.gov

Source: www.stockcharts.com

Source: www.stockcharts.com
Markets & Trends
|
|
|
|
% Gains (Losses) Trends |
|
||||
|
|
Close Dec 31/24 |
Close Feb 21/25 |
Week |
YTD |
Daily (Short Term) |
Weekly (Intermediate) |
Monthly (Long Term) |
|
|
Stock Market Indices |
|
|
|
|
|
|
|
|
|
S&P 500 |
5,881.63 |
6,013.13 (new highs) * |
(1.7)% |
2.2% |
up (weak) |
up |
up |
|
|
Dow Jones Industrials |
42,544.22 |
43,428.02 |
(2.5)% |
2.1% |
neutral |
up |
up |
|
|
Dow Jones Transport |
16,030.66 |
16,034.36 |
(3.5)% |
0.9% |
down (weak) |
up |
up |
|
|
NASDAQ |
19,310.79 |
19,524.01 |
(2.5)% |
1.1% |
neutral |
up |
up |
|
|
S&P/TSX Composite |
24,796.40 |
25,147.03 |
(1.3)% |
1.7% |
neutral |
up |
up |
|
|
S&P/TSX Venture (CDNX) |
597.87 |
634.69 |
(0.9)% |
6.2% |
up |
up |
neutral |
|
|
S&P 600 (small) |
1,408.17 |
1,378.06 |
(3.6)% |
(2.1)% |
down |
up |
up |
|
|
MSCI World |
2,304.50 |
2,478.41 |
0.2% |
7.6% |
up |
up |
up |
|
|
Bitcoin |
93,467.13 |
95,610.98 |
(1.4)% |
2.3% |
down |
up |
up |
|
|
|
|
|
|
|
|
|
|
|
|
Gold Mining Stock Indices |
|
|
|
|
|
|
|
|
|
Gold Bugs Index (HUI) |
275.58 |
320.59 |
(1.6)% |
16.3% |
up |
up |
up |
|
|
TSX Gold Index (TGD) |
336.87 |
402.50 |
(0.4)% |
19.5% |
up |
up |
up |
|
|
|
|
|
|
|
|
|
|
|
|
% |
|
|
|
|
|
|
|
|
|
U.S. 10-Year Treasury Bond yield |
4.58% |
4.43% |
(1.1)% |
(3.3)% |
|
|
|
|
|
Cdn. 10-Year Bond CGB yield |
3.25% |
3.13% |
1.0% |
(3.7)% |
|
|
|
|
|
Recession Watch Spreads |
|
|
|
|
|
|
|
|
|
U.S. 2-year 10-year Treasury spread |
0.33% |
0.23% |
9.5% |
(30.3)% |
|
|
|
|
|
Cdn 2-year 10-year CGB spread |
0.30% |
0.39% |
5.4% |
30.0% |
|
|
|
|
|
|
|
|
|
|
|
|
|
|
|
Currencies |
|
|
|
|
|
|
|
|
|
US$ Index |
108.44 |
106.64 |
0.1% |
(1.7)% |
down |
up |
up |
|
|
Canadian $ |
69.49 |
.7025 |
(0.4)% |
1.1% |
up |
down |
down |
|
|
Euro |
103.54 |
104.59 |
(0.3)% |
1.0% |
up |
down |
down |
|
|
Swiss Franc |
110.16 |
111.45 |
0.3% |
1.2% |
up |
down |
neutral |
|
|
British Pound |
125.11 |
126.29 |
0.3% |
0.9% |
up |
down |
neutral |
|
|
Japanese Yen |
63.57 |
67.03 |
2.1% |
5.4% |
up |
neutral |
down |
|
|
|
|
|
|
|
|
|
|
|
|
|
|
|
|
|
|
|
|
|
|
Precious Metals |
|
|
|
|
|
|
|
|
|
Gold |
2,641.00 |
2,953.20 (new highs) * |
1.8% |
11.8% |
up |
up |
up |
|
|
Silver |
29.24 |
33.01 |
0.5% |
12.9% |
up |
up |
up |
|
|
Platinum |
910.50 |
987.7 |
(3.1)% |
8.5% |
neutral |
up |
up (weak) |
|
|
|
|
|
|
|
|
|
|
|
|
Base Metals |
|
|
|
|
|
|
|
|
|
Palladium |
909.80 |
990.90 |
(1.8)% |
8.9% |
up (weak) |
up (weak) |
down |
|
|
Copper |
4.03 |
4.56 |
(2.2)% |
13.2% |
up |
up |
up (weak) |
|
|
|
|
|
|
|
|
|
|
|
|
Energy |
|
|
|
|
|
|
|
|
|
WTI Oil |
71.72 |
70.40 |
(0.4)% |
(1.8)% |
down |
down (weak) |
down |
|
|
Nat Gas |
3.63 |
4.27 (new highs) |
14.5% |
17.6% |
up |
up |
neutral |
|
Source: www.stockcharts.com
* New All-Time Highs
Note: For an explanation of the trends, see the glossary at the end of this article.
New highs/lows refer to new 52-week highs/lows and, in some cases, all-time highs.
Read the FULL report here: Technical Scoop: Rising Inflation, Golden Haven, Oily Bottom
Disclaimer
David Chapman is not a registered advisory service and is not an exempt market dealer (EMD) nor a licensed financial advisor. He does not and cannot give individualised market advice. David Chapman has worked in the financial industry for over 40 years including large financial corporations, banks, and investment dealers. The information in this newsletter is intended only for informational and educational purposes. It should not be construed as an offer, a solicitation of an offer or sale of any security. Every effort is made to provide accurate and complete information. However, we cannot guarantee that there will be no errors. We make no claims, promises or guarantees about the accuracy, completeness, or adequacy of the contents of this commentary and expressly disclaim liability for errors and omissions in the contents of this commentary. David Chapman will always use his best efforts to ensure the accuracy and timeliness of all information. The reader assumes all risk when trading in securities and David Chapman advises consulting a licensed professional financial advisor or portfolio manager such as Enriched Investing Incorporated before proceeding with any trade or idea presented in this newsletter. David Chapman may own shares in companies mentioned in this newsletter. Before making an investment, prospective investors should review each security’s offering documents which summarize the objectives, fees, expenses and associated risks. David Chapman shares his ideas and opinions for informational and educational purposes only and expects the reader to perform due diligence before considering a position in any security. That includes consulting with your own licensed professional financial advisor such as Enriched Investing Incorporated. Performance is not guaranteed, values change frequently, and past performance may not be repeated.


