
Excerpt from this week's: Technical Scoop: Precious Swoon, Upward Oil, Rates Diverged
Gold and silver
Source: www.stockcharts.com
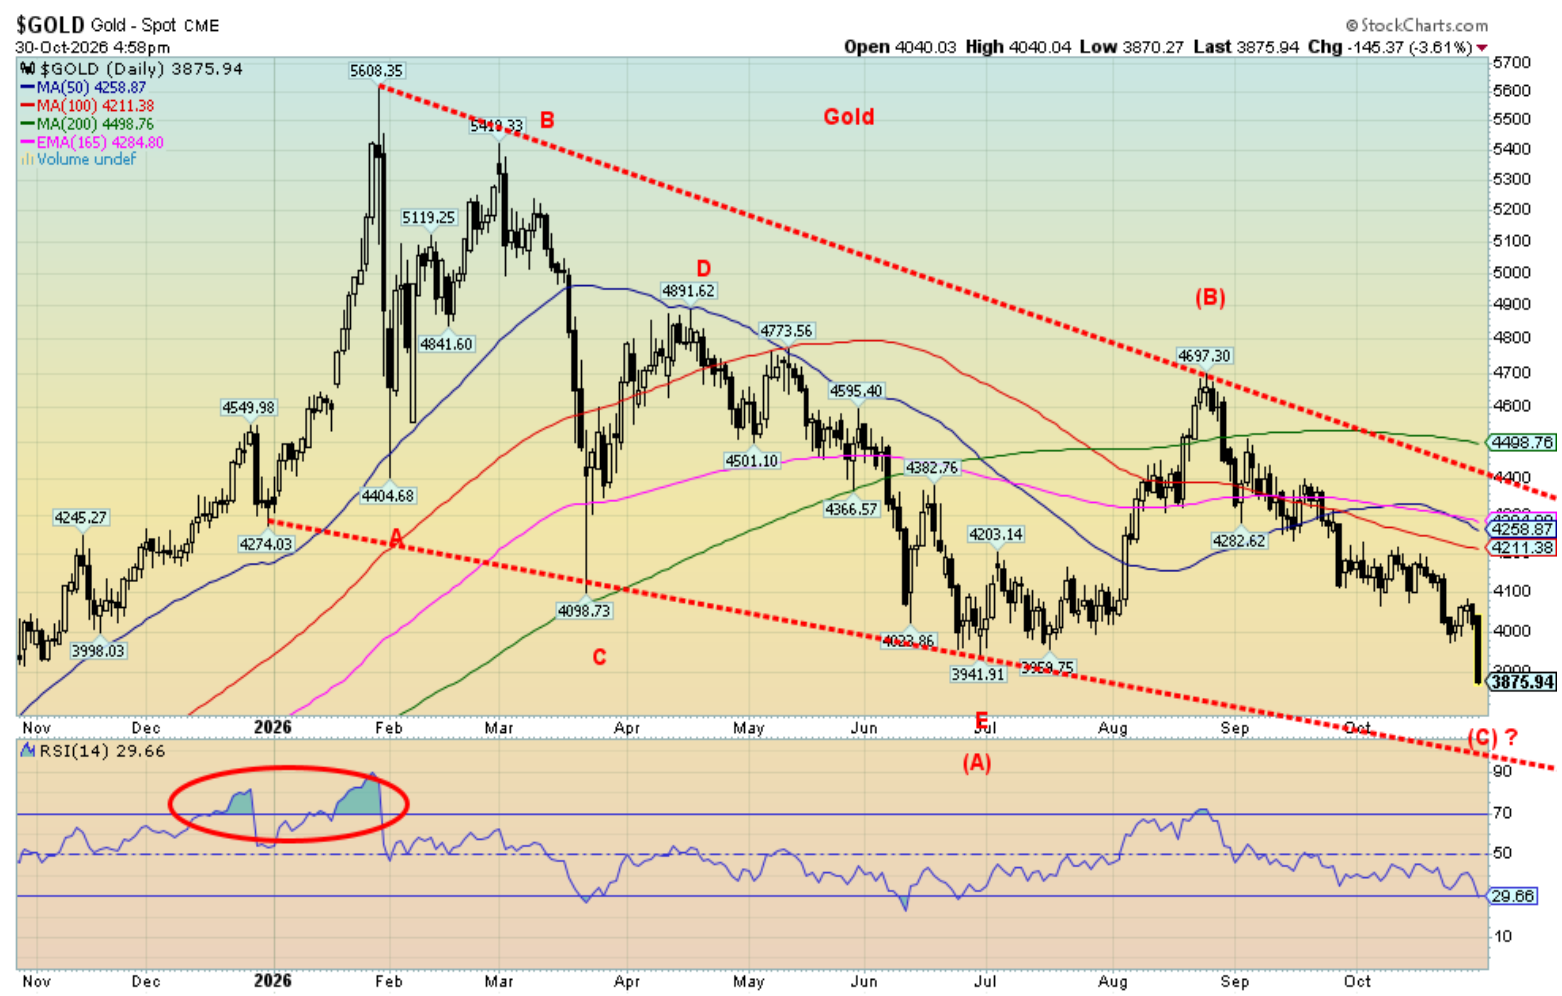
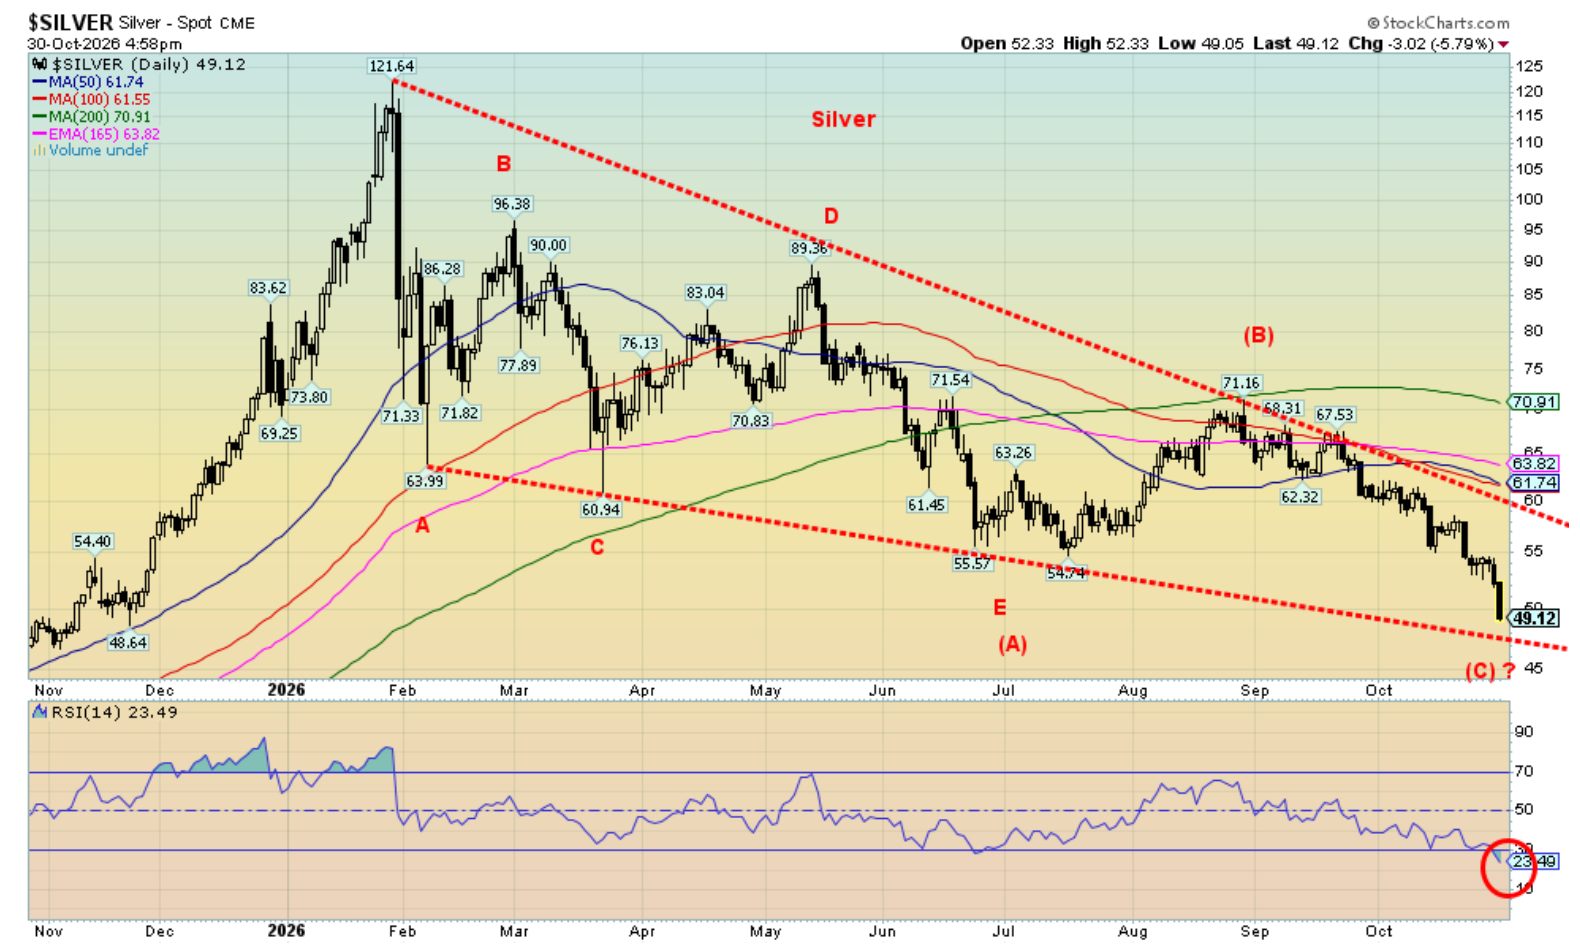
If you see gold traders jumping out of windows, don’t worry. They always do that at bottoms. We’re sure a few might have been doing that this past week as both gold and silver plunged to new lows for the down move since that January 2026 top. Gold is now down about 31% from that top. Silver is worse, down about 60%.
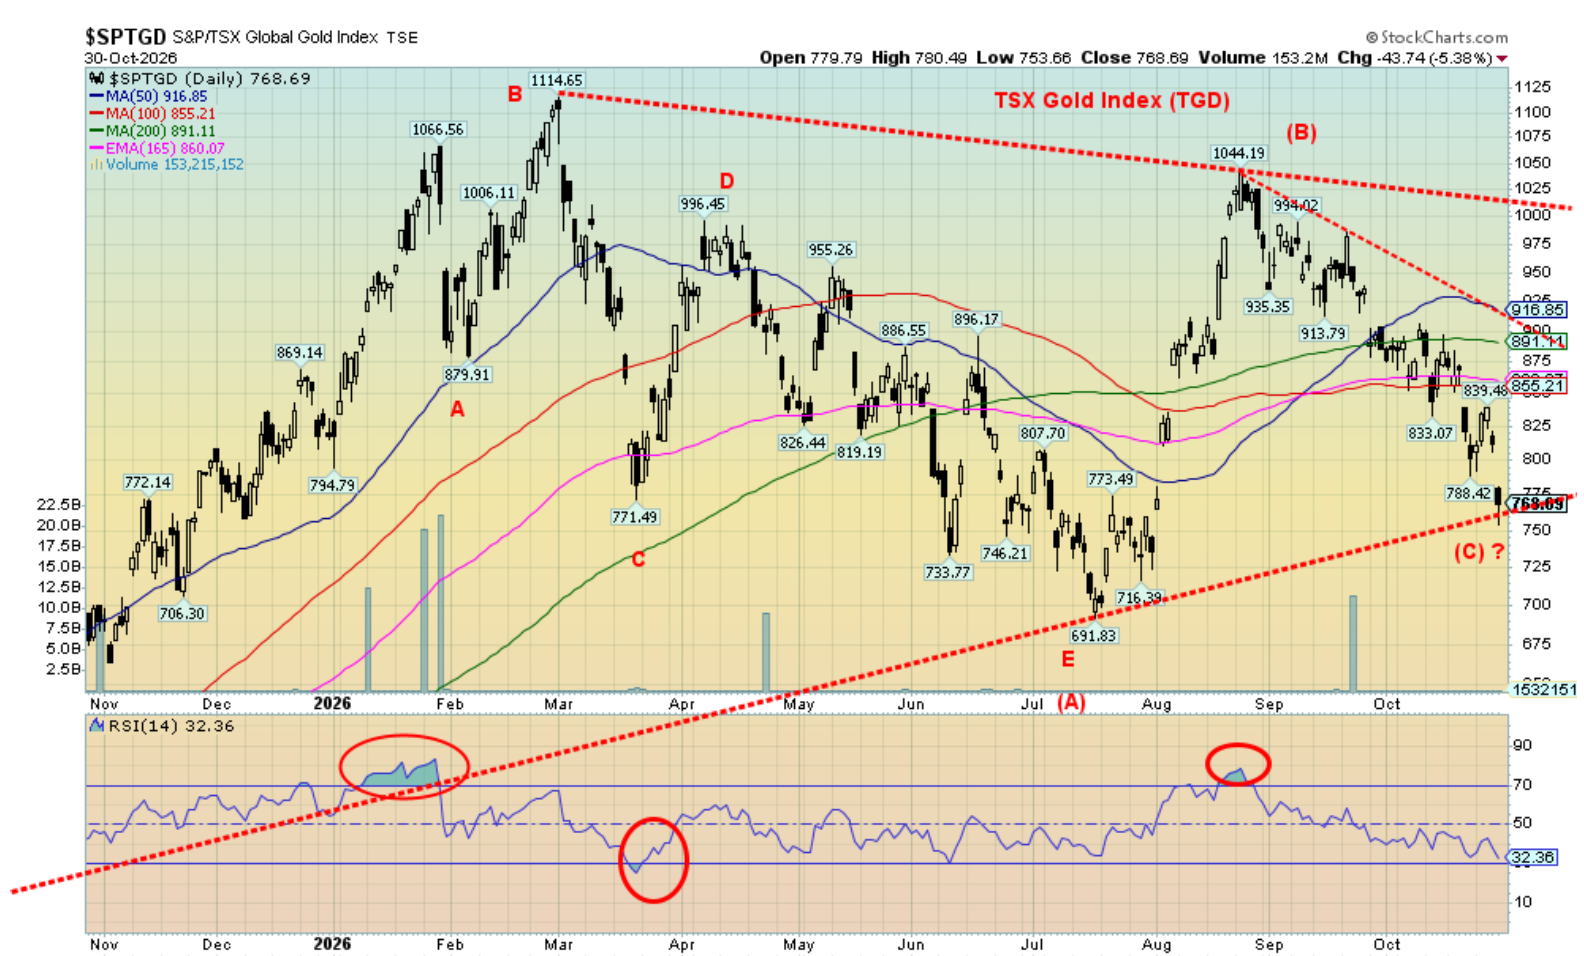
In the financial crisis crash of 2008, gold fell 34% while silver dropped 60%. The gold stocks were massacred as the Gold Bugs Index (HUI) fell 71% and the TSX Gold Index (TGD) dropped 60%. This time? At its worst, so far the HUI fell 41% and the TGD was down 38%. The remarkable thing is that while both gold and silver have made new lows for the move both the HUI and the TGD remain nicely above their recent lows. A divergence?
We’re seeing a lot of fear in the market. One thing we have noted is in 2022, just before the midterm elections, gold and silver made their bottom. The bottom was actually in late September with a secondary low in late October. Nonetheless, it marked the low for the move and gold rose for the next two and half years. Is that a given? No. The wild card is the midterms. If the Democrats win big, that might give the stock markets the signal to continue their sell-off. That in turn could drag the precious metals market down with it.
October was a scary month for gold and silver. Gold fell 6.8% but silver was scarier, down 18.7% and now hitting that crucial $50 support zone. The HUI fell 12.2% while the TGD dropped 13.2%. Scarier still was platinum, down 16.6%, and palladium, down 19.5%.
That was the week too as gold fell 2.9%, silver was down 8.7%, the HUI was off 3.9%, and the TGD was down 4.2%. Platinum fell 7.6% and palladium dropped under $1,000, off 6.4%. Copper was the star. It was flat last week and off only 1.1% on the month while making a record high at one point. Copper remains our leader. The others will follow.
Source: www.stockcharts.com
We can’t help but notice that gold and silver are oversold as measured by the RSI indicator. Readings under 30 are oversold. The HUI and TGD are close but are not yet under 30. Our chart of gold suggests we could fall further to the lower trend line, but silver appears to be making a falling wedge triangle (bullish) and is at/near support. While we closed just under $50, we view the zone as major support. Gold is also at support, but recognize it could fall towards $3,500/$3,600. The gold stocks (HUI, TGD) are also at support levels. We also appear to be completing what could be a larger ABC pattern to the downside.
We are encouraged by the outperformance of the HUI and TGD vs. gold and silver. It is essential that the gold stocks lead if we are to come out of this current malaise. The recent sell-off appears to be more of a response
to the sell-off in the equity market then it is to anything fundamentally wrong with gold and silver. The currencies did nothing this past week with most of them up or down marginally.
Fundamentally, with monstrous debts and budget deficits coupled with continued buying by the central banks as they sell U.S. treasuries and buy gold, this is an encouraging sign that this sell-off is just temporary. Given the huge run-up from 2022 to 2026 (gold gained almost 200% while silver leaped almost 300%), it shouldn’t be a surprise we’ve been hit with an overdue correction. Of course, for the gold bugs it’s a disaster. Maybe they should have better locks on their windows.
Source: www.stockcharts.com
Read the FULL report here: Technical Scoop: Precious Swoon, Upward Oil, Rates Diverged
Copyright David Chapman 2026
Disclaimer
David Chapman is not a registered advisory service and is not an exempt market dealer (EMD) nor a licensed financial advisor. He does not and cannot give individualised market advice. David Chapman has worked in the financial industry for over 40 years including large financial corporations, banks, and investment dealers. The information in this newsletter is intended only for informational and educational purposes. It should not be construed as an offer, a solicitation of an offer or sale of any security. Every effort is made to provide accurate and complete information. However, we cannot guarantee that there will be no errors. We make no claims, promises or guarantees about the accuracy, completeness, or adequacy of the contents of this commentary and expressly disclaim liability for errors and omissions in the contents of this commentary. David Chapman will always use his best efforts to ensure the accuracy and timeliness of all information. The reader assumes all risk when trading in securities and David Chapman advises consulting a licensed professional financial advisor or portfolio manager such as Enriched Investing Incorporated before proceeding with any trade or idea presented in this newsletter. David Chapman may own shares in companies mentioned in this newsletter. Before making an investment, prospective investors should review each security’s offering documents which summarize the objectives, fees, expenses and associated risks. Although Artificial Intelligence (AI) may be deployed from time to time, AI output is monitored and adjusted, if necessary, for accuracy. David Chapman shares his ideas and opinions for informational and educational purposes only and expects the reader to perform due diligence before considering a position in any security. That includes consulting with your own licensed professional financial advisor such as Enriched Investing Incorporated. Performance is not guaranteed, values change frequently, and past performance may not be repeated.
About the author


Website: https://www.enrichedinvesting.com
Disclaimer: David Chapman is not a registered advisory service and is not an exempt market dealer (EMD) nor a licensed financial advisor. We do not and cannot give individualised market advice. David Chapman has worked in the financial industry for over 40 years including large financial corporations, banks, and investment dealers. The information in this newsletter is intended only for informational and educational purposes. It should not be considered a solicitation of an offer or sale of any security. The reader assumes all risk when trading in securities and David Chapman advises consulting a licensed professional financial advisor before proceeding with any trade or idea presented in this newsletter. David Chapman may own shares in companies mentioned in this newsletter. We share our ideas and opinions for informational and educational purposes only and expect the reader to perform due diligence before considering a position in any security. That includes consulting with your own licensed professional financial advisor.