Global silver mine supply this year may turn out to be less than the official estimates. GFMS released their 2014 Interim Report stating world silver mine supply is forecasted to increased 3.5% to 868 million oz (Moz) in 2014. They included a world map in their report showing the net change in production from various countries.
According to GFMS 2014 Silver Interim Report:
On the supply side, mine production is forecast to reach all-time highs in the silver industry in 2014 as supply from Guatemala, Mexico, Chile and Peru increases. This is forecast to see primary supply increase by 3.5% in 2014 to 868 Moz. Total supply to the market is expected to increase more modestly as scrap supply continues to contract, with an estimated 14% decline in scrap leading to total supply of 1,131 Moz, a 2.9% increase year-on-year.
If we look at the map provided by GFMS, they show an increase in annual production in GREEN, a decrease in RED and no change in shown in TAN:
I agree with GFMS on Guatemala, Chile & Peru… but not on Mexico. GFMS forecasts that Mexico will increase silver production 12+ million oz, shown in the light green color. However, Mexico’s INEGI just released their September figures year to date and it shows overall production nearly flat compared to the same period last year.
Guatemala will show the largest increase in silver production due to Tahoe Resources Escobal mine becoming commercial in January of this year. Guatemala’s Escobal mine will produce 20+ million oz a year.
Furthermore, the Chilean Copper Commission also released their most recent World Copper Market Review showing production of copper and various metals.
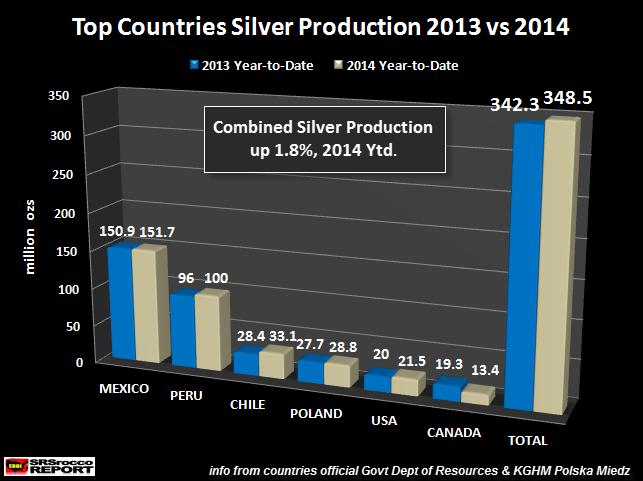
I put together a chart using data from the following sources:
- Mexico’s INEGI
- Chilean Copper Commission
- KGHM Polska Miedz
- Canada’s Dept. of Natural Resources
- USGS – United States Geological Society
- Peru Ministry of Mines & Energy
Mexico’s 2014 silver production (Jan-Sep) was 151.7 Moz compared to 150.9 Moz the same period last year. Peru increased its silver production 4 Moz from 96 Moz (Jan-Oct) 2013 to 100 Moz this year. KGHM Polska Miedz, which accounts for Poland’s silver production (Jan-Sep) was up 1.1 Moz from 27.7 Moz in 2013 compared to 28.8 Moz this year.
Chilean silver production (Jan-Sep) was up 4.7 Moz from 28.4 Moz in 2013 to 33.1 Moz this year. The United States increased silver production (Jan-Jul) 1.5 Moz from 20 Moz in 2013 to 21.5 Moz this year. However, the biggest loser was Canada which saw a large 5.9 Moz decline in silver production (Jan-Oct) compared to the same period last year.
The net annual change in silver production from these six countries is 6.2 Moz, or an increase of 1.8%. I checked Australia’s data from their Dept of Natural Resources, but they only have figures for the first quarter of 2014. That being said, one of the largest primary silver mines, BHP’s Cannington located in Australia, has seen its year-over-year production decline 3.6 Moz in the first nine months of 2014.
In the GFMS global map above, they show silver production remaining flat in China and Russia, with large declines in Australia, North America and Kazakhstan. GFMS shows large increases in Guatemala, Mexico, Peru and Chile.
As I stated before, I know Guatemala will be up significantly due to the Escobal mine bringing online 20 Moz of new production, but I do not believe Mexico or Peru will be as strong as forecasted. If Australia is down 5-8 Moz, while Kazakhstan down considerably compared to last year, global silver production will come in less than GFMS forecasted.
It all depends on how China and Russia finish for the year. If they are flat or slightly lower, than total world silver production may be 10-15 Moz less than GFMS 2014 forecast of 868 Moz.
Please check for new articles and updates at the SRSrocco Report. You can also follow us at Twitter below:


