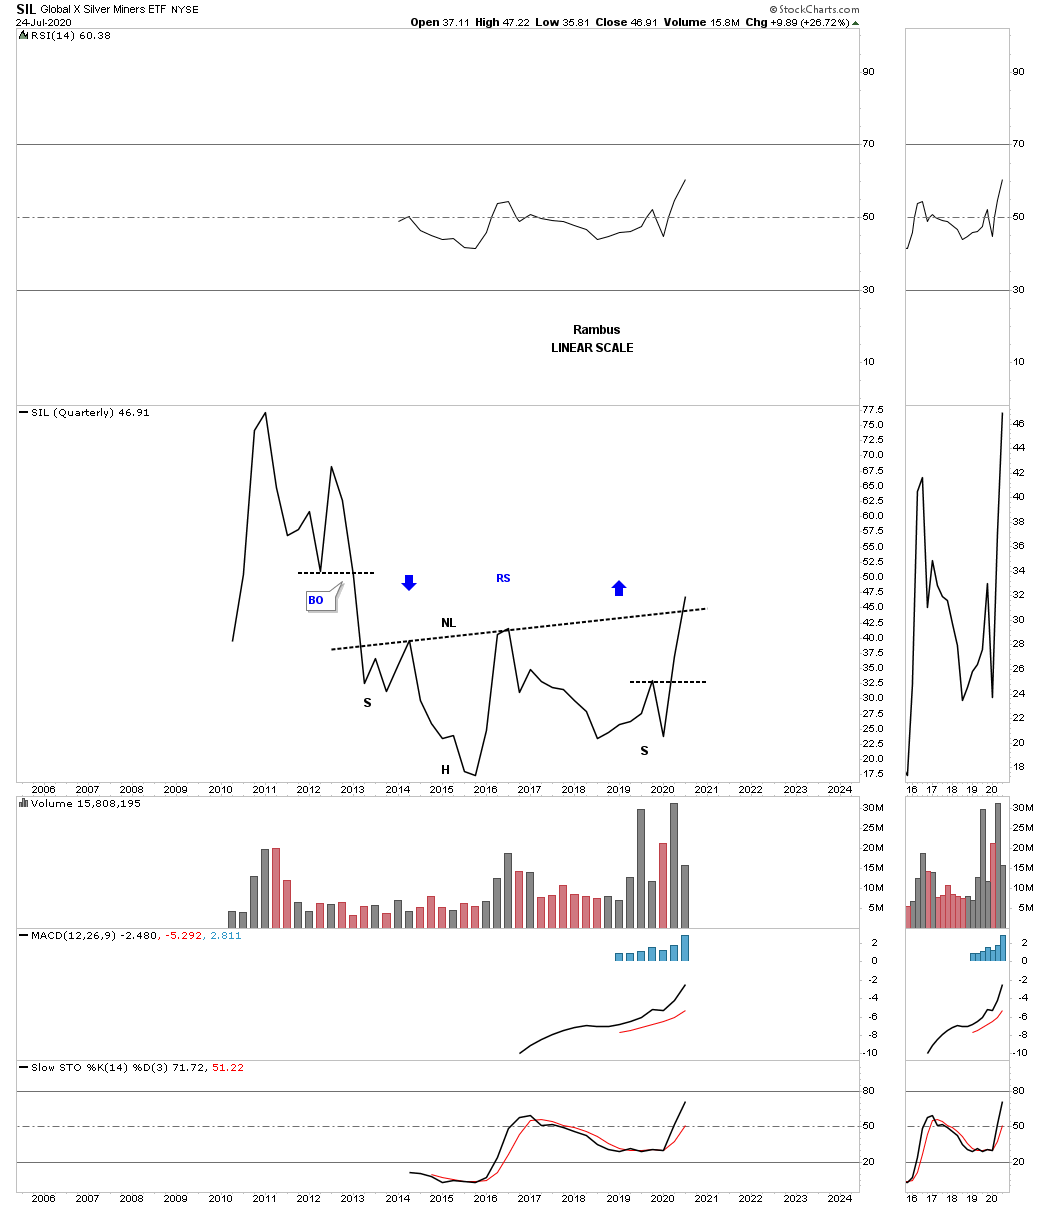
SIL is finally breaking out above its H&S neckline.
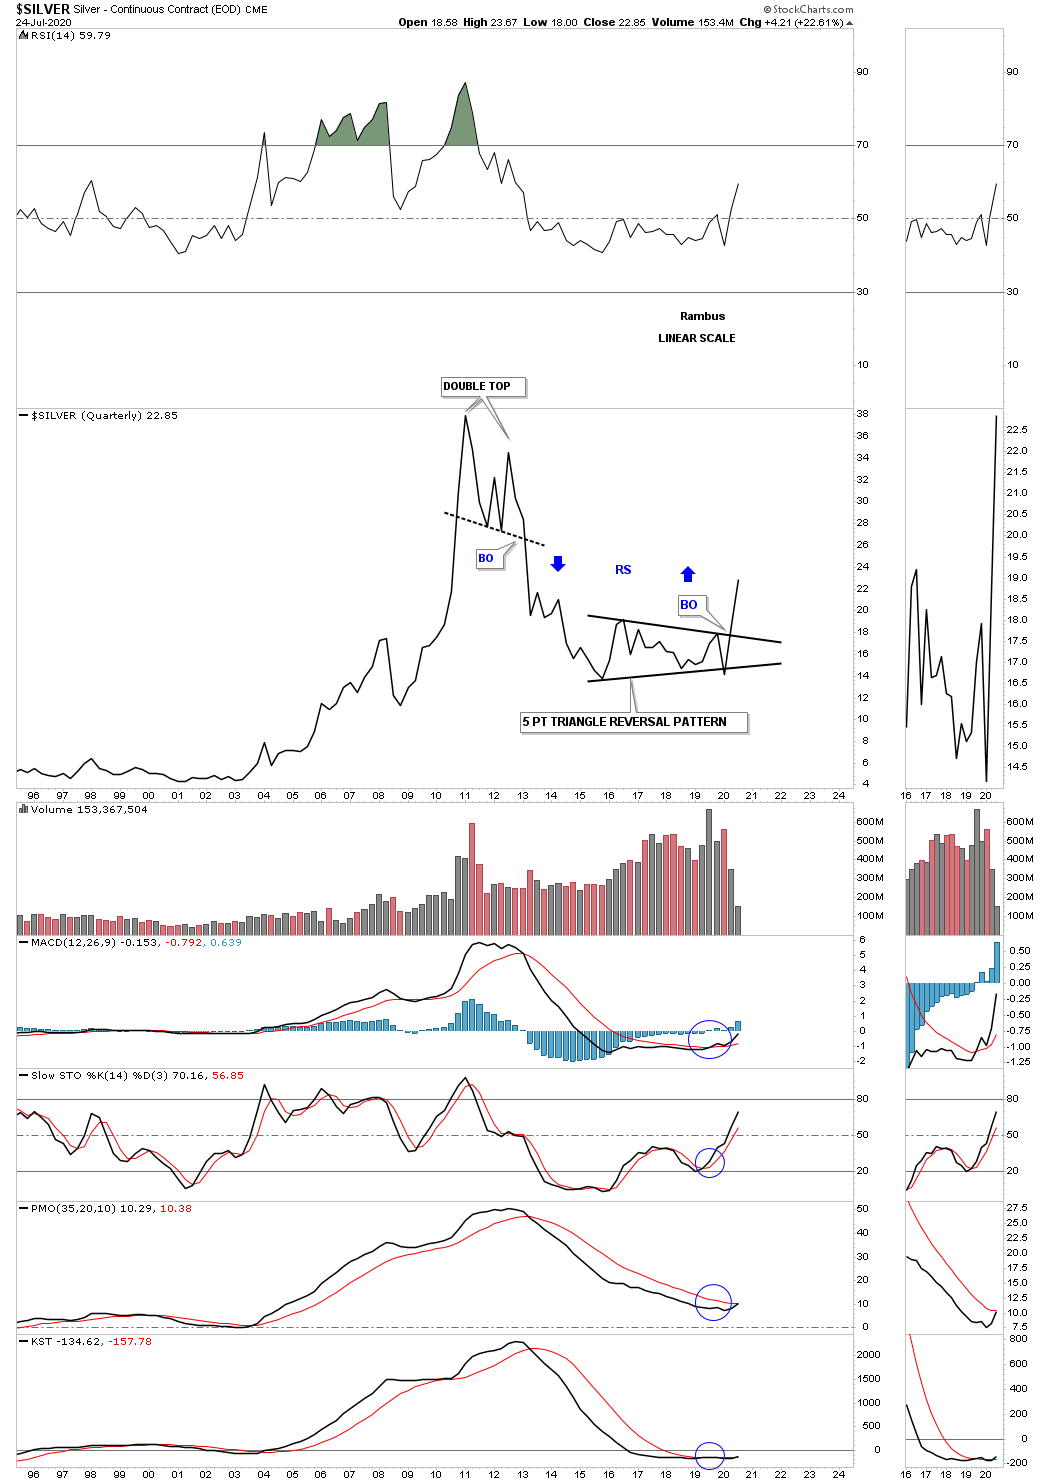
Silver has just competed its 2016 five point triangle reversal pattern.
If there was only one chart I could use to make a case for the PM complex bull market it would have to be this quarterly line chart for gold. First note the beautiful and symmetrical H&S consolidation pattern we followed in real time and the reverse symmetry over the same area on the way down as shown by the blue arrows. On a quarterly time basis you can see gold is trading at new all time highs. The last thing to observe is the 2000 to 2011 bull market which made higher highs and higher lows on a quarterly basis.
FULL REPORT: http://news.goldseek.com/GoldSeek/1595847505.php
All the best…Rambus
About the author