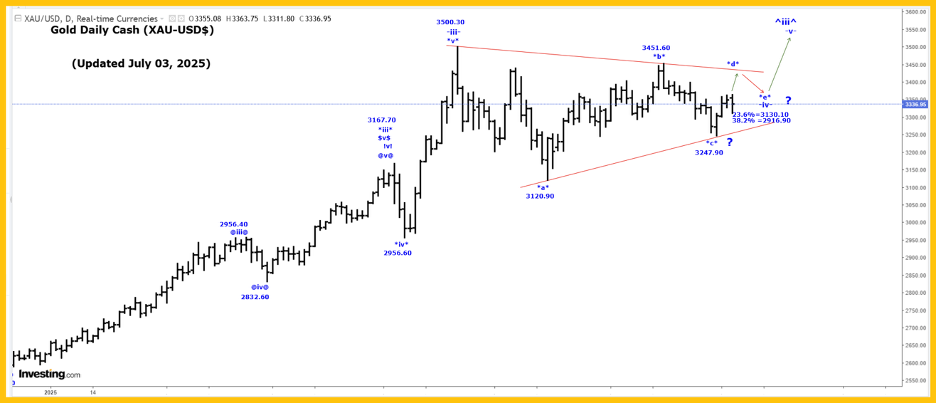
 The Captain’s daily gold chart.
Analysis:
We are moving higher in a multi-year wave (3) of 3, that has a current projected endpoint of:
(3) = 1.618(1) = 4298.80.
Within wave (3) we are moving higher in wave -iii- which has a current projected endpoint of:
-iii- = 6.250-i- = 3249.40.
Within wave -iii-, we are moving higher in wave *iii* which has an updated projected endpoint of:
*iii* = 6.25*i* = 4660.20.
We are working on the assumption that wave *iii* is still underway, as shown on the Weekly Gold Chart, with wave $iii$ is ending at the 3500.30 high and if that is the case then we are now falling in wave $iv$, which we are now assuming is becoming a bullish triangle formation as follows:
!a! = 3120.90.
!b! = 3451.60.
!c! = 3247.50.
!d! rally is now underway, but cannot rally above the 3451.60 high.
!e! = drop after wave !d! ends but cannot fall below the wave !c! low.
After wave $iv$ ends we expect a very sharp thrust higher to new all-time highs in wave $v$ to complete wave *iii*.
Trading Recommendation: Go long gold. Use puts as stops.
Active Positions: Long gold futures with size from $1080, with puts as our stops!
US Rates:
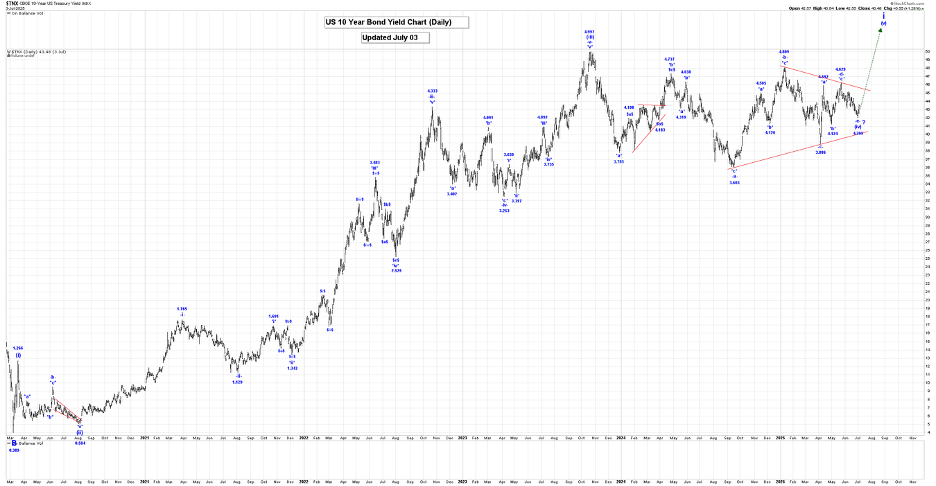
The Captain’s 10yr US rates daily chart.
Analysis:
We have made a major change to our US 10-year Bond Yield count. We now believe that wave i is still underway, as shown on our Daily Chart.
Within wave i, we completed wave (i) at 1.266%, wave (ii) at 0.504, wave (iii) at 4.997% and we are currently working on a large wave (iv) bullish triangle formation, which appears to still be underway.
After our wave (iv) bullish triangle formation ends, we expect a sharp thrust higher in wave (v), which has a minimum target of the wave (iii) high of 4.997%.
We will provide projections for the end of wave (v), once we confirm that our wave (iv) bullish triangle is complete, perhaps at the 4.185% low, but a spike high to 6.00% would not be a surprise based on the size of the wave (iv) bullish triangle.
Trading Recommendation: Go long, risking to 3.880%.
Active Positions: Long risking to 3.880%!
Silver:
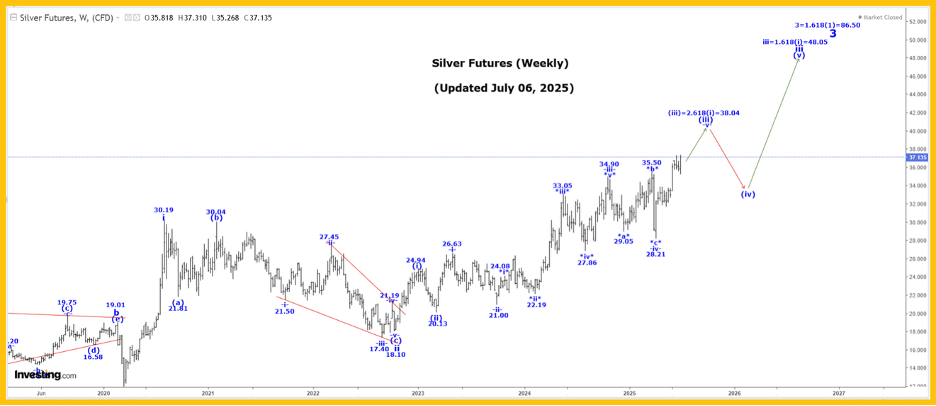
The Captain’s weekly silver chart.
Analysis:
We are moving higher in wave 3, as shown on our Weekly Silver Chart.
Within wave 3, we completed wave i at 29.91 and wave ii at 18.01 and we are now continuing to move higher in a subdividing wave iii.
Within wave iii, we completed wave (i) at 24.39, wave (ii) at 19.94 and we are now moving higher in wave (iii) which has the following projected endpoints:
(iii) = 2.168(i) = 38.04!
Within wave (iii), we completed wave -i- at 26.43, wave -ii- at 20.85, wave -iii- ended at 34.90 and wave -iv- at 27.60. We are now moving higher in wave -v- and within wave -v-, wave !i! ended at 33.69 and wave !ii! at 31.78.
We still expect higher prices, in the short term.
Longer term our initial projection for the end of wave 3 is:
3 = 1.618(1) = 86.50
In the very long term, we completed all of wave III at 49.00 in 1980 and all of wave IV at 3.55 in 1993. We are now working on wave V and within wave V we have the following count;
1 = 49.82;
2 = 11.64;
3 = First projection is 86.50.
Trading Recommendation: Long with puts as stops.
Active Positions: Long with puts as stops!
Thank-you,
Captain Ewave & Crew
About the author