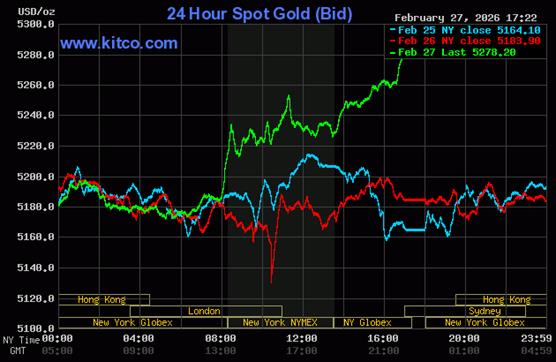
The gold price was forced to wander/chop quietly sideways in Globex trading overseas until around 12:50 p.m. in London on their Friday afternoon. Its ensuing and impressive rally ran into 'da boyz' on multiple occasions in COMEX and after-hours trading in New York, but came very close to closing on its high tick of the day.
The low and high ticks in gold were recorded by the CME Group as $5,182.90 and $5,299.00 in the April contract...an intraday move of $116.10 an ounce. The April/ June price spread differential in gold at the close in New York yesterday was $39.70...June/August was $39.50...August/October was $34.50 -- and October/ December was $34.60 an ounce.
Gold finished the Friday session in New York at $5,278.20 spot...up $94.30 on the day -- and only $1.70 off its Kitco-recorded high tick. Net volume was on the lighter side at 135,000 contracts -- and there were around 16,800 contracts worth of roll-over/switch volume on top of that.
I saw that 354 gold, plus 1,134 silver contracts were traded in March yesterday and, as is always the case, it remains to be seen just how much of these amounts show up in tonight's Daily Delivery and Preliminary Reports further down in today's column. However, I suspect that most of this was roll-over/switch volume that was reported late.
![]()
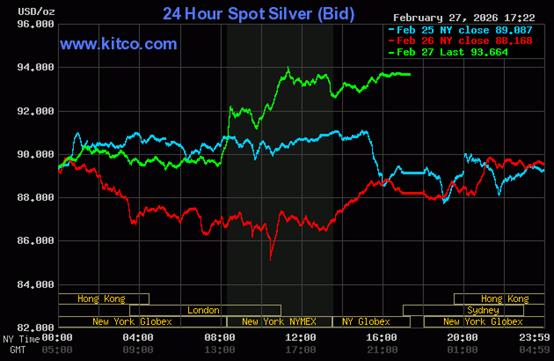
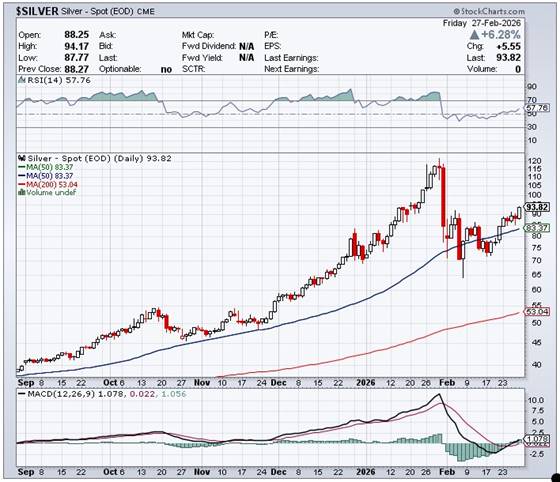
Silver rallied two broad steps higher until the 2:15 p.m. afternoon gold fix in Shanghai on their Friday afternoon -- and was then sold/engineered quietly lower until 1 p.m. GMT in London/8 a.m. EST in New York. Its two big steps higher rally from that point ran into 'something' the moment it broke above $94 spot -- and from that juncture had a broad down/up move that lasted until around 3:50 p.m. in after-hours trading. It didn't do anything after that.
The low and high ticks in silver were reported as $88.305 and $97.76 in the May contract...an intraday move of $6.455 an ounce. The March/May price spread differential in silver at the close in New York yesterday was 60.9 cents...May/July was 67.8 cents...July/September was 60.9 cents -- and September/December was 76.5 cents an ounce.
Silver was closed on Friday afternoon at $93.66 spot...up $5.49 on the day -- and 36 cents off its Kitco-recorded high tick. Net volume was also on the lighter side at a bit under 45,000 contracts -- and there were a bit under 11,000 contracts worth of roll-over/switch volume in this precious metal.
![]()
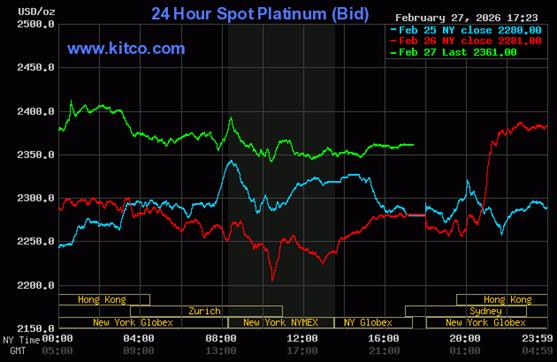
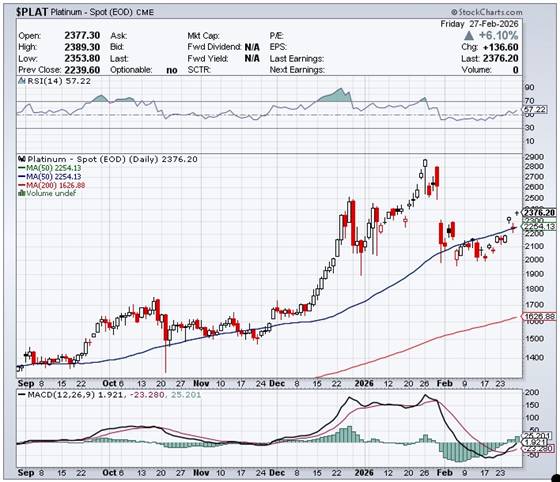
Platinum's two big steps higher rally in early Globex trading in the Far East was capped around 1:50 p.m. China Standard Time on their Friday afternoon -- and it was then sold/engineered unevenly lower until around 10:25 a.m. in COMEX trading in New York. It then proceeded to wander a tad higher from that point until the market closed at 5:00 p.m. EST. Platinum was closed at $2,361 spot...up $80 on the day -- and 52 bucks off its Kitco-recorded high tick.
![]()
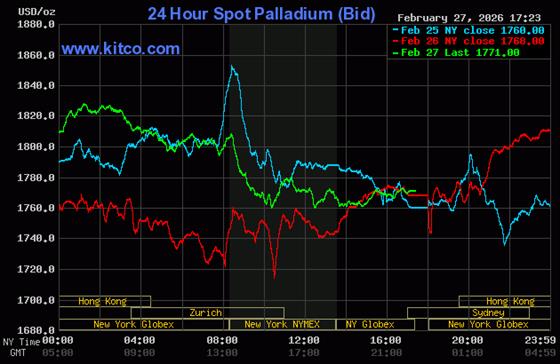
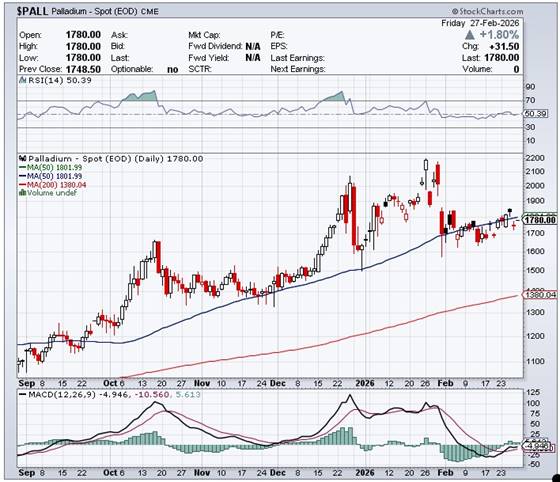
In most respects that mattered, palladium's price was managed in a very similar fashion as platinum's...except once its high tick was set at the afternoon gold fix in Shanghai, its engineered sell-off after that was far more pronounced -- and it was only allowed to close higher by 3 dollars, at $1,771 spot...59 bucks off its Kitco-recorded high tick.
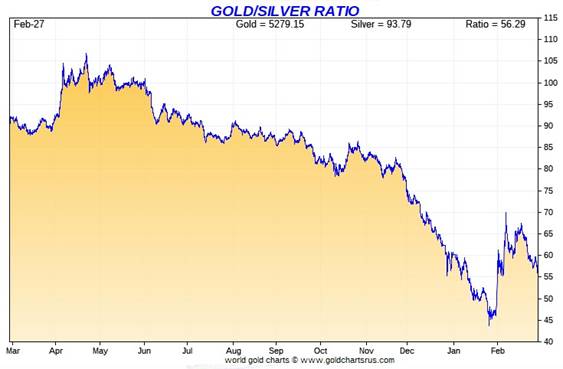
Based on the kitco.com spot closing prices in silver and gold posted above... the gold/silver ratio worked out to 56.4 to 1 on Friday...compared to 58.8 to 1 on Thursday.
Here's the 1-year Gold/Silver Ratio chart from Nick Laird -- and updated with this past week's data. Click to enlarge.
![]()
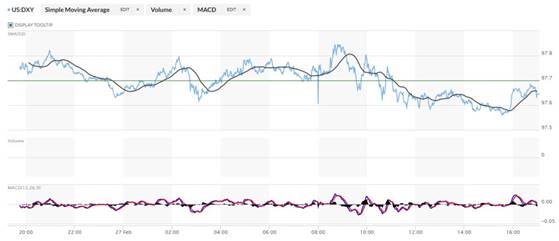
The dollar index closed very late on Thursday afternoon in New York at 97.79 -- and then opened lower by 3 basis points once trading commenced at 7:45 p.m. EST on Thursday evening...which was 8:45 a.m. China Standard Time on their Friday morning. It then proceeded to chop/wander broadly and unevenly sideways until its high tick of the day was set...such as it was...around 8:42 a.m. in New York. It then chopped quietly lower until around 3:33 p.m. -- and chopped very quietly and unevenly higher until trading ended at 5:00 p.m. EST.
The dollar index finished the Friday trading session in New York at 97.65...down 14 basis points from its close on Thursday.
Here's the DXY chart for Friday...thanks to marketwatch.com as usual. Click to enlarge.
![]()
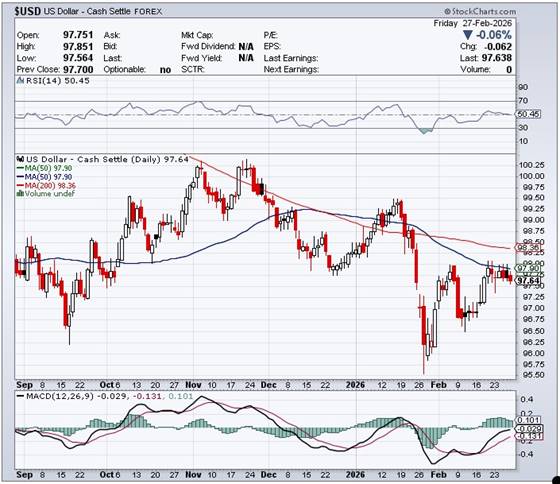
Here's the 6-month U.S. dollar index chart...courtesy of stockcharts.com as always. The delta between its close...97.64...and the close on DXY chart above, was 1 basis point below that. Click to enlarge.
![]()
Once again, the dollar index played no part in the pricing of the precious metals on Friday.
U.S. 10-year Treasury: 3.9620%...down 0.0550/(-1.37%)...as of the 1:59:53 p.m. CST close
The Fed stepped into the Treasury market the moment that the dollar index peaked around 8:42 a.m. EST -- and the ten-year yield was guided quietly lower from that juncture until shortly before the markets closed.
For the week, the ten-year yield closed down a whopping 12.40 basis points -- all thanks to the Fed.
Here's the 5-year 10-year U.S. Treasury chart from the yahoo.com Internet site -- which puts the current yield into a somewhat longer-term perspective. Click to enlarge.
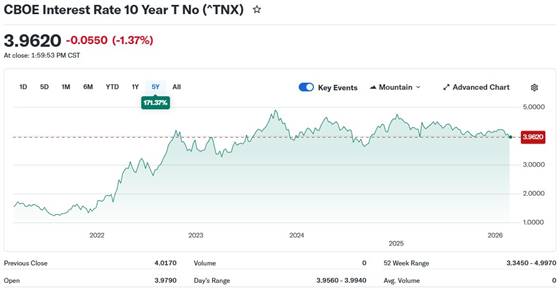
As I keep pointing out in this spot every Saturday, the 10-year hasn't been allowed to trade above its 4.92% high set back on October 15, 2023...but I still suspect that we've seen the 3.9482% low for this cycle...which was set back on October 22, 2025. However, the Fed now has its yield back to within 1.5 basis points of that mark, which I didn't think possible...so yield curve control is in full effect. But they still have about $10 trillion worth of short-term treasuries to roll over this year...so good luck to them going forward. The word on the street is that there won't be a rate cut at the next FOMC meeting, either. We'll see.
![]()
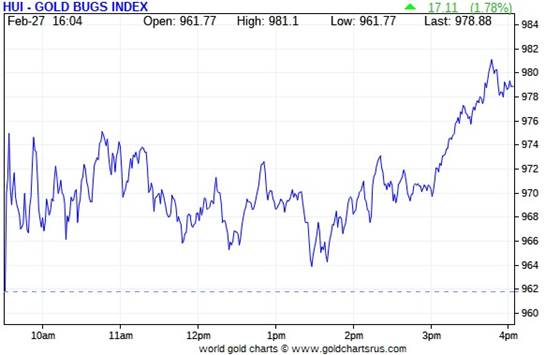
Despite gold's boomer rally in the early going in New York on Friday morning, the gold stock only rose by bit -- and then chopped wildly sideways to a bit lower until minutes before the 1:30 p.m. COMEX close, when gold began its final rally of the day. The gold shares were allowed to join the party at that time -- and the HUI managed to close higher by 1.78 percent.
![]()
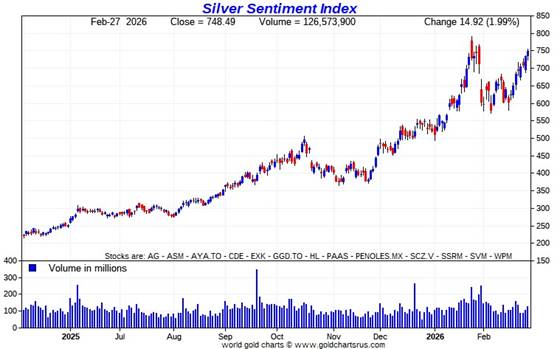
The silver equities were kept in check in the early going as well -- and actually traded in the red a couple of times before they too were set free a few minutes before the COMEX close -- and they rallied sharply from that point until the markets closed at 4:00 p.m. EST. Nick Laird's Silver Sentiment Index closed up only 1.99 percent. Click to enlarge.
![]()
The star yesterday was Aya Gold & Silver, closing higher by 5.84 percent... with Peñoles not that far behind, higher by 4.96 percent. The biggest underperformer was Endeavour Silver, as it closed down on the day by 0.93 percent...maybe on this news. GoGold Resources was the other big underperformer, closing unchanged on the day.
There was this news from Silvercorp Metals on Thursday.
Silver closed higher by 6.23% on Friday...the Silver Sentiment Index closed higher by only 1.99% -- and PSLV closed up 6.01%
Gold closed higher by 1.82%...the HUI closed up by 1.78% -- and PHYS closed up by only 1.21%
Yesterday was yet another poster child for precious metal share price intervention...as almost all the silver stocks would have closed higher by double-digit amounts if allowed to trade freely in the early going.
The Shanghai/U.S. price premium in silver was 12.95 percent yesterday.
The reddit.com/Wallstreetsilver website, now under 'new' and somewhat improved management, is linked here. The link to two other silver forums are here -- and here.
![]()
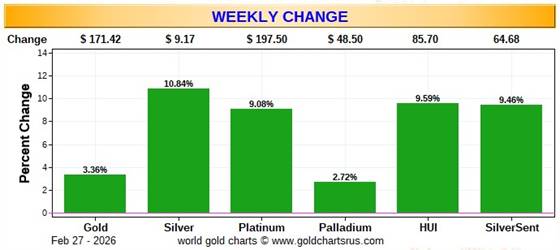
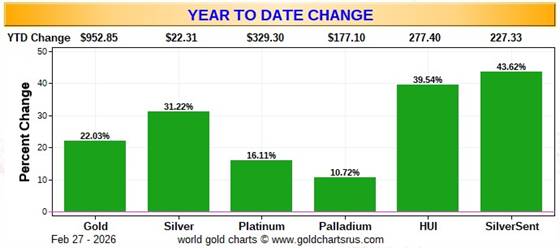
Here are the usual three charts that appear in this spot in every weekend missive. They show the changes in gold, silver, platinum and palladium in both percent and dollar and cents terms, as of their Friday closes in New York — along with the changes in the HUI and the Silver Sentiment Index.
Here's the weekly chart -- and it's a sight to behold. Even though silver's weekly gains blew the doors off gold, the gold shares outperformed the silver stocks both on both a relative and absolute basis, which is no surprise considering the price management that's going on in the latter. Click to enlarge.
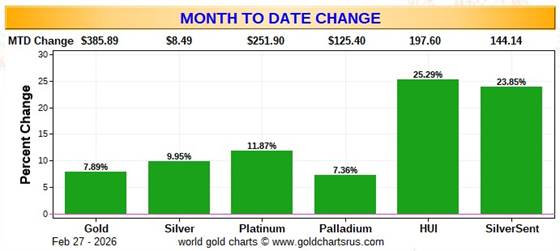
Here's the month-to-date chart...which is for the entire month of February -- and the same can be said about it, as what I spoke of in the previous paragraph about everything silver and gold-related. Click to enlarge.
Here's the year-to-date chart -- and it looks far more respectable than it did a week ago. The underperformance of the equities remains the standout feature, especially the silver shares once again...like it has done for the last six or so months since 'da boyz' began managing the precious metal stocks in earnest starting in mid September of last year. But it's better now than it was a month ago. Click to enlarge.
Despite the fact that silver has now broken the $120 barrier...albeit briefly -- and the silver well in London is close to running on empty...the gold/silver ratio remains at a farcical 56.4 to 1 as of the Friday's close. The 'normal' and historical ratio is around 15 to 1...which would put silver at around $352. And if priced at the ratio of 7:1 that it comes out of the ground at, compared to gold...that would put silver at a bit over $754 an ounce. So a rather impressive triple-digit silver price is in our future...most likely somewhere between those two numbers. As I say in this spot every Saturday...all that remains to be resolved is what that price will be -- and how soon 'da boyz' allow it to happen. Its first attempt to reach one of these values was obviously crushed. But they can't keep it up forever.
![]()
The CME Daily Delivery Report for Day 2 of March deliveries showed that 130 gold -- and 306 silver contract were posted for delivery within the COMEX-approved depositories on Tuesday.
In gold, the three largest short/issuers of the four in total were JPMorgan, Australia's Macquarie Futures and Advantage...issuing 78, 25 and 23 contracts respectively...Macquarie from their house account. The four biggest long/ stoppers were BofA Securities, British bank HSBC, Canada's Scotia Capital/ Scotiabank- and JPMorgan...picking up 42, 33, 24 and 20 contracts respectively...JPMorgan for their client account.
In silver, the two biggest short/issuers were British bank HSBC and Macquarie Futures, issuing 120 and 151 contracts respectively...HSBC from their client account. Macquarie issued 113 contracts from their house account -- and the other 38 from their client account. The three biggest long/stoppers were Citigroup, BofA Securities and RBC Capital Markets, picking up 75, 61 and 65 contracts respectively...all for their house accounts, except for 6 contracts for RBC's client account.
In platinum, there were 15 and 145 contracts issued and stopped respectively.
In copper, it was another huge 1,140 COMEX contracts/28.5 million pounds.
The link to yesterday's Issuers and Stoppers Report is here -- and it's worth a look if you have the interest.
Looking back at the February delivery month one last time, there were 40,711 gold contracts issued/reissued and stopped that month -- and in silver, that number was 5,036 COMEX contracts.
On First Notice Day for February deliveries back on January 29, there were 30,671 gold contract open for delivery this month -- and that number in silver was 2,701 contracts...so lots of contracts were added to both as the delivery month progressed...32.7% more gold -- and 86.4% more in silver. I have some charts on this in The Wrap.
The CME Preliminary Report for the Friday trading session showed that gold open interest in March fell by 2,107 contracts, leaving just 497 left...minus the 130 contracts out for delivery on Tuesday as per the above Daily Delivery Report. Thursday's Daily Delivery Report showed that 2,277 gold contracts were actually posted for delivery on Monday, so that means that 2,277-2,107=170 more gold contracts were added to March deliveries.
Silver o.i. in March dropped by 4,638 contracts, leaving 1,585 still around ...minus the 306 contracts out for delivery on Monday as mentioned a bunch of paragraphs ago. Thursday's Daily Delivery Report showed that 4,540 silver contracts were actually posted for delivery on Monday, so that means that 4,638-4,540=98 silver contracts vanished from the March delivery month.
Total gold open interest in the Preliminary Report on Friday night rose by 9,153 COMEX contracts -- but total silver o.i. contracts actually fell by 2,266 contracts...which was most likely delivery related.
[I checked the final total open interest number for gold for Thursday -- and it showed a very decent decline, thankfully...from +6,025 COMEX contracts, down to -1,038 contracts. Final total silver o.i. for Thursday increased by a hair...from -2,223 contracts, up to -2,209 contracts.]
Gold open interest inApril in the CME's Final Report on Friday morning fell by 244 COMEX contracts, leaving 275,174 COMEX contracts still around. Silver o.i. in April fell by 146 contracts, leaving 1,013 contracts still open.
![]()
There was another deposit into GLD on Friday. This one was 110,277 troy ounces...plus there were 11,875 troy ounces of gold added to GLDM as well. Since February 17, there have been 827,107 troy ounces of gold added to GLD -- and that doesn't include any of the gold added to GLDM. In SLV, there were a hefty 3,351,734 troy ounces of silver withdrawn.
The SLV borrow rate started the Friday trading session at 0.36 percent -- and finished at 0.37 percent, with 10.0 million shares available. The GLD borrow rate began the day at 0.25% -- and finished it at 0.41%...with 6.7 million shares available.
In other gold and silver ETFs and mutual funds on Earth on Friday ...net of any changes in COMEX, GLD, GLDM and SLV activity, there were a net 81,497 troy ounces of gold added...but a net 1,586,855 troy ounces of silver were taken out...mostly because of the 1,014,917 troy ounces that left iShares/SSLN.
There will be nothing from the U.S. Mint until early next week.
![]()
![]()
There was decent activity in gold over at the COMEX-approved depositories on the U.S. east coast on Thursday. Nothing was reported received -- and 166,554 troy ounces were shipped out involving three different depositories...with the largest amount being the 97,442 troy ounces that departed JPMorgan.
There was a bit of paper activity, as 2,672 troy ounces were transferred from the Eligible category and into Registered involving two different depositories -- and I shan't bother itemizing these small amounts.
The link to Thursday's COMEX gold action is here.
There was no let-up in the silver action, as 1,157,900 troy ounces were received -- and 1,464,332 troy ounces were shipped out.
The two largest 'in' amounts were the 824,168 and 307,500 troy ounces dropped off at Asahi and StoneX respectively.
There were seven depositories that parted with silver. The largest amount were the 824,168 troy ounces that left Asahi...followed by the 647,661 troy ounces that departed JPMorgan. The next biggest amount were the 485,175 troy ounces that were shipped out of CNT.
There was pretty hefty paper activity, as 1,161,661 troy ounces were transferred from the Eligible category and into Registered -- and no doubt getting teed up for delivery in March. The largest amount by far were the 964,465 troy ounces that made that trip over at Loomis International.
The link to all of Thursday's COMEX silver action is here.
The Shanghai Futures Exchange updated their silver inventories as of the close of business on their Friday -- and it showed that a net and further 1,278,741 troy ounces/ 39,773 metric tonnes of silver were withdrawn... leaving their silver inventories at only 9.857 million troy ounces/306.596 metric tonnes. I have more to say about this in The Wrap.
![]()
Here are the usual 20-year charts that show up in this space in every weekend column. They show the total amounts of physical gold and silver held in all known depositories, ETFs and mutual funds as of the close of business on Friday. Click to enlarge.
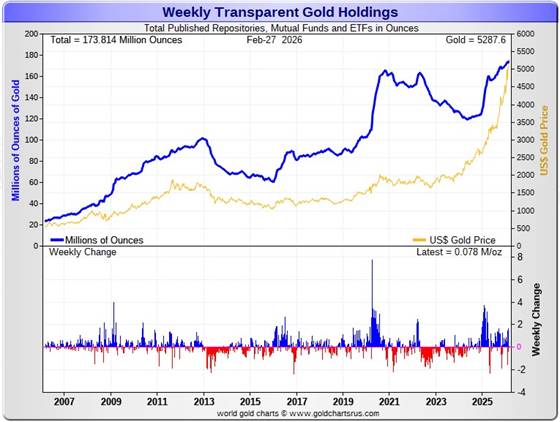
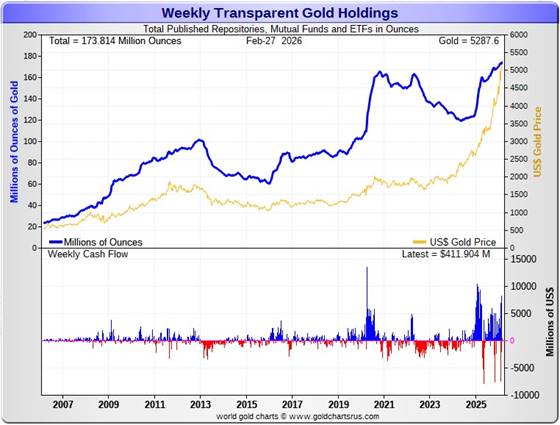
During the business week just past, there were only a net 78,000 troy ounces of gold added.And for first time in seven weeks, there was a net addition in silver, as a net 5.468 million troy ounces were deposited.
According to Nick Laird's data on his website, a net 178,000 troy ounces of gold were removed from all the world's known depositories, mutual funds and ETFs during the last four weeks. The largest 'in' amount were the 1.302 million troy ounces that went into China's ETFs. The next two after it were the 968,700 troy ounces into India's gold ETFs...followed by the 706,000 troy ounces into GLD. The two biggest 'out' amounts were the 2.427 million troy ounces that departed the COMEX -- and the 401,100 troy ounces that left UBS.
The amount of gold in all the world's ETFs and mutual funds remains barely above its old all-time high of late 2020...see the above chart. But it should be far higher, more than double its current amount, considering gold's current price...far more than double it was back then. Why it isn't, is beyond me.
A net 33.951 million troy ounces of silver were taken out during that same 4-week time period. The largest 'out' amount were the 45.554 million oz. out of the COMEX...followed by the 5.274 million oz. out of iShares/SSLN -- and the 4.830 million oz. out of ZKB. The 'out' list goes on and on...
The biggest 'in' amount over that four-week period were the 15.080 million oz. into SLV...followed by the 13.532 million troy ounces that went into India's ETFs. The other five net 'in' amounts aren't worth mentioning.
It's been a wild past five weeks in the physical silver space -- and the only explanations for these massive withdrawals over that time period was a conversion of paper silver shares for physical metal and/or the silver was more desperately needed elsewhere.
It should be noted that the amount of silver held in all these depositories, ETFs and mutual funds is a noticeable amount above its old all-time high inventory level of January 2021. But it should be far higher than it is as well, because silver is 3.45x the price it was back then.
Back at its previous inventory peak in late January 2021, silver was around $27 an ounce. Now its about 66 bucks higher. Why the precious metal ETFs aren't doing better is a mystery for which I have no answer, except for what I mentioned two paragraphs ago.
Retail demand has quieted down quite a bit, although I don't expect that to last long. But it's obvious that a lot of the more popular silver products remain out of stock at almost all on-line retail bullion stores...with deliveries stretched out by quite a bit now. I've been told that the mints, both sovereign and private, are still going flat out. The delivery time on silver maple leafs from the Royal Canadian Mint is 4-6 weeks at the moment -- and the buy/sell spreads at the coin shops are still 10% or more.
As you can see from the numbers a few paragraphs ago, physical demand in silver at the wholesale level remains off-the-charts enormous/ rapacious. COMEX silver withdrawals have been monstrous since the start of the year...51 million oz. shipped out in January...plus the almost 48 million so far in February. These amount don't include the 25.2 million oz. issued and stopped in the February delivery month.
The "rapacious" silver demand will continue until available supplies are depleted -- and we're also at the start of the sixth year of a structural deficit in silver according to the ongoing reports from The Silver Institute.
The vast majority of precious metals being held in these depositories are by those who won't be selling until the silver price is many multiples of what it is today...if ever.
Sprott's PSLV is the third largest depository of silver on Planet Earth with 216.9 million troy ounces...unchanged for the last three weeks -- and a great distance behind the COMEX, which has now been demoted to the second largest silver depository, where there are 360.3 million troy ounces being held...down a further 6.0 million troy ounces this past week...but minus the 103 million troy ounces being held in trust for SLV by JPMorgan.
That 103 million ounce amount brings JPMorgan's actual silver warehouse stocks down to around the 51 million troy ounce mark...quite a bit different than the 153.8 million they indicate they have...down a further 2.1 million troy ounces on the week. They've parted with a lot of silver in the last six or so months...around 57 million oz.
And that number doesn't include the silver that JPMorgan owns and has stored at the other COMEX-approved depositories. They've shipped out lots of that over the months and years...especially so far this year.
PSLV remains a very long way behind SLV as well -- still the largest silver depository...with 514.2 million troy ounces as of Friday's close...up a net 15.3 million troy ounces from last week.
On a net basis over the last eight weeks, every depository or ETF has been hemorrhaging silver...except for India's ETFs -- and five very small players in this space.
The latest short report [for positions held at the close of business on Friday, February 13] showed that the short position in SLV fell by 37.74%...from the 73.55 million shares sold short in the prior report...down to 45.79 million shares in the latest short report that came out this past Wednesday. This amount represents 8.02 percent of total SLV shares outstanding, which remains grotesque, obscene and fraudulent beyond all description...as there is no physical silver backing any of it as the SLV prospectus requires.
BlackRock issued a warning more than five years ago now to all those short SLV, that there might come a time when there wouldn't be enough metal for them to cover. That would only be true if JPMorgan decides not to supply it to whatever entity requires it. Those that remain short SLV shares are in equally dire straits as those short silver in the COMEX futures market -- and I suspect that they're the same entities.
They were obviously able to cover boatloads of those short positions in these latest engineered price declines...as that's the other reason why 'da boyz' went after silver as aggressively as they did.
The next short report...for positions held at the close of trading on Friday, February 27 will be posted on The Wall Street Journal's website on Tuesday afternoon, March 10.
Then there's that other little matter of the monster short position in silver and gold held by Bank of America in the OTC market...with JPMorgan & Friends on the long side. Ted said it hadn't gone away. He wrote an article about this back in April 2021 headlined "A New Piece of the Puzzle" -- and linked here.
In the article, the OCC Report stated that BofA had $8.3 billion in precious metal derivatives at the end of Q4/2020 -- and as you'll see in the paragraphs that follow, the BofA's derivatives position is now up to $47.9 billion as of the end of Q3/2025...an almost six-fold increase -- and all because of the increases in the price.
A while after that article came out, he also come to the conclusion that they're short around 25 million ounces of gold with these same parties as well. Once these short covering rallies in both silver and gold really explode higher...we'll see if they need to get taken over, like Bear Stearns did back in 2008 -- and for the same reason.
The latest OCC Report for Q3/2025 was posted on their website about two months ago now -- and it showed that the precious metal derivatives held by the four largest U.S. banks increased by $137.54 billion/24.4% from Q2/2025...up to $704.05 billion...which is a very hefty amount.
JPMorgan's precious metals derivatives rose from $358.5 billion, up to $437.4 billion from Q2/2025 -- and Citigroup's also rose...from $150.7 billion, up to $204.3 billion. BofA's increased by a tiny bit...from $44.7 billion, up to $47.9 billion -- and the derivatives position held by Goldman Sachs is a piddling and immaterial $614 million -- up from the equally piddling $219 million it held in Q2/2025.
But with JPMorgan holding 62.1% of all the precious metals derivatives... Citibank holding 29.0% -- and Bank of America about 7% of the total of the four reporting banks, it's only JPMorgan and Citigroup that matter.
But the caveat to the above would be the precious metals derivatives position held by Wells Fargo and Morgan Stanley. The reason that their data is not included, is because they are not one of the USA's four largest banks by total derivatives held. But you can bet your entire net worth that they hold also hold a derivatives position in the precious metals that would choke a horse...Wells Fargo in particular.
This would indicate that these six U.S. banks held a derivatives position in the precious metals something north of $1 Trillion dollars at the end of Q3/2025.
But as I keep pointing out in this spot every weekend -- and mentioned just above...the OCC indicator is flawed for two very important reasons, as way back 10-15 years ago, this report used to include the top dozen or so U.S. banks -- and included the likes of Wells Fargo and Morgan Stanley, amongst others...that hold derivatives positions, both long and short, in the precious metals. Now the list is down to just four banks...so a lot of data is hidden...which is certainly the reason why the list was shortened. On top of that, the list doesn't include the non-U.S. banks that are short and long the precious metals: British, French, German, Canadian -- and Australian.
Including all theirs, the derivatives/paper held in the precious metals...mostly on the short side...is an eye-watering multi-trillion dollar number...which can never be covered, either in the paper market, or through the delivery of physical metal...without driving the prices of all four precious metals beyond the moon in the process.
The next OCC Report for Q4/2025 isn't due out until sometime around the end of March.
![]()
The Commitment of Traders Report, for positions held at the close of trading on Tuesday, February 24 showed a decrease in the Commercial net short position silver...but a smallish increase in gold.
In silver, the Commercial net short position declined by 1,267 COMEX contracts...6.335 million troy ounces of the stuff.
They arrived at that number through the sale of 1,254 long contracts...but also bought back/covered 2,521 short contracts -- and it's the difference between those two numbers that represents their change for the reporting week.
Under the hood in the Disaggregated COT Report both the Managed Money and Nonreportable/small traders were buyers during the reporting week...with the former increasing their net long position by 2,555 COMEX contracts -- and the latter by 476 contracts. It was the traders in the Other Reportables categories that were the big sellers...reducing their net long position by 4,298 COMEX contracts.
Doing the math: 4,298 minus 2,555 minus 476 equals 1,267 COMEX contracts...the change in the Commercial net short position.
The Commercial net short position in silver now sits at 41,080 COMEX contracts/205.400 million troy ounces...down those 1,267 contracts from last Friday's COT Report.
But the Big 4 collusive commercial traders reduced their net short position by a further and hefty 2,127 COMEX contracts, down to 33,245 COMEX contracts ...their lowest short position since March 7, 2023 -- and very close to their lowest short position on record.
The Big '5 through 8' increased their net short position...them by 656 COMEX contracts...up to 13,674 COMEX contracts -- and very close to their lowest short position that I have records for.
The Big 8 commercial traders in total are net short 46,919 COMEX silver contracts...down 1,471 contracts on the week...their smallest short position that I have records for.
Ted raptors, the 37 small commercial traders other than the Big 8, were sellers during the reporting week...reducing their net long position by 204 contracts -- but remain net long silver by 5,839 COMEX contracts.
Here's the 9-year COT chart for silver thanks to Nick Laird -- and updated with the above data. Click to enlarge.
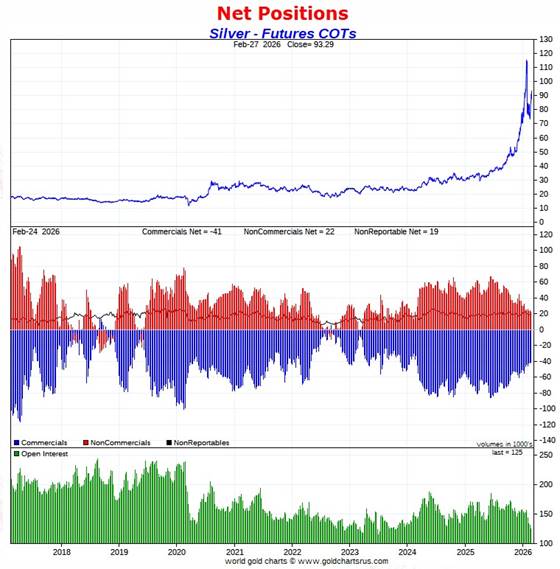
Despite the fact that silver rose around $15 during the holiday-shortened reporting week, I was amazed but happy to see that the Big 4 shorts...two of which are U.S. banks...manage to reduce their short position. In fact, it may have been their short covering that drove silver's price higher during the reporting week.
The Big 8 are net short 37.4 percent of total open interest in silver in the COMEX futures market...up a bit from the 36.8 percent they were short in last week's report -- and mainly because of the 6,042 contract decrease in total open interest, which obviously affects the percentage calculation.
I have no record or memory of the Big 8 holding such a tiny short position when Ted's raptors were only net long this small amount. In the 'old days' many years back, it was common to see them net long silver by 20-40,000 contracts at this point in the price cycle.
Like it was with last week's COT report...from a COMEX futures market perspective, the set-up for silver remains incandescently white-hot bullish.
![]()
In gold, the commercial net short position rose by a rather inconsequential 4,024 COMEX contracts...402,400 troy ounce of the stuff.
They arrived at that number through the sale of 2,039 long contracts -- and also sold 1,985 short contracts. It's the sum of those two numbers that represents their change for the reporting week.
The Managed Money traders certainly didn't do much...increasing their net long position by a piddling 81 contracts. But it was the traders in the Nonreportable/small traders that were the big movers & shakers during the reporting week...increasing their net long position by 4,762 COMEX contracts. They accomplished that through the purchase of a rather spectacular 15,951 long contracts -- but increased their gross short position by 11,189 contracts. These are huge numbers for such a small category.
The only sellers during the week were the traders in the Other Reportables category...reducing their net long position by 819 COMEX contracts.
Doing the math: 4,762 plus 81 minus 819 equals 4,024 COMEX contracts... the change in the commercial net short position, which it must do.
The commercial net short position in gold is now up to 200,806 COMEX contracts/20.081 million troy ounces of the stuff.
The Big 4 commercial traders increased their net short position by 2,447 COMEX contracts, up to 130,676 contracts...which is still the lowest short position they've held since June 13 of last year.
The Big '5 through 8' commercial traders actually reduced their short position by a bit...them by 779 contracts, down to 53,363 COMEX contracts held net short...which is the lowest for as long as I have records for.
Ted's raptors, the 41 small commercial traders other than the Big 8, increased their net short position by a further 2,356 contracts. Their current net short position is 16,767 COMEX contracts...still very hefty...but the lowest its been since 16 May 2025. And like in silver in the past, they would have normally been net long gold by tens of thousands of contracts at this point in the price cycle.
Here's Nick's 9-year COT chart for gold -- and updated with the above data. Click to enlarge.
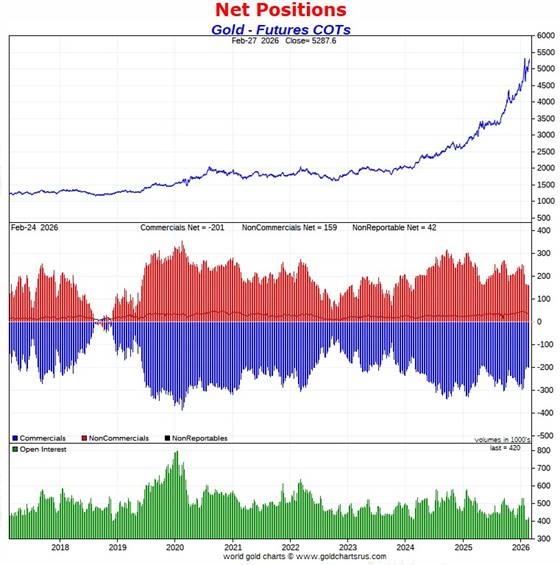
Considering the fact that gold was up a bit under $300 during the holiday-shortened reporting week, I'm very pleased with these numbers.
The commercial traders, which includes the Big 8...plus Ted's raptors...are net short 47.8 percent of the the total open interest in gold in the COMEX futures market...up from the 44.8 percent they were short last week...which remains a perversion.
The set-up in gold, from a COMEX futures market perspective, is very bullish ...but not nearly as bullish as the set-up in silver.
As I said in this spot last week -- and which still applies this week, is that we appear to be on the launchpad for something. It now remains to be seen if these same traders are about to put their collective heads back in the lion's mouth by going back on the short side when they allow the next set of rallies to begin...which appear to be underway.
![]()
In the other metals, the Managed Money traders in palladium increased their net long position by 551 COMEX contracts -- and are net long palladium by 1,084 contracts. But their current gross short position is 4,844 COMEX contracts -- and still the largest short position by far of any of the other categories...commercial traders included. Why this continues to be the case, I have no idea.
The commercial traders in the Swap Dealers category are net long palladium by 1,566 contracts...up 534 contracts on the week. The traders in the Producer/ Merchant category are net short 3,324 COMEX contracts...up 658 contracts from last week. The traders in the Other Reportables category are now on the short side by 420 contracts -- and the Nonreportable/ small trader categories remain net long palladium by 1,094 contracts.
As you can tell from these numbers, palladium is a pretty dinky market. Total open interest is down to 16,423 COMEX contracts and, like gold and silver, the lowest it's been in a very long time.
The world's banks are now net short 10.3 percent of total open interest in palladium in the COMEX futures market as of the February's Bank Participation Report that came out three weeks ago...which is a slight decrease from the 10.6 percent that they were net short in January's Bank Participation Report.
This is a very strange and twisted market once you get a look into its internal structure...with platinum not that far behind.
In platinum, the Managed Money traders increased their net long position by a further 1,661 COMEX contracts during the reporting week -- and are now net long platinum by 5,087 contracts. The traders in the Other Reportables and Nonreportable/ small trader category remain net long platinum by very respectable amounts.
The commercial traders in the Producer/Merchant category in platinum are net short 13,406 COMEX contracts...up 747 contracts from what they were net short last week. The Swap Dealers in the commercial category also increased their net short position, them by 322 COMEX contracts this past week -- and are net short platinum by 6,199 COMEX contracts.
It's mostly the world's banks that are 'The Big Shorts' in platinum in the COMEX futures market, as per February's Bank Participation Report that came out three weeks ago Friday -- and mostly European banks. They and the U.S. banks didn't do much in the February Bank Participation Report.
In copper, the Managed Money traders decreased their net long position by a further 2,747 COMEX contracts during the past reporting week -- and remain net long copper by 51,027 contracts...about 1.276 Billion pounds of the stuff. That's down from the 53,774 COMEX contracts/1.344 billion pounds of the stuff that they were net long last week.
Copper, like palladium, continues to be a wildly bifurcated market in the commercial category. The Producer/Merchant category is net short a grotesque 95,787 copper contracts/ 2.395 billion pounds -- while the Swap Dealers are net long 23,439 COMEX contracts/586 million pounds of the stuff.
Whether this dichotomy in copper means anything or not, will only be known in the fullness of time. Ted Butler said it didn't mean anything as far as he was concerned, as they're all commercial traders in the commercial category. But this bifurcation has been in place for as many years as I've been keeping records -- and that's a very long time.
In this vital industrial commodity, the world's banks...both U.S. and foreign... are net short copper by 2.4% of total open interest in the February Bank Participation Report. Back in the October BPR, these same banks were net long 0.9% of the total open interest in copper in the COMEX futures market. So basically they're market neutral...but only numerically, as that dichotomy between the two groups of commercial traders is still there.
At the moment it's all the commodity trading houses such as Glencore and Trafigura et al., along with some hedge funds, that are mega net short copper in the Producer/Merchant category, as the Swap Dealers are net long, as pointed out above.
The next Bank Participation Report is due out on Friday, March 6.
![]()
Here’s Nick Laird’s “Days to Cover” chart, updated with the COT data for positions held at the close of COMEX trading on Tuesday, February 24. It shows the days of world production that it would take to cover the short positions of the Big 4 — and Big '5 through 8' traders in every physically traded commodity on the COMEX. This chart is a graphical representation of what's shown in the COT Report above. Click to enlarge.
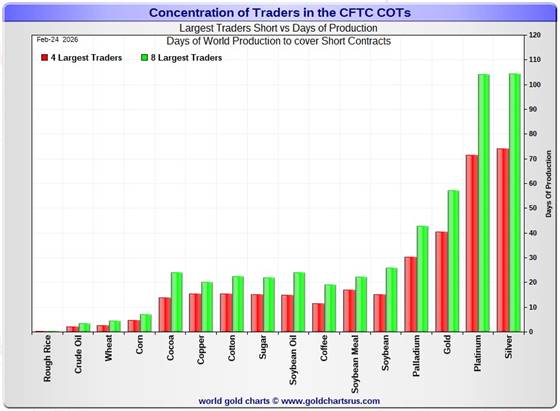
In this week's data, the Big 4 traders are short 74 days of world silver production...down 5 days from the prior COT report. The ‘5 through 8’ large traders are short an additional 30 days of world silver production...up one day from last week's report...for a total of 104 days that the Big 8 are short -- and down 4 days from that last COT Report -- and the smallest number of days short that the Big 8 have ever been.
Those 104 days that the Big 8 traders are currently short, represents 3.5 months of world silver production, or 234.595 million troy ounces/46,919 COMEX contracts -- and that's not a lot. That's down a bit from the 241.950 million troy ounces/48,390 contracts in last Friday's COT Report.
In gold, the Big 4 are short about 41 days of world gold production...up 1 day from the prior report -- and the Big '5 through 8' are short an additional 16 days of world production...down 1 day from last week, for a total of 57 days of world gold production held short by the Big 8 commercial traders -- and obviously obviously unchanged from last Friday's COT Report. This is a very low number for them as well.
The other standout of these Days-to-Cover charts, this one included, is the fact that the vast majority of the short positions in the four precious metals, plus other commodities, is held by the four largest traders...the red bars. Whereas the short positions held by the '5 through 8' large traders....the green bars, minus the red bars...is very small -- and the smallest they've been because these traders now hold their smallest short positions I have records for in silver.
In silver, I suspect that the vast majority of the short position in the Big 4 traders category is mostly held by only two traders...both of them U.S. banks.
The other thing worth noting in the above charts is that the short positions held by the Big 4 and Big '5 though 8' traders in platinum now mirrors the days of world production that silver is short. This is a graphical representation of why I consider platinum be 'da boyz' No. 2 problem child after silver.
The short interest position in SLV now sits at 45.79 million shares/troy ounces as of the last short report that came out this past Wednesday, for positions held at the close of trading on Friday, February 13 -- down 27.76 million shares/ troy ounces sold short from the prior report...a decrease of 37.74%. This number, which represents 8.02% of total SLV shares outstanding, remains off-the-charts grotesque and obscene -- and yet another way that 'da boyz' are keeping a lid on the silver price.
In the overall in yesterday's COT Report, the short positions of the Big 8 commercial traders in silver continues its persistent decline -- and the set-up in it is now beyond wildly bullish. We are done to the downside. And after a 65,900 contract drop in the short positions of the Big 8 traders in gold since January 13, the set-up in it has to be considered very bullish as well...but not nearly as much as it is in silver. I consider gold done to the downside as well ...even if it's not white hot bullish.
As Ted Butler had been pointing out ad nauseam, the resolution of the Big 4/8 short positions will be the sole determinant of precious metal prices going forward...although that short position in gold held by his raptors continues to be a negative factor as well...but even that short position has been drastically reduced in the last two months.
But as he also pointed out over the years, there would come a time when what the numbers show in the COT Report won't matter, as events in the real world...whatever they may be...will overtake them. For the moment, it still does matter, however not for much longer I suspect. Make no mistake about it, the commercial traders of whatever stripe have been moving heaven and earth to reduce their short exposure as much as possible -- and they look done to the downside to me in both silver and gold. All that we await now, is its resolution -- and the big bear raids we've endured over the last month or so, are all part and parcel of that process.
![]()
CRITICAL READS & VIDEOS
Core wholesale prices rose 0.8% in January, much more than expected
Wholesale prices rose at a faster-than-expected pace in January, countering hopes that inflation was easing, the Bureau of Labor Statistics reported Friday.
The core producer price index, which excludes volatile food and energy prices, increased a seasonally adjusted 0.8%, more than the 0.6% gain in December and well ahead of the Dow Jones consensus estimate for 0.3%.
On an all-items basis, the headline PPI rose 0.5%, also above the forecast for 0.3% and 0.1 percentage point more than the prior month.
For the full year, core wholesale prices accelerated 3.6%, while the headline index posted a 2.9% gain. Both figures are well ahead of the Federal Reserve’s 2% inflation goal and suggest that rising prices are still a factor for the U.S. economy.
Services prices primarily drove the increase, with a 0.8% monthly rise that was the highest since July 2025. By contrast, goods prices actually fell 0.3%, though core goods prices climbed 0.7%.
This news item appeared on the cnbc.com Internet site at 8:33 a.m. on Friday morning EST -- and I thank Swedish reader Patrik Ekdahl for sending it our way. Another link to it is here. The Zero Hedge spin on this is headlined "Surging Services Costs Spark Unexpected Surge in U.S Producer Prices in January" -- and linked here.
![]()
'Soft' Data Soars to 2-Year Highs as Chicago PMI Smashes Expectations
Market News International's Chicago Business Barometer smashed expectations this morning, print 57.7 -- the highest since May 2022 - and above the highest analysts' expectation.
This is the second straight month above 50 (signaling expansion) with new orders and employment surging (but prices also rising)...
- Prices paid rose at a faster pace; signaling expansion
- New orders rose at a faster pace; signaling expansion
- Employment rose and the direction reversed; signaling expansion
- Inventories fell and the direction reversed; signaling contraction
- Supplier deliveries rose at a faster pace; signaling expansion
- Production rose at a faster pace; signaling expansion
- Order backlogs fell and the direction reversed; signaling contraction
This post-government-shutdown rebound in survey-based data has pushed 'soft' data to its highest since Jan 2024...and while 'hard' data has limped lower recently, its remains comfortably positive.
This tiny 2-chart Zero Hedgenew story appeared on their Internet site at 10:05 a.m. on Friday morning EST -- and another link to it is here.
![]()
Sometimes Not Liquid at All -- Doug Noland
Crisis dynamics gained important momentum this week.
“Blue Owl Shares Post Worst Month Ever on Private Credit Fears.” “KKR BDC Slides on Rise in Troubled Loans.” “BlackRock Private Debt Fund Slumps After Slashing Dividend.” “Apollo’s MFIC Slashes Dividend, Marks Down Assets, Announces $100M Buyback.” “Private Credit Firm Invico Calls Investors to Manage Exodus Risk.” “No Fed, No Safety Net: Why Private Credit’s First Real Recession Will be its Moment of Truth.” “Blackstone Private Debt Fund Sees More Stress in Software Assets.” “Bain Warns Software Default Rate Risks Hitting Double Digits.” “Blackstone’s Schwarzman Reaped Near-Record $1.24 Billion in 2025.”
Blue Owl’s 2.4% decline this week pushed y-t-d (2-months) losses to 29.4%. KKR sank 13.3% (down 31.2% y-t-d), Ares Management 9.1% (down 30.7%), Apollo Management 12.6% (down 27.7%), and Blackstone 6.5% (down 26.5%). These stocks are sending a strong Credit cycle signal.
Bloomberg: “Bank Shares Walloped by More ‘Cockroach’ Credit Woes, AI.” “Banks Trade Like We’re in the Midst of Crisis.”
Ominously, the KBW Bank Index sank 5.9% this week, boosting losses from February 10th highs to double-digits (10.4%). It was the index’s largest decline since ‘liberation day’ week (April 4th). PNC Financial dropped 8.9% this week, Wells Fargo 8.2%, Zions Bancorp 8.4%, Goldman Sachs 6.8%, Bank of America 6.1%, Morgan Stanley 5.1%, Citigroup 5.0%, and JPMorgan 3.4%. The Broker/Dealer Index fell 2.4%, with losses since February 10th at 7.9%.
The KBW Index’s 5.1% Friday slump was the largest single day decline since April 4th.
Concerns were not limited to the Goliath “money center banks”. The KBW Regional Bank Index was clobbered 7.1% this week, with losses from February 9th highs at 10.0%.
Doug's weekly market commentary is certainly worth your time this week -- and the link to it is here.
![]()
Two informative and worthwhile video interviews
1. Does Trump have an Off Ramp? -- Professor Glenn Diesen
This very interesting 28-minute video interview with the Professor was hosted by Judge Andrew Napolitano on Friday afternoon EST -- and its certainly worth your time if you have the interest. I thank Guido Tricot for this one...plus the one that follows -- and the link to this one is here.
2. INTEL Roundtable w/Larry Johnson & Ray McGovern - Week of 27 February
This important 32-minute video interview with former CIA analysts McGovern and Johnson put in an appearance on the youtube.com Internet site very late on Friday afternoon EST -- and is another video that's definitely worth you while if you have the interest. The link to it is here.
![]()
ECB sells some U.S. dollar assets, cuts weight of dollar in reserves
The European Central Bank sold some of its dollar assets early last year and reduced the weight of the dollar in its foreign exchange reserves in what it said was a standard rebalancing of its portfolio.
The bank played down the significance of the move, which came before the market turbulence generated by U.S. President Donald Trump's tariff announcement last April.
The ECB generated a gain of 909 million euros ($1.07 billion) from this first quarter transaction and invested all proceeds into Japanese yen assets, it said in its financial accounts today.
This Reuters story, filed from Frankfurt, showed up on their website on Thursday -- and I found it embedded in a GATA dispatch. Another link to it is here.
![]()
China encourages dollar buying to slow surging yuan
China's central bank moved to rein in the fast-rising yuan on Friday, scrapping risk reserves requirements for forex forward contracts in a move that would encourage dollar buying as exporters start to feel the pinch from a stronger currency.
The decision came after the yuan hit a near three-year high against the dollar on Thursday. It pulled back in Friday, pausing a sparkling rally largely driven by an unexpected boom in exports.
China's currency is up more than 7% on the dollar since last April. The PBOC's move, along with its weaker-than-expected setting of the currency's trading band on Friday, are the strongest push-back yet on the months-long rally.
"It means the PBOC is intervening as the yuan's appreciation is too fast," said Yuan Tao, an analyst at Orient Futures.
But he said the measure will only slow the yuan's appreciation, expecting the dollar to remain weak.
This Reuters story, co-filed from Beijing and Shanghai showed up on their Internet site at 7:45 p.m. on Thursday morning EST -- and I found it on the gata.org website. Another link to it is here.
![]()
Banks Are Squeezing The Physical Gold Supply: Daniel Oliver Explains Phase Two Volatility
Kitco News Anchor Jeremy Szafron sits down with Daniel Oliver, founder of Myrmikan Capital, to analyze the shifting mechanics of the global gold market and the approaching private credit cycle. Oliver argues that the smooth accumulation phase of the gold bull market is officially over. He details how the market is now entering a volatile second phase driven by stress spreading throughout the U.S. credit system.
During the interview, Oliver outlines the specific pressures facing the Federal Reserve. He highlights a $10 trillion maturity wall and explains the mathematical impossibility of the central bank shrinking its balance sheet while simultaneously attempting to lower interest rates. He further explains how the private equity industry's massive leverage is setting a trap for policymakers, noting that printing money cannot solve underlying insolvency in sectors like commercial real estate.
The conversation also uncovers a hidden squeeze in the physical market. Oliver reveals how nervous banks are tightening margin requirements on smelters. This action forces these entities to shrink their processing pipelines, which directly restricts the physical gold supply entering the broader market and exacerbates price volatility.
This almost 57-minute video interview from Wednesday has to wait until today for length reasons -- and I thank Guido Tricot for finding it for us. Another link to it is here.
![]()
The Banks Have ‘Lost Control’: $300 Silver, India’s Bid & the End of Western Pricing -- Eric Sprott
In this Kitco News exclusive, Senior Anchor Jeremy Szafron sits down with billionaire investor and Sprott Inc. founder Eric Sprott to break down the unprecedented breakout in the precious metals market. With gold establishing a new normal above $5,227 and silver surging past $92 an ounce, Sprott details why the physical short squeeze is unfolding in real time.
We dive deep into the recent CME Globex technical interruption, the drain on Western physical inventories, and why Eastern markets are now fully dictating global price discovery. Sprott also reveals the strategy behind his aggressive capital deployment, including his massive low 40 percent ownership stake in Hycroft Mining, and his recent multi-million dollar sweeps across the junior mining sector with names like Rio Silver and Highlander Silver. From systemic risks mirroring 2008 to quantitative funds fleeing U.S. equities for hard assets, this interview provides critical insights into the resource sector's historic rotation.
This must watch 30-minute video interview with Eric was posted on the youtube.com Internet site very early on Friday afternoon EST -- and I thank reader 'Chris' for pointing it out. Another link to it is here.
QUOTE of the DAY
![]()
The WRAP
"Understand this. Things are now in motion that cannot be undone." -- Gandalf the White
![]()
Another legendary hit-making singer-songwriter passed from our sight yesterday. Short and dark-haired, with a big smile and high-pitched voice, he was a Juilliard-trained, Brooklyn-born son of a Jewish taxi driver who began performing as a teen -- and kept at it for decades. He was a permanent fixture on the pop charts throughout most of the 1960s and 70s when I was growing up -- and the link to one of his most well-known hits is here. RIP Neil -- and thanks for the memories.
Today's classical 'blast from the past' is one I've featured before, but it's been a while, so is time for a revisit. It's George Gershwin's Rhapsody in Blue -- a 1924 composition for solo piano and jazz band -- and something that he tossed together in the five weeks before its premiere.
He improvised a lot of the solo piano at the premiere...much to the consternation of the orchestra -- and because he didn't write the solo piano section until after the concert, it remains unknown exactly how the original rhapsody sounded. It was initially entitled "An Experiment in Modern Music" -- and finally scored for a symphony orchestra in 1942.
Professional music critics recurrently criticized Gershwin's piece as essentially formless and asserted that the composer had haphazardly glued melodic segments together. [They would be right about that. - Ed]
But the paying public didn't care -- and almost a hundred years later, here is Georgian-born classical concert pianist Khatia Buniatishvili at the keyboard... Maestro Leonard Slatkin conducts -- and the Orchestre National de Lyon accompanies. She's having such a good time! -- and the link is here.
![]()
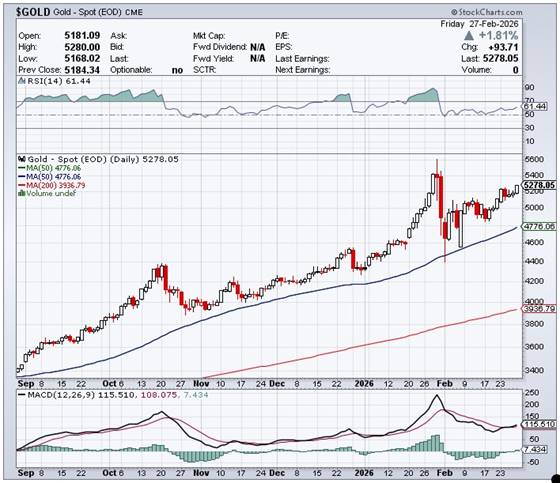
At gold's high tick yesterday, minutes before trading ended, it came within a dollar of closing at $5,300 in the April contract -- and there's no question in my mind that this was deliberate.
But 'da boyz' had all kinds of trouble with silver. Their attempts to halt it at $90 spot crashed and burned...as did their attempts at $92. However, when it broke above $94 by two pennies...that was that -- and it wasn't allowed a sniff of that price mark for the rest of the Friday session. Total silver open interest fell again yesterday by a decent amount -- and except for its brief dip in mid 2023...silver o.i. hasn't been this low since sometime back in 2012.
Once again the precious metal equities looked like they were being managed in the early going...especially the silver stocks. As I said earlier...with silver up 6.23 percent, most of them should have closed with double-digit gains, but that wasn't allowed -- and last Friday's 7.77% gain in the silver price ended up with a gain of only 5.09% in the Silver Sentiment Index.
I'll say again what I've pointed out multiple times this year so far...it's my opinion that the precious metal stocks are being actively managed...the silver shares in particular. My suspicion is that the shares bought during the two counterintuitive rallies we had earlier this week were purchased for the sole purpose of selling into the rally that we had on Friday on the horrid wholesale price news.
But, having said all that, despite the fact that silver is nowhere near its all-time high price of $120+ of a month ago now...the silver shares are obviously under heavy accumulation, because Nick Laird's Silver Sentiment Index closed at a new all-time high yesterday...helped mightily by First Majestic Silver's 89% gain so far this year.
Platinum and palladium were closed well off their respective high ticks. The former's big gain put it back above its 50-day moving average -- and the 'da boyz' were careful to close the latter's below its 50-day moving average for the second day in a row.
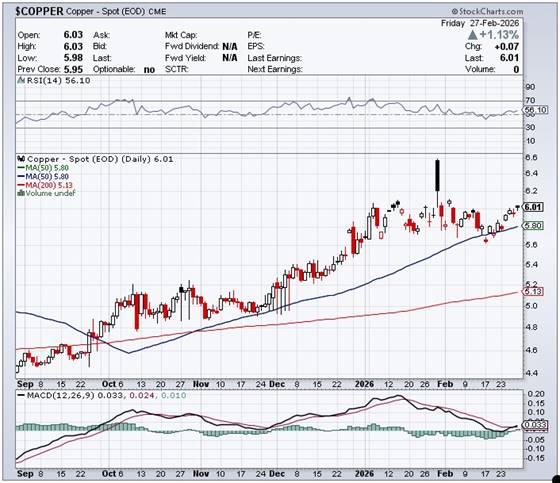
Copper managed to sport a '6' handle by a penny at the end of the day...up 7 cents from its close on Thursday.
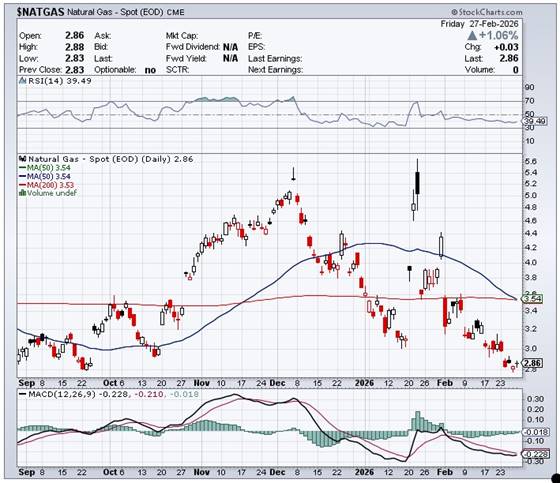
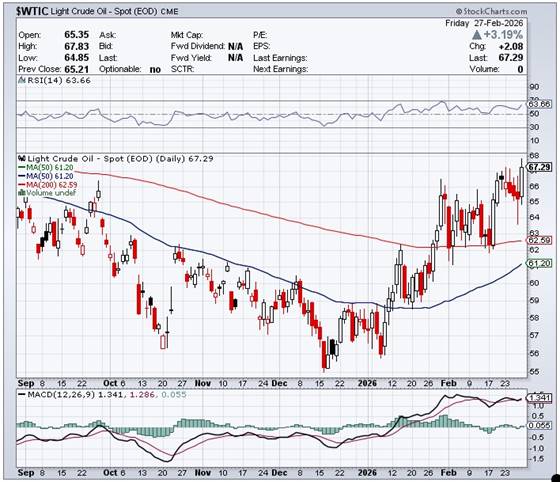
Natural gas [chart included] finished the Friday session higher by an inconsequential 3 cents, at $2.86/1,000 cubic feet. But WTIC had a boomer day, closing up $2.08 at $67.29/barrel -- and now about five dollars above its 200-day moving average.
Here are the 6-month charts for the Big 6+1 commodities as of the COMEX close on Friday...thanks to stockcharts.com as always. Click to enlarge.
We have another report from China on retail silver bullion sales from a real 'Asian Guy'...Fei Yen. This one is from Thursday, February 26 -- and the youtube.com video runs for a bit over 14 minutes. It's worth your while if you have the interest -- and the link is here.
And while we're in China...here's a chart from Nick that's current as of Tuesday, February 24...despite the date on the chart, which says February 13.
It shows the current silver inventory levels at both the SGE and SHFE.
Together they total 26.099 million troy ounces/811.749 metric tonnes...which is back to about the same level as they were at the beginning of November 2015. These numbers don't include the withdrawals from the SHFE that have occurred since Tuesday. Click to enlarge.
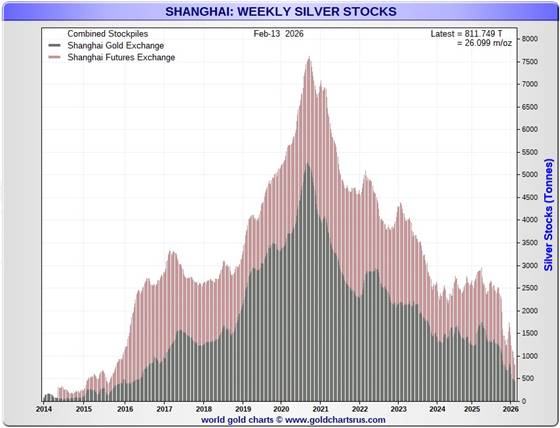
As you are aware, many Chinese silver refiners have licenses to export silver, but with such low inventory levels, one has to wonder if those licenses could get pulled, or have restrictions placed on them at some point...as these silver drains from the SGE and SHFE obviously have their limits...which they're coming up on hard.
With the February delivery month now in the history books, we can now look back and see who all the short/issuers and long/stoppers were for that month in both gold and silver. I post these numbers in my column on a daily basis ...but Nick has them compiled in one spot -- and the Big 8 commercial traders are all present and accounted for. Nick also breaks it down into whether or not the contracts in each were issued and stopped for their house account, or for clients.
They are worth a minute or so of your time. Click to enlarge for both.
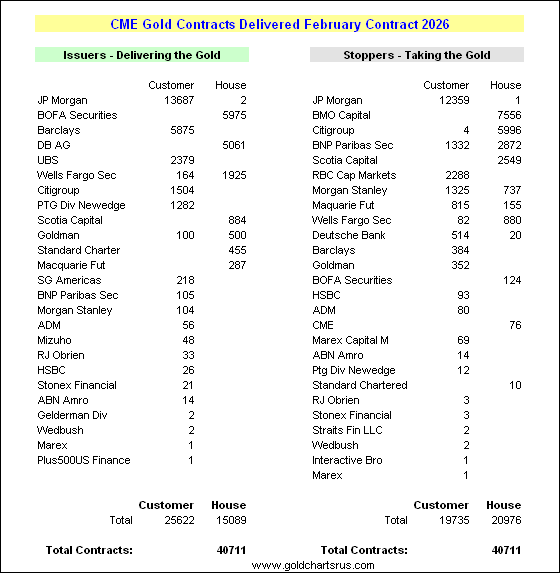
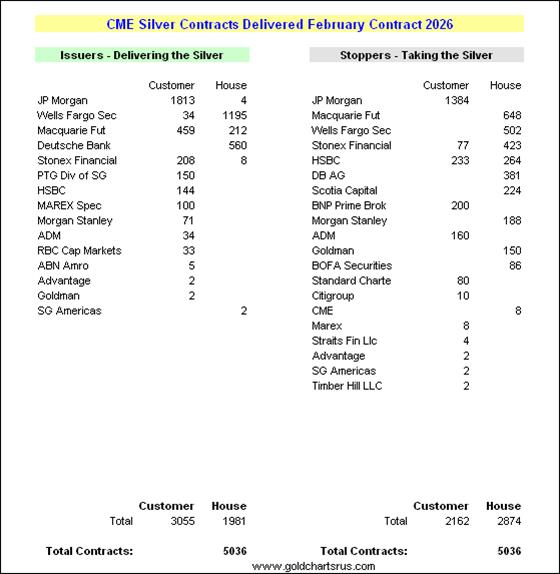
And as Nick correctly pointed out in his covering e-mail...JPMorgan is an issuer and stopper in both metals almost exclusively for clients now. As Ted Butler pointed out many years ago, JPMorgan got out of the rest of their Bear Stearns-inherited short positions in all four precious metals back in March of 2020.
The stage is still intact for big moves up in gold and silver...the latter in particular. Gold open interest remains at a ten year low -- and in the case of silver, it's o.i. is as low as it was back in 2012...except for that tiny dip in mid-2023.
Combine that with the white-hot/incandescent set-up in silver in the COMEX futures market...along with the smallest Big 8 short position I have records for -- along with the new record high in the Silver Sentiment Index...we appear to be on the launchpad for a rally of Biblical proportions.
All we need is something to set it off -- and I suspect that the impending war against Iran will be it when it comes to pass...which is now underway as I post today's missive on the website at 6:45 p.m. EST on Saturday morning. As I've been saying for over a decade now, when the really big moves are allowed to manifest themselves, they won't happen in a news vacuum.
Ted Butler's 'Bonfire of the Silver Shorts' was in the process of going supernova on silver's big rally to over $120 at the end of January...but it was obvious in hindsight that 'da boyz' weren't yet ready, so they killed it. I suspect that the next rally will be the Really Big One -- and when that moment does arrive, the current 2-digit silver price will be history.
And barring a temporary set-back because of a crash in the stock markets, it's now just a waiting game.
I'm done for the day -- and the week -- and I'm still "all in" -- and will remain so to whatever end.
See you Tuesday.
Ed
About the author

SUBSCRIBE: https://edsteergoldsilver.com/

Ed Steer’s Daily Analysis of the Gold and Silver Markets
After eight years of writing about the precious metals for Casey Research, the folks at Stansberry & Associates—who just recently purchased controlling interest in the company—decided that my ‘niche market’ column didn’t fit into their plans.
Since the time that Casey Research was kind enough to offer me a stand-alone column, it became their most highly-rated blog almost from the outset—and has remained that way up to this date...