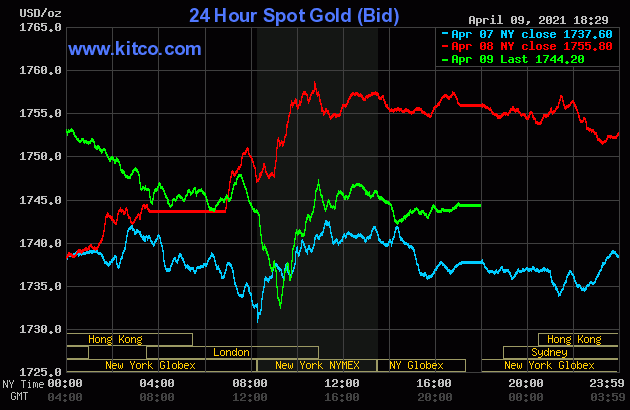
The gold price was stair-stepped lower in price starting at 10 a.m. China Standard Time on their Friday morning -- and the Big 4/8 traders set the low tick at 9:15 a.m. in New York. Its subsequent rally was capped and turned sideways to a bit lower around 10:45 a.m. -- and it didn't do much after that.
The high and low ticks in gold yesterday were recorded as $1,758.20 and $1,730.80 in the June contract. The June/August price spread differential in silver at the close yesterday was $2.00...August/October was $1.90 -- and October/December was $2.00...all signs of a very, very tight wholesale market.
Gold was closed on Friday afternoon in New York at $1,744.20 spot, down $11.60 from Thursday. Net volume, although higher than it has been lately, was still very much on the lighter side at a bit under 164,000 contracts -- and there was a bit over 8,400 contracts worth of roll-over/switch volume on top of that...mostly into August, with a bit into December.
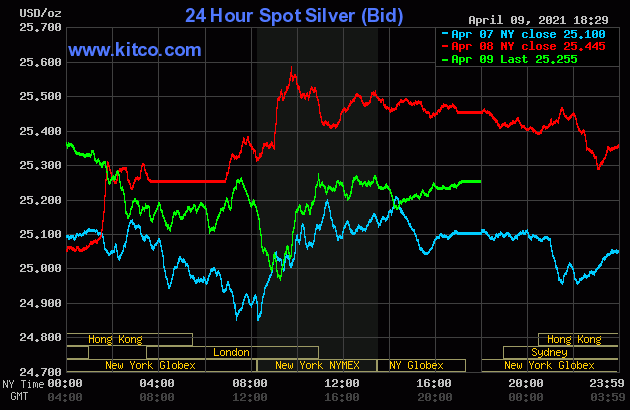
For all intents and purposes, the Big 4/8 traders managed the silver price in a similar fashion as they did gold, including the same identical price inflection points, so I'll spare you the play-by-play once again.
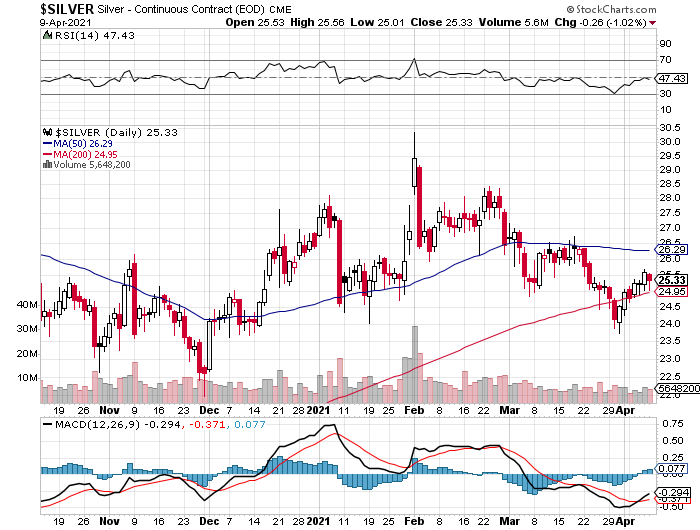
The high and low ticks in silver were reported by the CME Group as $25.555 and $25.01 in the May contract. The May/July price spread differential in silver at the close yesterday was 3.4 cents...July/September was 3.0 cents -- and September/December was 3.3 cents. The wholesale silver market continues to be super tight as well.
Silver was closed in New York on Friday afternoon at $25.255 spot, down 19 cents on day. Net volume was pretty quiet at a hair over 45,000 contracts -- and there was 18,000 contracts worth of roll-over/switch volume out of May and into future months...mostly into July.
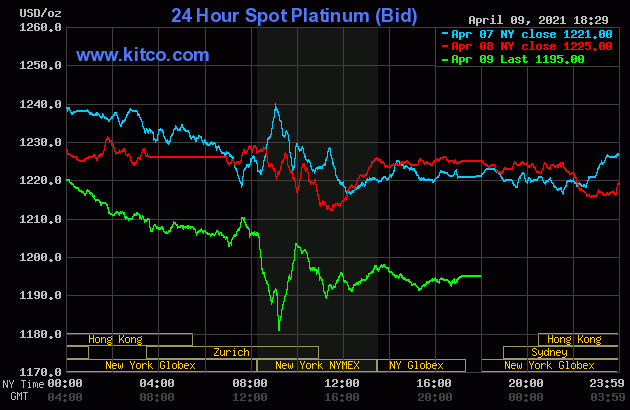
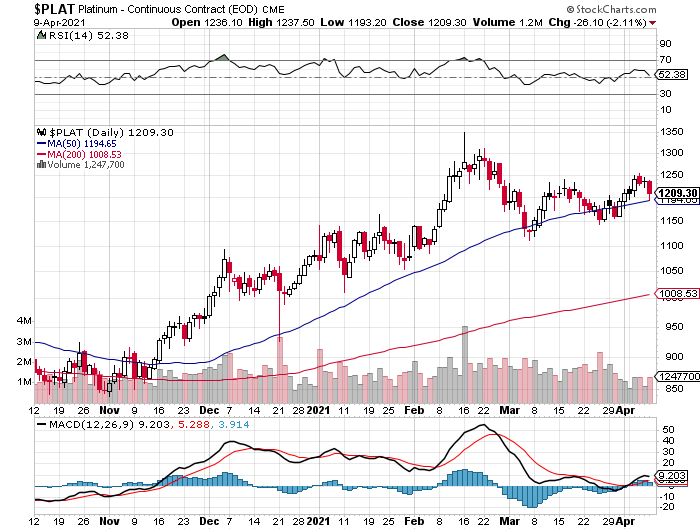
The price pressure in platinum started around 9:30 a.m. China Standard Time on their Friday morning -- and that quiet sell-off continued until minutes after the COMEX open. Then it really got its lights punched out, with the low tick coming very shortly after 9 a.m. EDT. Its ensuing rally was capped and turned lower at the 10 a.m. EDT afternoon gold fix in London -- and that sell-off lasted until shortly after the 11 a.m. EDT Zurich close. It didn't do much of anything after that. Platinum was closed at $1,195 spot, down 30 bucks from Thursday.
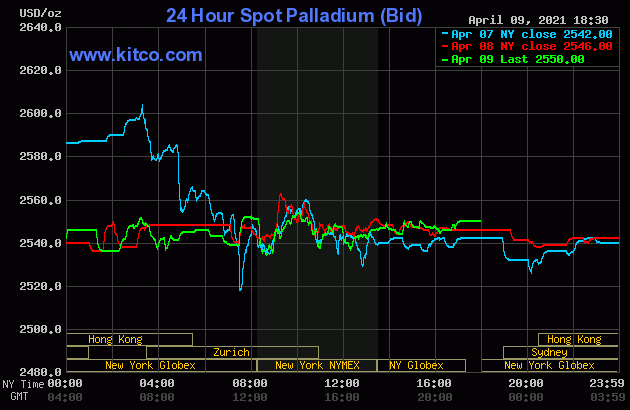
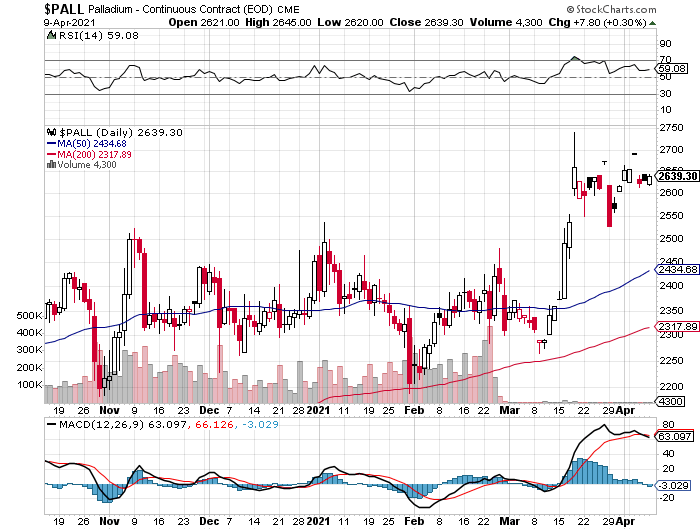
The Big 4/8 traders left the palladium price to its own devices yesterday -- and it didn't do much during the entire Friday trading session anywhere on Planet Earth. Palladium finished the day at $2,550 spot, up 4 dollars from Thursday's close.
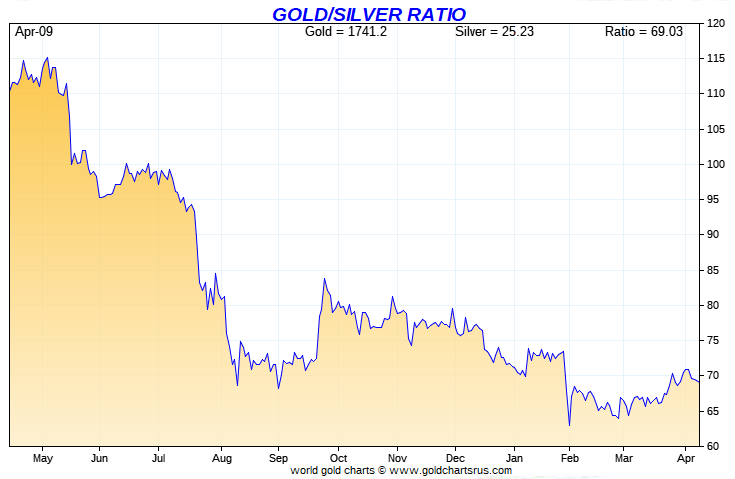
Based on the kitco.com-recorded spot closing prices in silver and gold posted above, the gold/silver ratio worked out to 69.1 to 1 on Friday...compared to 69.0 to 1 on Thursday.
And here's the 1-year Gold/Silver Ratio Chart from Nick, updated with this past week's data. Click to enlarge if necessary.
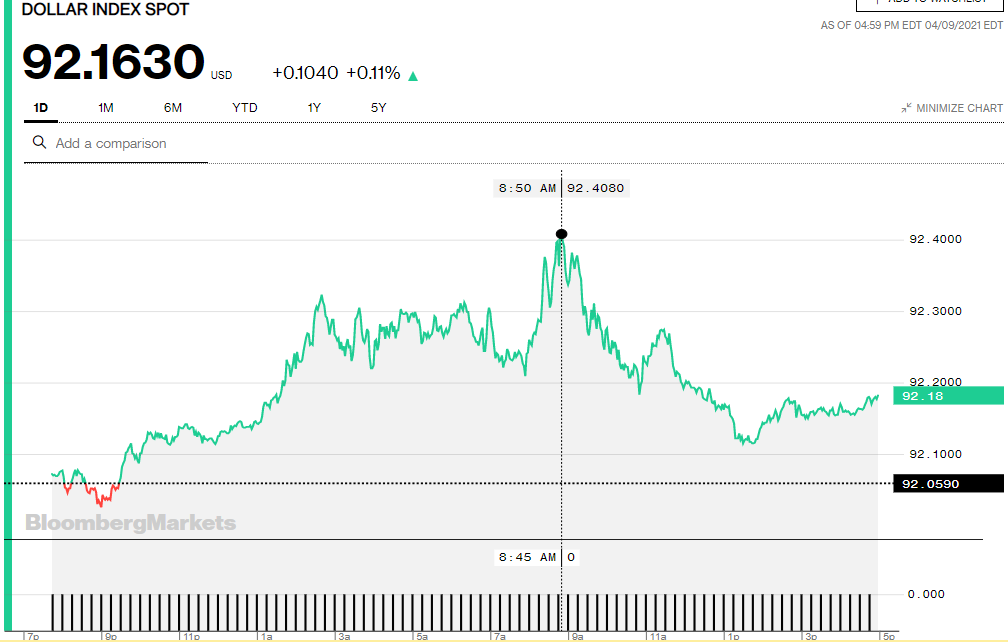
The dollar index closed very late on Thursday afternoon in New York at 92.059 -- and opened higher by one basis point and a bit once trading commenced around 7:45 p.m. EDT on Thursday evening, which was 7:45 a.m. China Standard Time on their Friday morning. It was sold a bit lower from there -- and the 92.03 low tick was set at precisely 9:00 a.m. in Shanghai. From that point it stair-stepped its way quietly and somewhat unevenly higher until the 92.41 high tick was set at 8:50 a.m. in New York. It was down hill from there until the 1:30 p.m. COMEX close -- and it crawled a bit higher from that juncture until trading ended at 5:30 p.m. EDT.
The dollar index finished the Friday trading session in New York at 92.163...up about 10.5 basis points from its close on Thursday.
Here's the DXY chart for Friday, thanks to Bloomberg as always. Click to enlarge.
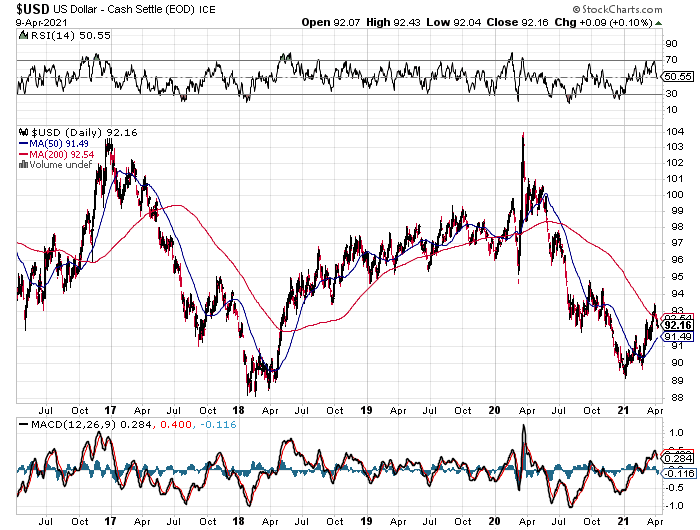
And here's the 5-year U.S. dollar index chart, courtesy of the good folks over at the stockcharts.com Internet site. The delta between its close...92.16...and the close on the DXY chart above, was a small fraction of 1 basis point on Friday. Click to enlarge as well.
U.S. 10-Year Treasury: 1.6660%...up 0.0340...(+2.08%) as of 2:59PM EDT.
![]()
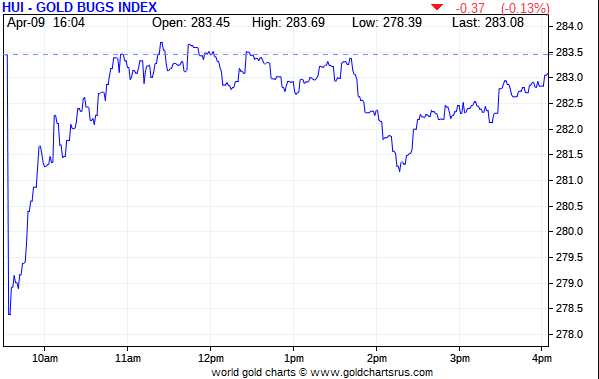
The gold stocks gapped down at the 9:30 a.m. open in New York on Friday morning, but then roared higher -- and were back at the unchanged mark by shortly before 11 a.m. EDT. They didn't do much from there until around 1:45 p.m. -- and were then sold lower over the next thirty minutes. From that point they rallied steadily until the market closed at 4:00 p.m. in New York. The HUI finished down only 0.13 percent.
For whatever reason, Nick's Silver Sentiment/Silver 7 Index chart wasn't recording any data until around 1:25 p.m. EDT. The silver equities afternoon low ticks were set around 2:15 p.m. in New York trading -- and from that juncture they crept quietly and unevenly higher until trading ended at 4:00 p.m. Nick's Index closed down 1.24 percent -- and that's only because Hecla and Coeur Mining got smacked pretty good. Click to enlarge if necessary.
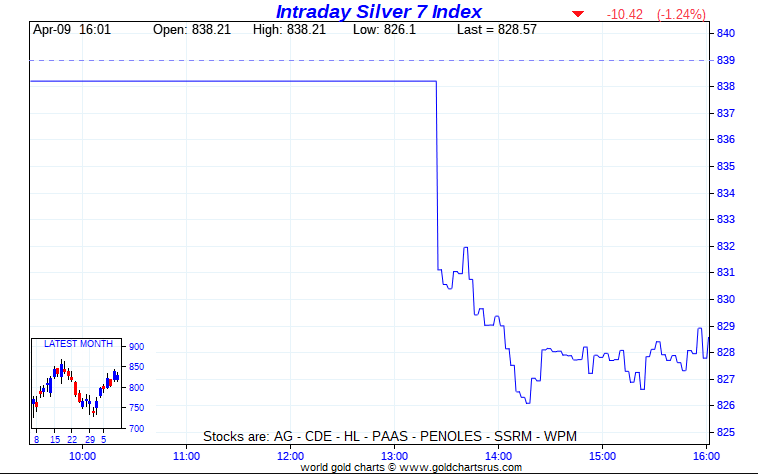
Computed manually, the above index closed lower by 1.17 percent.
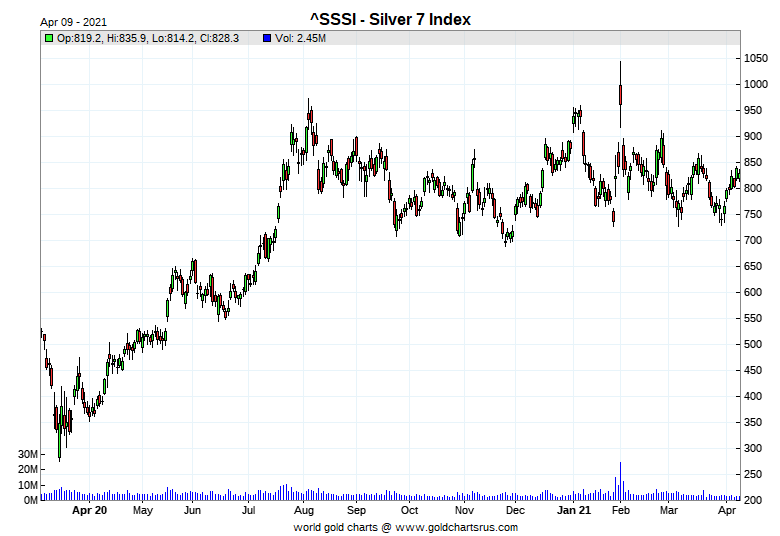
And here's Nick's 1-year Silver Sentiment/Silver 7 Index chart, updated with Friday's candle...which shows 'up' on the day. That's obviously not accurate, and that's because over half the intraday data is missing. The candle on Monday will be OK. Click to enlarge as well.
The 'stars' yesterday were Peñoles and Wheaton Precious Metals...up 0.59 and 0.31 percent respectively -- and the two previously mentioned dogs were Hecla and Coeur Mining, down 4.27 and 2.96 percent respectively.
But considering the way that the Big 4/8 shorts carved up silver and gold prices yesterday, there was some serious bottom fishing going on in most of their associated equities.
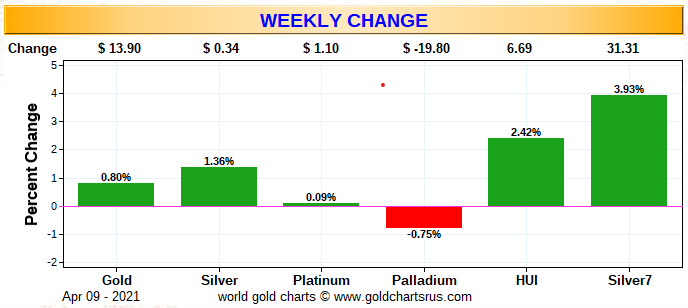
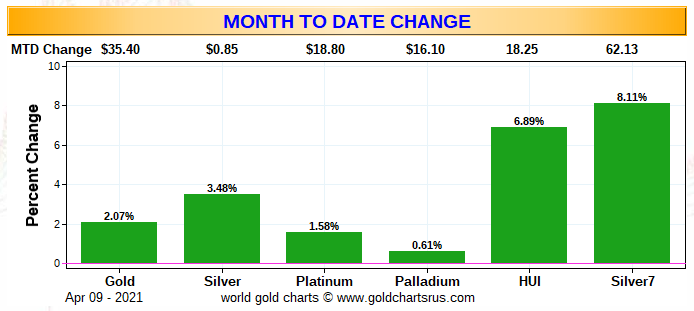
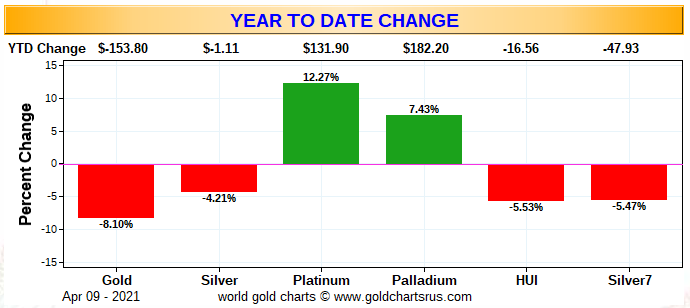
Here are the usual three charts that shows up in every Saturday missive. They show the changes in gold, silver, platinum and palladium in both percent and dollar and cents terms, as of their Friday closes in New York — along with the changes in the HUI and the Silver 7 Index.
Here's the weekly chart -- and with the exception of palladium, everything finished in the green this past week. Click to enlarge.
And here's the month-to-date chart -- and it's green across the board -- and even more impressive than the weekly chart above. The sole reason for that is because April 1, the first business day of the month, was a huge up day in both silver, gold and their associated equities. Click to enlarge.
And here's the year-to-date chart. Gold and silver, plus their associated equities, are still down on the year...but not by a whole heck of a lot now. As I keep repeating, it would only take one or two very decent rally days in the precious metals themselves, to pop their associated equities back into the green year-to-date...particularly the silver stocks. Another couple of weeks like this past week would certainly do the trick...or rally days like we had on April 1. Click to enlarge.
And as I said last week in this spot, when you consider how badly that the Big 4/8 traders have beaten up silver and gold prices year-to-date, their underlying equities have done well for themselves -- and as I've also been contending for many months now, I have a sense of stealth buying underneath the precious metals equity market by the strongest of hands. That was certainly apparent yesterday.
As Ted Butler has pointed out on many occasions, the short positions of the Big 8 traders in general -- and the Big 4 short commercial traders in particular, are the sole reason that precious metal prices aren't at the moon already, as virtually every other group of traders in the COMEX futures market are net long against them in all four precious metals...including almost all the rest of the traders in their respective commercial categories.
In the COT discussion further down, the Big 8 traders increased their short positions in both silver and gold during the reporting week -- and by very decent amounts, particularly in gold. I certainly wasn't happy to see that.
The CME Daily Delivery Report has not been posted on the CME's website as of 4:18 a.m. EDT this morning -- and if that situation is rectified during the course of the weekend, then I'll update this space in the website version, but it obviously won't help for the e-mail version of today's column.
The CME Preliminary Report for the Friday trading session showed that gold open interest in April rose by another 122 contracts, leaving 4,978 contracts still open, minus whatever number of contracts posted for delivery on Tuesday that the CME Group has not yet reported on in the M.I.A. Daily Delivery Report above. Thursday's Daily Delivery Report showed that 61 gold contracts were actually posted for delivery on Monday, so that means that 122+61=183 more gold contracts just got added to the April delivery month. Silver o.i. in April fell by 121 contracts, leaving exactly 400 still around, minus whatever the M.I.A. delivery number for silver is on Tuesday. Thursday's Daily Delivery Report showed that 121 silver contracts are actually posted for delivery on Monday, so the change in open interest and deliveries match for the third day in a row.
Total gold open interest at the close on Friday declined by 6,685 COMEX contracts -- and total silver o.i. at the close yesterday dropped by only 568 contracts.
There were no reported changes in GLD on or SLV on Friday.
In other gold and silver ETFs and mutual funds on Planet Earth on Friday, net of any changes in COMEX, GLD & SLV inventories, there was a net 78,339 troy ounces of gold added -- and a net 508,951 troy ounces of silver was added as well...with that, plus a bit more, going into Sprott and Deutsche Bank.
There was no sales report from the U.S. Mint on Friday.
Month-to-date the mint has sold a paltry 13,000 troy ounces of gold eagles -- 3,500 one-ounce 24K gold buffaloes -- and 596,000 silver eagles.
And still no Q4/2020 or Annual Report from the Royal Canadian Mint.
There was big moment in gold over at the COMEX-approved depositories on the U.S. east coast on Thursday. All of the 'in' activity...70,217.784 troy ounces/2,184 kilobars [SGE kilobar weight] occurred at Brink's, Inc. -- and all of the 'out' activity...160,755.000 troy ounces/5,000 kilobars [SGE kilobar weight] happened over at JPMorgan. That's the second shipment of that amount out of JPMorgan in last the week. There was also some paper activity, as 13,926 troy ounces was transferred from the Registered category and into Eligible over at JPMorgan's 'Enhanced Delivery' sub-depository. The link to all this gold activity is here.
There was also decent movement in silver -- and all of it in the 'out' category...984,973 troy ounces in total. Five different depositories were involved -- and the two largest were the 717,952 troy ounces that departed CNT...followed by the 124,633 troy ounces that left JPMorgan. In the paper department, there was 584,771 troy ounces, one truckload, that was transferred from the Eligible category and into Registered over at the International Depository Services of Delaware. I would suspect that this is now destined for delivery in April sometime. The link to all this silver activity is here.
There was a reasonable amount of activity over at the COMEX-approved gold kilobar depositories in Hong Kong on their Thursday. They reported receiving 76 of them -- and shipped out 538. Except for the 33 kilobars that departed Loomis International, the remaining in/out activity took place over at Brink's, Inc. as usual. The link to that, in troy ounces, is here.
Here are the usual two 20-year charts that show up in this space most every Saturday. They show the total amount of physical gold and silver in all know depositories, ETFs and mutual funds as of the close of business on Friday.
For the week just past, there was a net 684,000 troy ounces of gold withdrawn, mostly from GLD -- and Ted would assume that all of this now owned by JPMorgan. In silver, there was a net 148,000 troy ounces withdrawn. Click to enlarge for both. Click to enlarge for both.
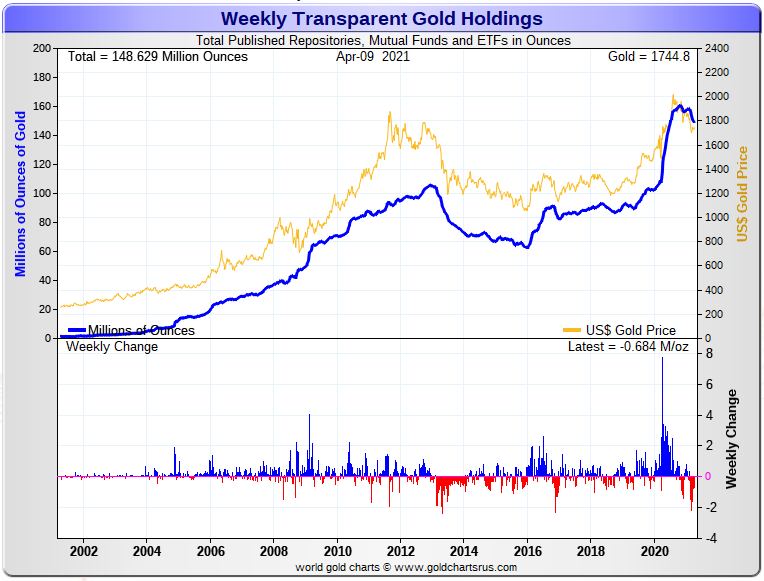
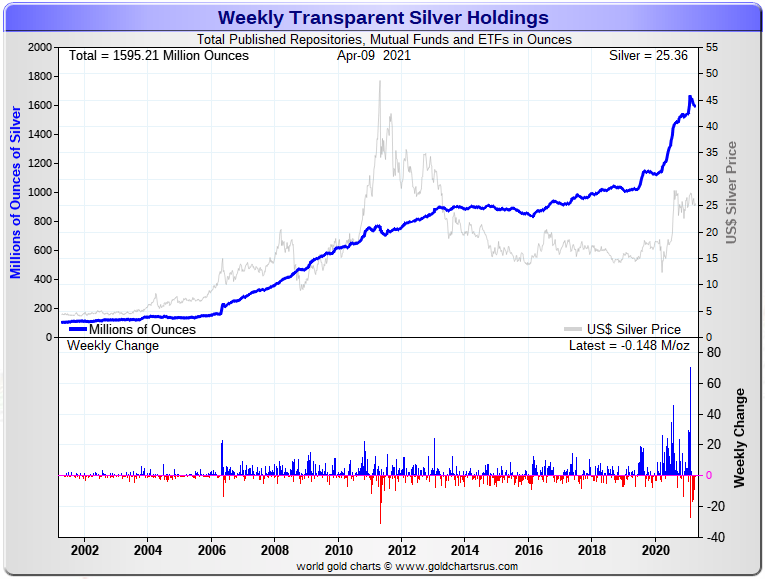
And just eye-balling the last almost eight or so months of deposits and withdrawals in the above two charts since the price peaks in gold and silver in early August of last year, it's obvious that only a small fraction of the amount of those two precious metals that has been deposited in these various and sundry ETFs and mutual funds, has been withdrawn over that same time period.
And as Ted has pointed out, most of the gold withdrawn has come from GLD --and is most likely owned by JPMorgan now. Then in silver, most of the withdrawals from SLV have been conversion of SLV shares for physical metal, which really aren't withdrawals at all.
So despite what you might think, these charts don't look at all bearish to me -- and they shouldn't to you, either.
The Commitment of Traders Report, for position held at the close of COMEX trading on Tuesday, showed a fairly substantial increase in the short position in silver -- and pretty big one in gold. I was expecting increases in both, but not this large -- and I wasn't overly amused.
In silver, the Commercial net short position increased by 5,424 contracts, or 27.1 million troy ounces.
They arrived at that number by reducing their long position by 2,895 contracts -- and also increased their short position by 2,529 contracts. It's the sum of those two numbers that represents their change for the reporting week.
Under the hood in the Disaggregated COT Report, it was mostly the Managed Money traders on the buy side, as they increased their net long position by 3,602 contracts -- and the Nonreportable/small traders also increased their net long position, them by 2,079 contracts. But the traders in the Other Reportables category went in the opposite direction, as they decreased their net long position, but only by 257 contracts.
Doing the math: 3,602 plus 2,079 minus 257 equals 5,424 COMEX contracts, the change in the Commercial net short position.
The Commercial net short position in silver now stands at 252.9 million troy ounces, up from the 225.8 million troy ounces they were short in last week's COT Report.
The Big 8 traders are short 361.7 million troy ounces in this week's report, compared to the 351.0 million troy ounces that the Big 8 were short in last week's COT Report.
As of this week's COT Report, the Big 8 traders are short 143 percent of the Commercial net short position, compared to the 155 percent they were short in last week's report.
Ted figured that JPMorgan sold the 1,000 or so long contracts they had in silver during this past reporting week -- and are back to being market neutral.
Here's the 3-year COT chart for silver, courtesy of Nick Laird -- and the weekly change should be noted. Click to enlarge.
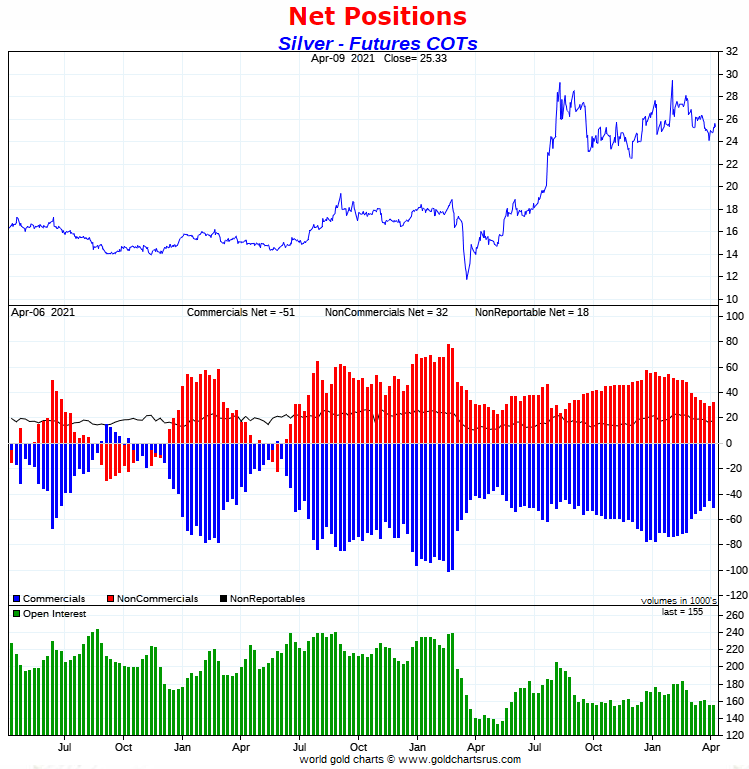
I certainly wasn't surprised by an increase in the Commercial net short position in silver, because it broke above and close above its 200-day moving average at the end of the reporting week, although it was below it at the beginning of that period. What surprised me was the size of it.
But this changes little in the very bullish structure in the COMEX futures market in silver -- and it's still set up for a big move higher. And not to be forgotten is the tight-as-a-drum retail and wholesale physical markets in this precious metal as well.
In gold, the commercial net short position increased by a rather surprising 21,073 contracts, or 2.11 million troy ounces.
They arrived at that number by reducing their long position by 13,876 contracts -- and also increased their short position by 7,197 contracts. Like in silver, it's the sum of those two numbers that represents their change for the reporting week.
Under the hood in the Disaggregated COT Report, it was all Managed Money traders...plus a bit more, which was the big surprise for Ted, because they normally don't jump onto the buy side until a significant moving average has been broken -- and none had. But that didn't stop them from being aggressive buyers, as they increased their net long position by 23,399 contracts -- and because of that, the commercial traders were forced to sell to them, or the gold price would have been at the moon already.
The other two categories, the Other Reportables and Nonreportable/small traders both decreased their net long position by small amounts during the reporting week...the former by 1,418 contracts -- and the latter by 908 contracts.
Doing the math: 23,399 minus 1,418 minus 908 equals 21,073 COMEX contracts, the change in the commercial net short position.
The commercial net short position in gold is back up to 21.48 million troy ounces, compared to the 19.37 million troy ounces they were short in last week's COT Report.
The Big 8 traders are short 21.45 million troy ounces of gold in this week's COT Report, compared to the 20.09 million troy ounces they were short in last week's report.
The Big 8 are now short a hair under 100 percent of the commercial net short position in gold, compared to the 104 percent that they were short in last week's COT Report.
Looking at the Producer/Merchant category, it was Ted's opinion that JPMorgan sold about 3,000 contracts of its long position in gold -- and are back to being net long about 6,000 COMEX gold contracts...down from the 9,000 or so contracts they were short in last week's COT Report.
Here's Nick's 3-year COT chart for gold -- and the weekly change should be noted. Click to enlarge.
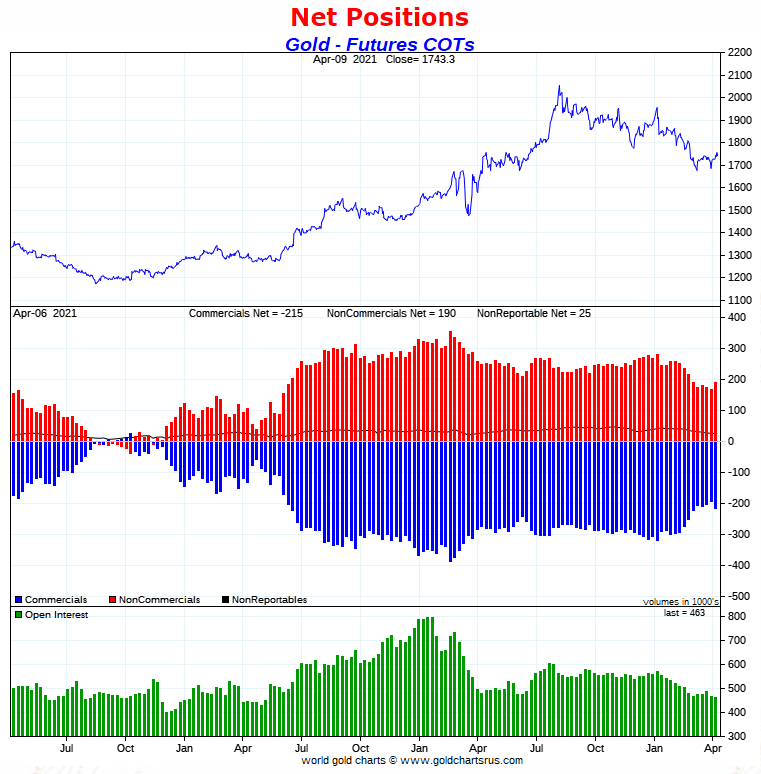
Although there certainly was deterioration in gold this past week on the surprise buying by the Managed Money traders, the COT set up in the COMEX futures market in gold, like in silver, is still extremely bullish. I'll have more about this in The Wrap.
And although there appears to be lots of gold in the world, the price spread differentials reported on the CME's website still scream of tightness in the wholesale market. Ditto for silver.
In the other metals, the Managed Money traders in palladium increased their net long position by a further 176 COMEX contracts during the last reporting week -- and are now net long the palladium market by 3,433 COMEX contracts...around 33 percent of the total open interest...up about two percentage points from last week. And as I continue to point out for what seems like forever now, the COMEX futures market in palladium continues to be a market in name only. In platinum, the Managed Money traders, after doing nothing for the past two weeks, increased their net long position by 3,486 contracts -- and are now net long the platinum market by 24,055 COMEX contracts...about 35 percent of total open interest -- up about 5 percentage points from last week. In copper, the Managed Money traders increased their net long position by 4,781 contracts -- and are net long copper to the tune of 46,967 COMEX contracts...about 1.17 billion pounds of the stuff -- and about 19 percent of total open interest...up about 1 percentage point from last week.
Here’s Nick Laird’s “Days to Cover” chart, updated with the COT data for positions held at the close of COMEX trading on Tuesday, April 6. It shows the days of world production that it would take to cover the short positions of the Big 4 — and Big '5 through 8' traders in each physically traded commodity on the COMEX. Click to enlarge.
I consider this to be the most important chart that shows up in every Saturday column.
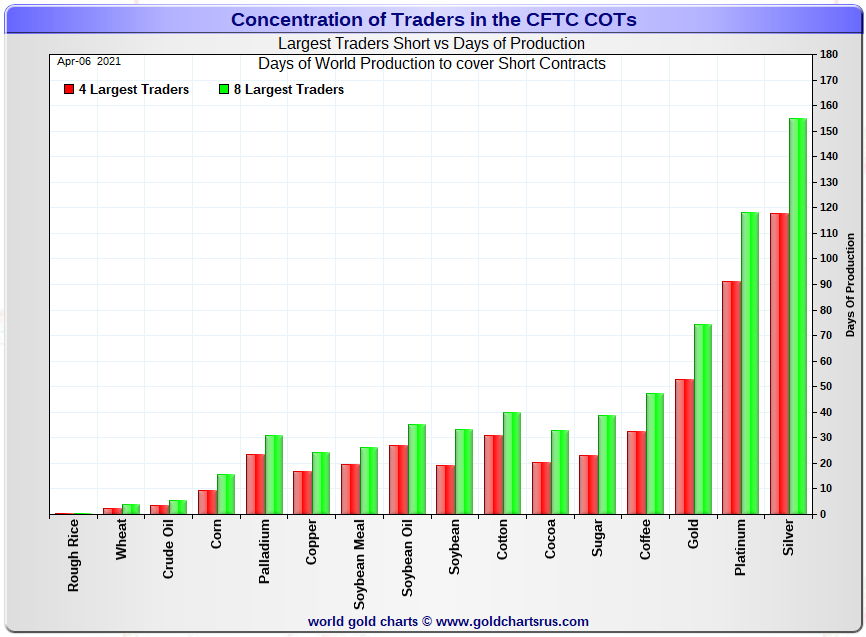
The Big 4 traders are short about 118 days of world silver production, up about 5 days from the prior week's report. The ‘5 through 8’ large traders are short an additional 37 days of world silver production...unchanged from the prior COT Report -- and the week before — for a total of about 155 days that the Big 8 are short...obviously up 5 days from last week's COT report. [In the prior reporting period they were short 150 days of world silver production.]
This represents a bit over five months of world silver production, or about 361 million troy ounces of paper silver held short by the Big 8.
In the COT Report above, the Commercial net short position in silver was reported by the CME Group at 253 million troy ounces. As mentioned in the previous paragraph, the short position of the Big 4/8 traders is around 361 million troy ounces. So the short position of the Big 4/8 traders is larger than the total Commercial net short position by about 361-253=108 million troy ounces...down about 16 million troy ounces from last week's report...so these small commercial traders were big long sellers during the reporting week.
The reason for the difference in those numbers...as it always is...is that Ted's raptors, the 31-odd small commercial traders other than the Big 8, are net long that amount.
Another way of stating this [as I say every week in this spot] is that if you remove the Big 8 shorts from the commercial category, the remaining traders in the commercial category are net long the COMEX silver market. It's the Big 8 against everyone else...a situation that has existed for almost five decades in silver -- and in platinum and palladium as well...and as of last week's COT Report, now in gold too!
As per the first paragraph above, the Big 4 traders in silver are short around 118 days of world silver production in total. That's about 29.5 days of world silver production each, on average...up a bit from last week's COT Report. The four big traders in the '5 through 8' category are short 37 days of world silver production in total, which is a bit more than 9 days of world silver production each, on average...unchanged for the last three weeks in a row.
The Big 8 commercial traders are short 46.8 percent of the entire open interest in silver in the COMEX futures market, which is up a bit from the 45.3 percent they were short in last week's COT report. And once whatever market-neutral spread trades are subtracted out, that percentage would be over the 50 percent mark. In gold, it's 46.3 percent of the total COMEX open interest that the Big 8 are short, which is up from the 43.0 percent they were short in the prior week's COT Report -- and also over the 50 percent mark once their market-neutral spread trades are subtracted out.
In gold, the Big 4 are short 53 days of world gold production, up 2 days from last week's COT Report. The '5 through 8' are short 21 days of world production, also up 2 from last week's report...for a total of 74 days of world gold production held short by the Big 8 -- and obviously up 4 days from last Friday's COT Report. Based on these numbers, the Big 4 in gold hold about 72 percent of the total short position held by the Big 8...down about 1 percentage point from last week's report.
As mentioned further up, Ted said that JPMorgan is still long around 6,000 contracts in gold, down 3,000 contracts from last week's report -- and are now market neutral in silver, which is down from the 1,000 contracts that they were long in last week's COT Report. They have been a non-factor in the COMEX futures market for the last year...leaving the other Big 8 traders to struggle through on their own.
The "concentrated short position within a concentrated short position" in silver, platinum and palladium held by the Big 4 commercial traders are about 76, 72 and 74 percent respectively of the short positions held by the Big 8...the red and green bars on the above chart. Silver is up about 1 percentage point from last week's COT Report...platinum is down about 1 percentage point from a week ago -- and palladium is down about 5 percentage points week-over-week.
The Big 8 shorts are still hugely exposed in all four precious metals in the COMEX futures market, especially the Big 4...or maybe just the Big 2. They increased their short positions in both silver and gold by very reasonable amounts during the reporting week -- and the above chart tells you all you need to know about their current plight.
The situation regarding the Big 4/8 shorts continues to be beyond obscene, twisted and grotesque -- and as Ted correctly points out, its resolution will be the sole determinant of precious metal prices going forward.
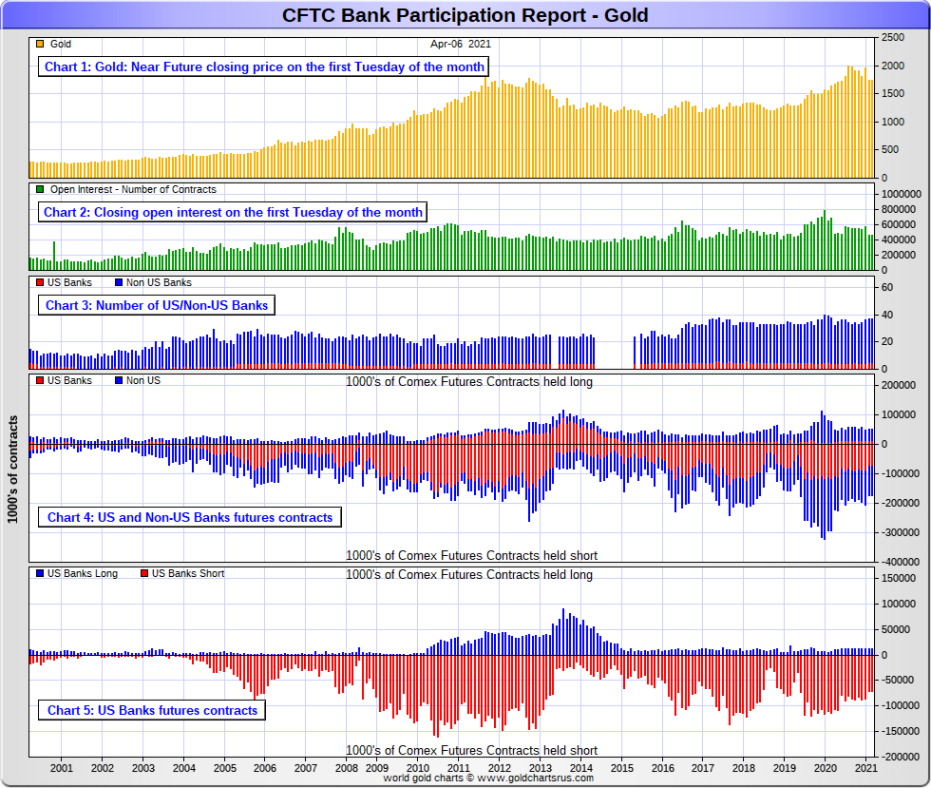
The April Bank Participation Report [BPR] data is extracted directly from yesterday's Commitment of Traders Report. It shows the number of futures contracts, both long and short, that are held by all the U.S. and non-U.S. banks as of Tuesday’s cut-off in all COMEX-traded products. For this one day a month we get to see what the world’s banks are up to in the precious metals —and they’re usually up to quite a bit...however, there weren't many changes this past month.
[The April Bank Participation Report covers the time period from March 3 to April 6 inclusive.]
In gold, 5 U.S. banks are net short 59,250 COMEX contracts in the April BPR. In March’s Bank Participation Report [BPR] these same 5 U.S. banks were net short 59,629 contracts, so there was a smallish decrease of 379 contracts from four weeks ago, which is not even a rounding error.
Citigroup, HSBC USA, Goldman Sachs and Morgan Stanley would most likely be the U.S. banks that are short this amount of gold. I still have some suspicions about the Exchange Stabilization Fund as well, although if they're involved, they are most likely just backstopping these banks.
Also in gold, 32 non-U.S. banks are net short 63,774 COMEX gold contracts. In March's BPR, these same 32 non-U.S. banks were net short 63,187 COMEX contracts...so the month-over-month change shows a tiny increase of 587 COMEX contracts...just about the same as the decrease at the U.S. banks..so it was a wash for the month as a whole in gold.
At the low back in the August 2018 BPR...these same non-U.S. banks held a net short position in gold of only 1,960 contacts -- and they've been back on the short side in a big way ever since.
I suspect that there's at least two large non-U.S. bank in this group, one of which would be Scotiabank/Scotia Capital...plus HSBC most likely. And I have my suspicions about Barclays, Dutch Bank ABN Amro, French bank BNP Paribas, plus Australia's Macquarie as well. Other than that small handful, the short positions in gold held by the vast majority of non-U.S. banks are mostly immaterial and, like in silver, have always been so.
As of this Bank Participation Report, 37 banks [both U.S. and foreign] are net short 26.6 percent of the entire open interest in gold in the COMEX futures market, which is up a tiny amount from the 26.3 percent that these same 37 banks were short in the March BPR.
Here’s Nick’s BPR chart for gold going back to 2000. Charts #4 and #5 are the key ones here. Note the blow-out in the short positions of the non-U.S. banks [the blue bars in chart #4] when Scotiabank’s COMEX short position was outed by the CFTC in October of 2012. Click to enlarge.
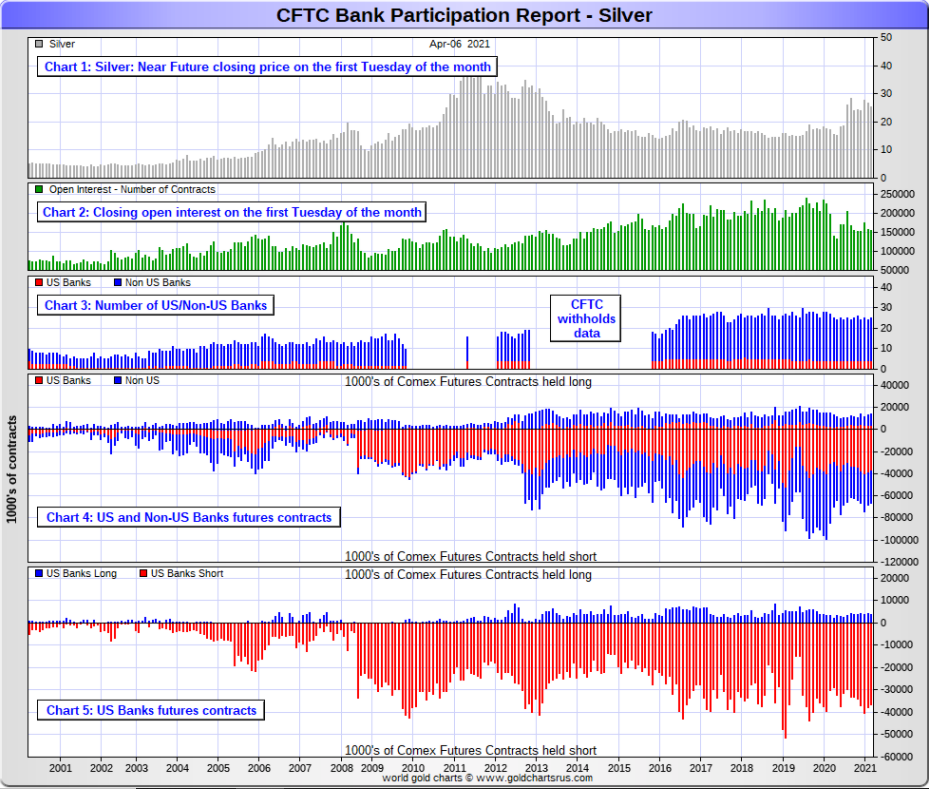
In silver, 4 U.S. banks are net short 32,923 COMEX contracts in April's BPR. In March's BPR, the net short position of these same 4 U.S. banks was 33,977 contracts, so the short position of the U.S. banks decreased by a minuscule 54 contracts month-over-month. There's nothing to see here, although like in gold, the intra-month changes were probably pretty impressive.
As in gold, the three biggest short holders in silver of the four U.S. banks in total, would be Citigroup, HSBC USA -- and Goldman or maybe Morgan Stanley in No. 3 and 4 spots. But after Ted's column on Wednesday, I'm starting to wonder about Bank of America. And, like in gold, I'm starting to have my suspicions about the Exchange Stabilization Fund's role in all this.
Also in silver, 21 non-U.S. banks are net short 19,844 COMEX contracts in the April BPR...which is down a tiny contracts 405 contracts from the 20,249 contracts that 20 non-U.S. banks were short in the March BPR. Nothing to see here, either.
I would suspect that Canada's Scotiabank/Scotia Capital holds a goodly chunk of the short position of these non-U.S. banks...including HSBC. I also suspect that a number of the remaining non-U.S. banks may actually be net long the COMEX futures market in silver. But even if they aren’t, the remaining short positions divided up between these other 19 non-U.S. banks are immaterial — and have always been so.
As of April's Bank Participation Report, 25 banks [both U.S. and foreign] are net short 34.1 percent of the entire open interest in the COMEX futures market in silver—basically unchanged from the 34.2 percent that 24 banks were net short in the March BPR. And much, much more than the lion’s share of that is held by Citigroup, HSBC USA, Goldman, maybe Bank of America -- and Scotiabank -- and possibly one other non-U.S. bank...all of which are card-carrying members of the Big 8 shorts.
Here’s the BPR chart for silver. Note in Chart #4 the blow-out in the non-U.S. bank short position [blue bars] in October of 2012 when Scotiabank was brought in from the cold. Also note August 2008 when JPMorgan took over the silver short position of Bear Stearns—the red bars. It’s very noticeable in Chart #4—and really stands out like the proverbial sore thumb it is in chart #5. Click to enlarge.
In platinum, 4 U.S. banks are net short 19,268 COMEX contracts in the April Bank Participation Report, which is virtually unchanged from the 19,222 COMEX contracts that these same banks were short in the March BPR.
[At the 'low' back in July of 2018, these U.S. banks were actually net long the platinum market by 2,573 contracts]
Also in platinum, 17 non-U.S. banks are net short 5,994 COMEX contracts in the April BPR, which is up 1,416 contracts from the 4,578 COMEX contracts that 19 non-U.S. banks were net short in the March BPR.
[Note: Back at the July 2018 low, these same non-U.S. banks were net short 1,192 COMEX contracts.]
And as of April's Bank Participation Report, 21 banks [both U.S. and foreign] are net short 37.2 percent of platinum's total open interest in the COMEX futures market, which is up from the 32.8 percent that 23 banks were net short in March's BPR.
But it's the U.S. banks that are on the short hook big time -- and the real price managers. They have little chance of delivering into their short positions, although a very large number of platinum contracts have already been delivered during the last six months, including the current April delivery month. But that fact, like in both silver and gold, has made no difference whatsoever to their short positions held. Their short positions in the COMEX futures market in this precious metal is almost equally as dire as it is in the other two precious metals.
Here's the Bank Participation Report chart for platinum. Click to enlarge.
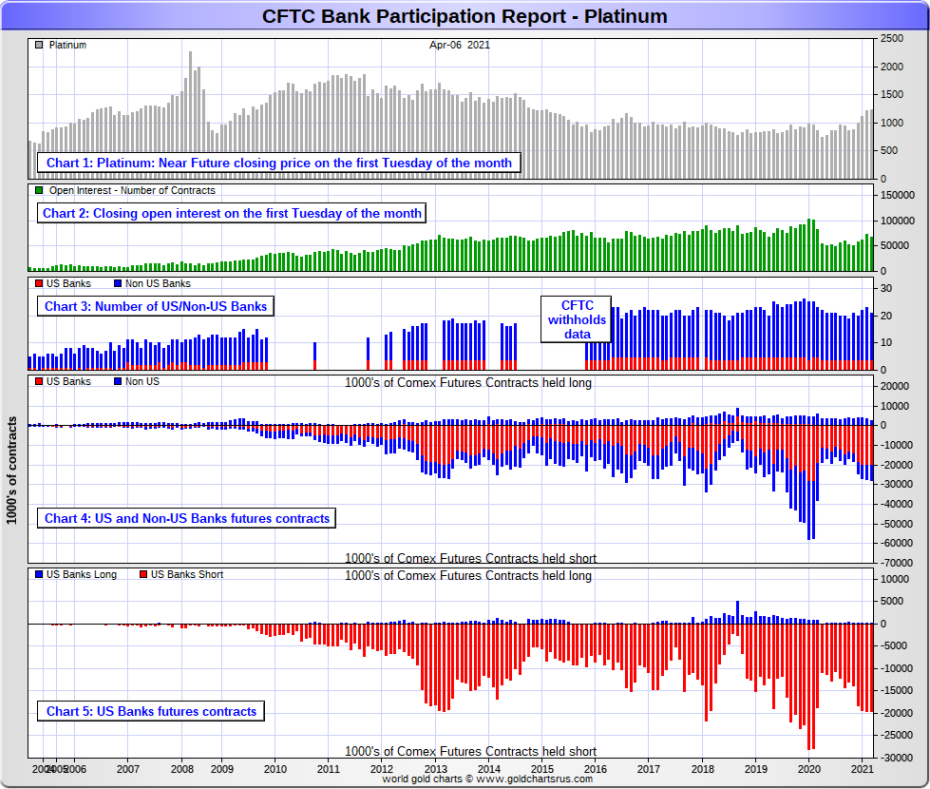
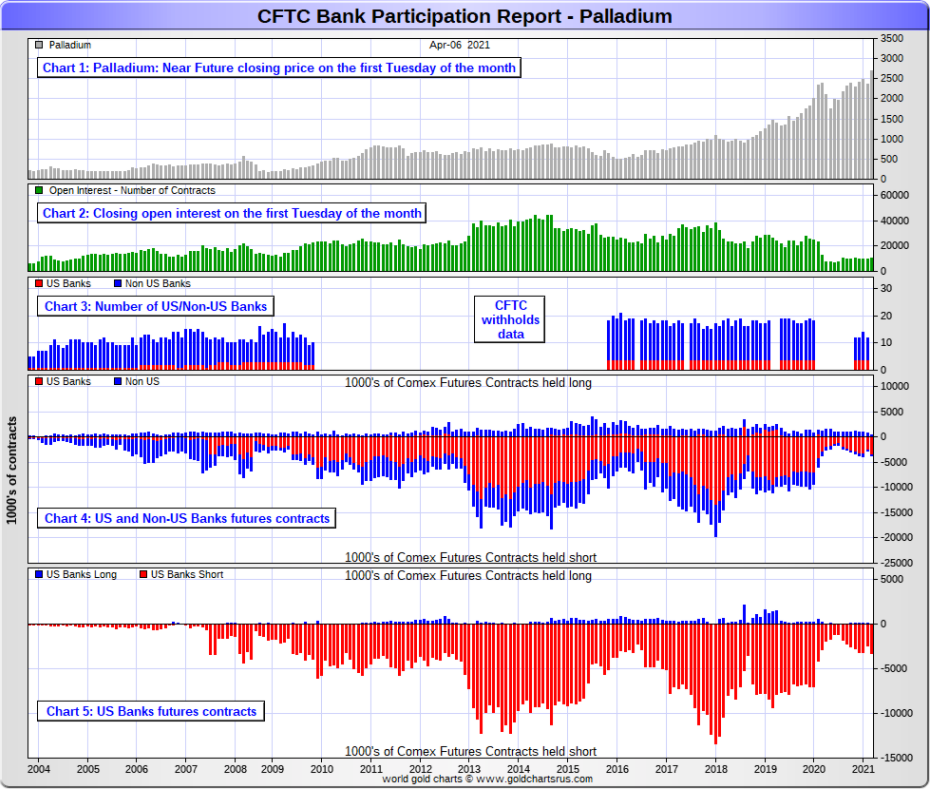
In palladium, '3 or less' U.S. banks are short 3,343 COMEX contracts in the April BPR, up a chunky 954 contracts from the 2,389 contracts that these same U.S. banks were net short in the March BPR. And I will point out here that the U.S. banks hold zero COMEX long positions in palladium, as their entire position is on the short side.
They were short only 1,194 COMEX contract in the July 2020 BPR.
Also in palladium, '10 or more' non-U.S. banks are net long 81 COMEX palladium contracts—down from the 353 contracts that these same 10 non-U.S. banks were net long in the March BPR.
These are fairly material changes in both groups of banks. Not big numbers, but it's a microscopic market to start with, so it only takes small changes to make a huge difference.
And as I've been commenting for almost forever now, the COMEX futures market in palladium is a market in name only, because it's so illiquid and thinly-traded. Its total open interest at Tuesday's cut-off was only 10,529 contracts...compared to 68,108 contracts of total open interest in platinum...154,593 in silver -- and 463,353 contracts in gold.
As of this Bank Participation Report, 13 banks [both U.S. and foreign] are net short 31.0 percent of the entire COMEX open interest in palladium...up from the 21.2 percent of total open interest that 12 banks were net short in March.
And because of the small numbers of contracts involved, along with a tiny open interest, these numbers are pretty much meaningless. So, for the last twelve months in a row, the world's banks are no longer involved in the palladium market in a material way. According to Ted, palladium is mostly a cash market now.
Here’s the palladium BPR chart. And as I point out every month, you should note that the U.S. banks were almost nowhere to be seen in the COMEX futures market in this precious metal until the middle of 2007—and they became the predominant and controlling factor by the end of Q1 of 2013. They have imploded into insignificance over the last nine or so Bank Participation Reports, although their short position has been sneaking higher for seven of the last eight months. It remains to be seen if they return as big short sellers again at some point like they've done in the past. Click to enlarge.
Except for palladium, only a small handful of the world's banks/investment house, most likely four or so in total -- and mostly U.S-based...continue to have meaningful short positions in the other three precious metals. It's a near certainty that they run this price management scheme from within their own in-house/proprietary trading desks...although its probable that they're clients are short these metals as well.
The futures positions in silver and gold that JPMorgan holds are immaterial -- and have been since March of last year. It's the next Big 8 shorts et al. that are on the hook in everything precious metals-related...but as I just mentioned, it's most likely only the Big 4 now, rather than the Big 8...as the concentration data is so stark...as per the above 'Days to Cover' chart.
But as has been the case for over a year now, the short positions held by the Big 4/8 traders/banks is the only thing that matters -- and how it is ultimately resolved [as Ted said earlier] will be the sole determinant of precious metal prices going forward.
I don't have all that many stories, articles or videos for you today.
CRITICAL READS
U.S. producer prices surge in March
U.S. producer prices increased more than expected in March, resulting in the largest annual gain in 9-1/2 years, fitting in with expectations for higher inflation as the economy reopens amid an improved public health environment and massive government funding.
The producer price index for final demand jumped 1.0% last month after increasing 0.5% in February, the Labor Department said on Friday. In the 12 months through March, the PPI surged 4.2%. That was the biggest year-on-year rise since September 2011 and followed a 2.8% advance in February.
Economists called by Reuters had forecast the PPI increasing 0.5% in March and jumping 3.8% year-on-year. The report was delayed after the Bureau of Labor Statistics’ website crashed.
The above three paragraphs are all there is to this brief CNBC article that put in an appearance on their website at 8:56 a.m. EDT on Friday morning -- and it was updated about fifteen minutes later. I thank Swedish reader Patrik Ekdahl for sending it our way -- and another link to it is here. Wolf Richter had a short 2-chart story about this headlined "Producer Prices Blow Out" -- and it's definitely worth a minute of your time -- and that comes courtesy of Richard Saler.
Higher inflation will not be "persistent"; Fed Chair Powell doubles down on outlook
At the Debate on the Global Economy hosted by the IMF this week, Fed Chair Jerome Powell once again re-iterated that he sees a temporary spike in prices, but that inflation would not be a long-term, persistent force.
"There's a difference between essentially a one-time increase in prices and persistent inflation. When we say inflation that's what we mean. We mean persistent inflation that goes up by 2% or 4% or whatever it is, year after year, and that level of inflation tends to be dictated by underlying inflation dynamics in the economy, as opposed to things like bottlenecks," Powell said.
Powell added that bottlenecks in the supply chain will be resolved, therefore, any price increase from a "temporarily tight" supply side would likely not repeat the following year.
Higher levels of inflation are not a phenomenon that advanced economies have seen over the past two decades, he added.
Well, dear reader, we're going to get it now...good and hard. This Kitco story from yesterday...a 4:40 minute video clip, now on youtube.com...was something that Patrik Ekdahl sent our way -- and another link to it is here. Gregory Mannarino's post market close rant for Friday is linked here.
Doug Noland: Keeping the Dance Party Rolling
The world is now more than a decade into the historic “global government finance Bubble.” In contrast to the previous Bubble period, government “money” (sovereign bonds and central bank Credit) has been a principal Bubble fuel. Policymakers have enjoyed incredible latitude to inflate government finance, a unique dynamic that has worked (magically) to prolong this incredible cycle. Consistent with the mortgage finance Bubble, speculative leverage has expanded momentously over the course of this cycle – to the point where it has greatly exceeded previous cycle peaks. I am convinced it has ballooned exponentially over recent years, as the incredible lengths policymakers repeatedly emboldened the speculator community were willing to go to sustain the boom.
We know equities margin borrowings have inflated parabolically (almost 50%!) over the past year to a record level. I assume a similar trajectory for levered holdings throughout the global leverage speculating community, a view supported by the egregious leverage exposed at Archegos. A guesstimate of tens of Trillions of speculative leverage having accumulated globally over this extraordinary cycle is not preposterous.
Markets, understandably, at this point are content to fixate on the stability of government monetary inflation as ensuring an irrepressible boom. At this point, “whatever it takes” central banking is a proven commodity. And now markets have grown comfortable with the notion that no amount of government debt is too large to be financed by the marketplace at low yields. This new and phenomenally powerful financial structure has demonstrated itself as robust and, to this point, essentially bulletproof. In this context, markets view Archegos and its de-leveraging as inconsequential.
It may not be immediately discernible, especially with markets towering new heights, but conditions will be tightening in leveraged securities and derivatives finance. Rising asset markets essentially create their own self-reinforcing liquidity. Yet Illiquidity Lies in Wait. It’s when markets are in retreat that liquidity issues come to the fore. It’s worth noting, however, recent underperformance by the small cap stocks, a sector especially susceptible to shifting liquidity dynamics. It also appears the game has changed for the SPAC Bubble, a sector directly financed by the leveraged speculator/prime brokerage nexus.
Mounting inflationary pressures are a global phenomenon. While the Fed has been dismissive, the prospect of an overheating U.S. economy seems clearer by the week. The Federal Reserve should begin contemplating when to signal an approaching QE tapering. Such unparalleled government monetary inflation has stoked myriad inflated price levels and distortions throughout the asset markets and real economy. Accordingly, we should expect any attempt to ween the system off QE will at this point prove highly destabilizing.
The risk of market liquidity accidents is highly elevated – and rising. Those that dispute this analysis should ponder the scenario where the leveraged speculating community and public race to the exits simultaneously: panicked speculator deleveraging and a run on the ETF complex (kind of like March 2020 but bigger). It’s not farfetched. At this point, with the Bubble inflating so late-cycle crazily, it’s not clear how such a scenario is to be avoided. And while Archegos has started the clock ticking, inebriated markets are hell-bent on Keeping the Dance Party Rolling.
Doug's weekly commentaries are always a must read for me -- and his offering this week is no exception. Another link to it is here.
Ever since assuming office, the Biden Administration has been probing countries it designated as America’s enemies for weaknesses through a variety of provocations. So far this approach has not had any successes. China plainly told Biden’s SecState Blinken to go packing, Iran is showing no eagerness to kowtow to Washington under new management, and Russia itself has stayed the course, brushing off verbal attacks and promising either in-kind or asymmetrical responses to any new chicaneries from Washington or Brussels.
That does not mean that Washington has acknowledged defeat. Unwilling to concede, it is liable to escalate a crisis situation elsewhere. Since Navalny’s perennial “poisonings”, “hunger strikes”, and “leg pains” have not had the desired effect on Western governments and his life and health are moreover quite secure in a Russian prison, so the prospect of a new war in Eastern Ukraine is back on the agenda, and the opponents of Nord Stream 2 now have two things to pray for: Aleksey Navalny’s death and a Russia-Ukraine war.
Zelensky on the Spot
The Russian government has made it clear on numerous occasions that it is adhering to the Minsk Agreements, will not abandon the Donbass, but at the same time will not escalate the situation out of the desire to minimize the damage to all concerned. In practical terms it means a continuation of “coercive diplomacy”. Russian military force will be used only if Ukraine attempts to create facts on the ground through offensive action. For that reason it is unlikely in the extreme that Russia will be the one to escalate first. It is worth remembering that both the summer 2014 campaign and the winter 2014/15 campaign were initiated by Kiev which first sent troops and bombers to suppress the then-peaceful protests against the Maidan and referenda to secede, and then to hope to quickly resolve the stalemate. Both operations ended in failure through the efforts of the hastily assembled and armed militias of the breakaway republics, with some “Northern Wind” military support that decimated Ukrainian forces.
This longish commentary/opinion piece from the southfront.org Internet site, showed up on the Zero Hedge website at 2:00 a.m. EDT on Friday morning -- and another link to it is here.
India, China ramp up gold purchases as market starts recovering from pandemic pain
The demand for physical gold increased sharply in the spring season in India, China and other Asian countries, where the precious metal’s shine is appreciated the most, Nikkei reports, citing industry data.
Statistics showed that India, one of the top gold consumers, imported 160 tons of the yellow metal in March, 5.7 times more than in the same month a year ago, when the country was under strict lock-down. Gold purchases in the country practically stopped in April and May 2020, but started growing again since the end of the year. In India, gold is a highly valued status symbol, offered at weddings and other festivities. A large part of the population keeps their savings in gold jewelry.
Purchases of jewelry were also up in China, 2.6 times year-on-year in February, data showed. The beginning of last year saw demand in the world’s biggest gold consumer tumbling to multi-year lows, again due to the coronavirus crisis.
Global demand for gold dropped to its lowest levels since 2009 in the third quarter of 2020, according to World Gold Counsel data, partly driven by dwindling demand in Asia. The pandemic has forced traditional buyers to postpone purchases and investors to ditch holdings, while lock-downs have hit the jewelry market. China and India have seen a drop in demand of 25% and 48% respectively in the first three quarters of 2020.
The above four paragraphs are all there is to this short gold-related news item that appeared on the rt.com Internet site at 9:38 a.m. Moscow time on their Friday morning, which was 2:38 a.m. in New York -- EDT plus 7 hours. I found it on Sharps Pixley -- and another link to the hard copy is here.
Papua New Guinea wins majority stake in Barrick-Zijin gold mine
Barrick Gold Corp has reached a deal that gives the Papua New Guinea government a majority share in the Porgera gold mine as part of plans to restart operations, the company said on Friday.
The deal will set a benchmark for further resources projects in the region, Prime Minister James Marape said in a statement, and help shape the terms of new developments by the likes of Australian gold miner Newcrest Mining.
Porgera has been shut for a year after a dispute over the terms of benefit-sharing between the operator, landowners and the government but the new framework pact paves the way to resume operations although it gave no time frame.
“We intend to partner with all key stakeholders to make Porgera a world-class, long-life gold mine,” Barrick Chief Executive Mark Bristow said in a statement.
This Reuters story, filed from Melbourne, was posted on their Internet site at 10:45 p.m. EDT on Thursday night -- and I found it embedded in a GATA dispatch. Another link to it is here.
The Photos and the Funnies
Continuing southbound on B.C. Highway 1 on June 28...I took the first photo from a pull-off on the highway looking generally southwest overlooking the Thompson River. The CP Rail track bed is in the foreground -- and just out of sight over the hills/mountain in the near background is the town of Lytton -- and the confluence of the Thompson and Fraser Rivers. The Northern Cascades loom large in the background. The second shot was taken from exactly the same spot, except looking in the opposite direction. Once south of Lytton, we ended up at Boston Bar, crossed the Fraser River into North Bend -- and then headed into the unknown. The wild flowers were in bloom -- and I took photos three and four within a few steps of each other -- and the CN Rail right-of-way is visible on the far left of photo four. This good quality gravel road didn't last long, as we soon found out. Click to enlarge.


The WRAP
Last week's pop 'blast from the past' was from disco era, as is this week's selection...which dates from 1979. Benny and Björn composed it...and the lead vocals were shared by Agnetha and Anni-Frid. It's the only song that this famous Swedish pop group recorded outside their home country. The link is here. It has an absolutely killer bass line to go with it -- and Rutger Gunnarsson [RIP], the group's bass player who composed it, would have been dazzled by this performance. That's linked here. Enjoy.
Today's classical 'blast from the past' is Johann Sebastian Bach's Concerto for Two Violins in D minor, BWV 1043 which he composed c. 1730 during the late baroque era. It is one of the composer's most successful works -- and most popular I might add.
This performance was recorded on 07 October 2016 in Amsterdam -- and the Netherlands Bach Society does the honours. It's an audio and visual tour de force. The link is here.
Hiding behind yet another and most-likely manufactured dollar index 'rally', the Big 4/8 shorts made sure that gold didn't trade above its 50-day moving average yesterday -- and Ted suspects that most if not all the long contracts in gold that were put on after the Tuesday cut-off, were blown out of the water yesterday. Silver came close to touching its 200-day moving average -- and was also closed lower on the day.
Platinum was forced below its 50-day moving average for a brief period on Friday, but closed above it by about fifteen bucks or so. Palladium didn't do much from a price perspective -- and I didn't detect much if any interference from the Big 8 shorts during the Friday trading session.
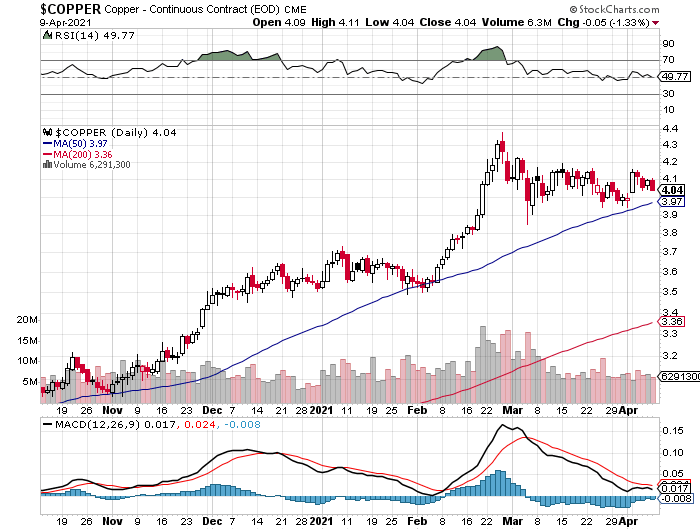
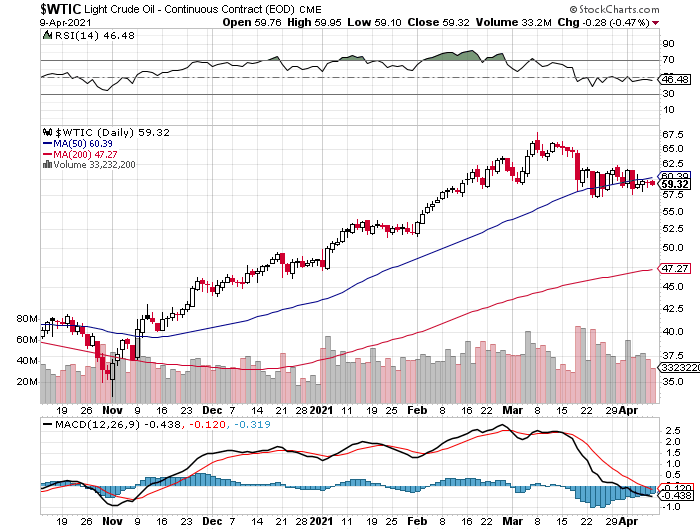
Copper closed down another 5 cents yesterday -- and in the process took back almost all of Monday's 15 cent gain. WTIC fell by another 28 cents a barrel -- and has now closed below its 50-day moving average for the last five consecutive trading days.
Gregory Mannarino is of the opinion that there will be some sort of 'false flag' event in the Middle East, probably involving Iran, that will drive WTIC substantially higher -- and considering what's going on over there, combined with the bellicose talk/activity out of the U.S., Saudi Arabia and Israel over the last few months...I wouldn't be at all surprised.
Here are the 6-month charts for the Big 6 commodities, courtesy of the stockcharts.com Internet site, so you can see yesterday's price activity for yourself. Click to enlarge.
But despite the mauling that the big shorts laid on silver and gold yesterday, their respective shares performed reasonably well -- and it was obvious that there were deep-pocket buyers picking up just about every precious metal share that was being sold in a panic during the New York trading session.
As I state in just about every Saturday column, it's apparent...at least to me...that there's been stealth accumulation going on in the precious metal equities since mid-August of last year -- and that was certainly the case yesterday, although there was nothing 'stealthy' about it.
As you already know -- and as the title to today's column already states, I was not amused to see the numbers in yesterday's COT Report, particularly in gold.
I certainly can understand it in silver to a certain extent, as it broke above and closed above its 200-day moving average. But I was not happy to see the Big 4/8 traders jump in with both feet, as there was no sign that they were about to stand back and let the price run. In fact it was the opposite.
Of course the big surprise for Ted -- and likewise myself, was the fact the Managed Money traders added to their net long position in gold with such abandon, even though no moving averages had been broken to the upside...in this case, the 50-day. Of course they're buying prompted the Big 4/8 traders to go short against them immediately in order to prevent the obvious price explosion that would have occurred if they hadn't.
To tell you the truth, I'm not sure what to make of it -- and there's no way I'm going to speculate on one week's worth of COT data, as the structure in the COMEX futures market is still extremely bullish, regardless of the increases in the commercial net short positions in both gold and silver. But I certainly don't like the trend.
Right now we seem to back in some sort of 'care & maintenance' mode -- and it will be interesting to see, as Ted pointed out on the phone yesterday, if the Big 4/8 shorts attempt to run gold and silver prices lower, in order to cover the short positions that they put on during the last reporting week. Time will tell.
But one thing is for sure -- and that is that the retail and wholesale markets are tighter than that proverbial drum, as bullion store inventories and the price spread differentials in both indicate. The situation is particularly acute in silver as everyone knows -- and that's despite the soothing words we're hearing from some quarters of the market...most recently from The Perth Mint.
And despite what Fed chairman Jay Powell is offering in the way of platitudes regarding the future outlook for inflation, it's already rampant in a lot areas -- and bound to get far, far worse as the months pass. That situation will be exacerbated by continued money printing, both in the U.S. and abroad. This is all part of the plan to inflate away the world's debts.
As I've said before -- and I'll repeat myself again here, when the precious metals are finally allowed to rise in price dramatically, it won't be happening in a news vacuum, as the powers-that-be et al. will need some sort of epic event to point to in order to cover their tracks...in the Middle East, or the Ukraine perhaps.
One or other of those...or something like it, is in the cards...although it obviously hasn't occurred yet. But it is coming.
So we wait some more.
I'm still 'all in' -- and I'll see you here on Tuesday.
Ed
About the author

SUBSCRIBE: https://edsteergoldsilver.com/

Ed Steer’s Daily Analysis of the Gold and Silver Markets
After eight years of writing about the precious metals for Casey Research, the folks at Stansberry & Associates—who just recently purchased controlling interest in the company—decided that my ‘niche market’ column didn’t fit into their plans.
Since the time that Casey Research was kind enough to offer me a stand-alone column, it became their most highly-rated blog almost from the outset—and has remained that way up to this date...