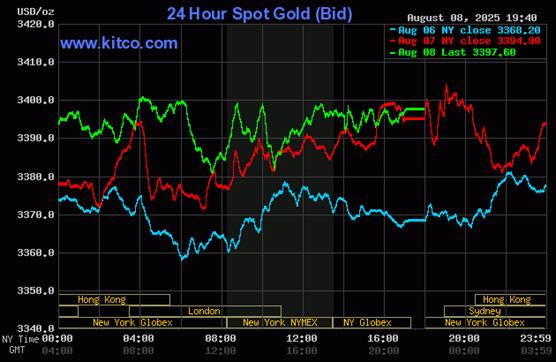
There's not much to say about gold's price action in the spot market yesterday, except to note that every attempt by 'da boyz' to break it below $3,380 spot was well bought -- and every attempt to break above $3,400 spot was well defended. However, it was far different in the future months. Gold had an intraday move of $26.90 in the spot market on Friday...but it was a far different kettle of fish in the future months.
The high and low ticks in gold were reported by the CME Group as $3,503.70 and $3,418.00 in the October contract -- and $3,534.20 and $3,445.00 in December...a monster intraday move of $89.10 an ounce in the latter. The August/October price spread differential in gold at the close in New York yesterday was $23.90...October/December was $28.30 -- and December/ February26 was $26.90 an ounce.
Gold was closed on Friday afternoon in New York at $3,397.60 spot...up $3.10 on the day -- and $7.80 off its Kitco-recorded high tick. Net volume was absolutely enormous at around 233,500 contracts -- and there were a very heavy 90,500 contracts worth of roll-over/switch volume on top of that...very unusual to say the least.
I saw that an eye-watering 7,257 gold contracts were traded in August yesterday, but only 54 contracts in silver. It nearly goes without saying that tonight's Daily Delivery and Preliminary Reports will be of more than passing interest.
![]()
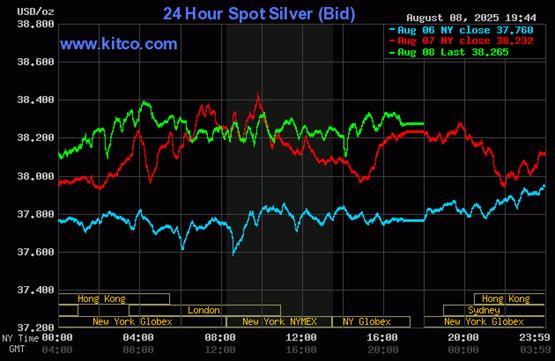
The silver price crept a tad higher until it was sold lower starting around 7:45 p.m. EDT on Thursday evening in New York -- and that lasted until minutes before 10 a.m. in Shanghai on their Friday morning. Its ensuing quiet and choppy rally ran into 'something' around 9:10 a.m. in Globex trading in London -- and was sold a bit lower until 11:45 a.m. BST. From that point it was forced to chop very quietly sideways -- and in a very tight range until the market closed at 5:00 p.m. EDT in New York.
The low and high ticks in silver were recorded as $38.875 and $38.18 in the September contract ...an intraday move of 69.5 cents. The September/ December price spread differential in silver at the close in New York yesterday was 50.3 cents -- and December/March26 was 48.4 cents an ounce.
Silver was closed in New York on Friday afternoon at $38.265 spot...up 3 cents from Thursday. Net volume was not at all heavy at 52,000 contracts -- and there were around 27,700 contracts worth of roll-over/switch volume out of September and into future months in this precious metal...mostly into December of course, but with noticeable amounts into March and May26 as well.
![]()
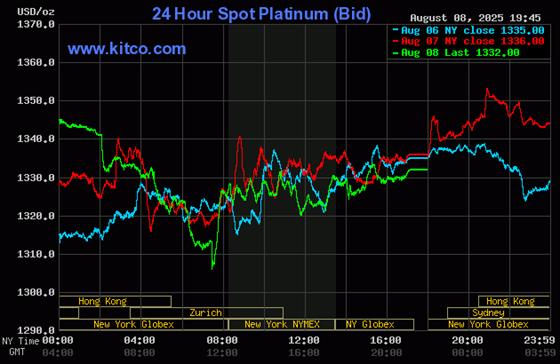
'Da boyz' stepped on platinum's rally a couple of minutes before Shanghai opened at 9:00 a.m. CST on their Friday morning -- and by the time they were done with it, they had it down 30 bucks from its close on Thursday. Its sharp rally from its 1:20 p.m. CEST low tick in Zurich got smacked minutes before 2 p.m. CEST/8 a.m. in New York -- and it then struggled quietly higher until trading ended at 5:00 p.m. EDT. Platinum was closed at $1,332 spot...down 4 dollars on the day -- and 21 bucks off its Kitco-recorded high tick.
![]()
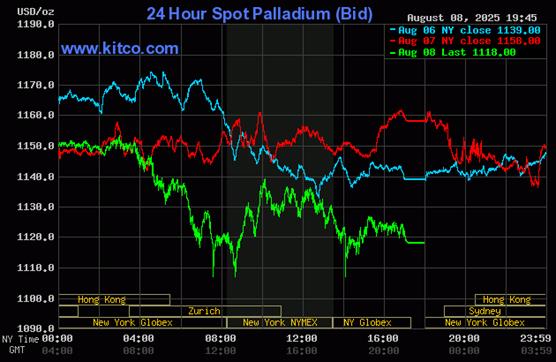
Palladium was sold/engineered two very broad steps lower until its low tick was set around 1:30 p.m. in Globex trading in Zurich on their Friday afternoon...a price it revisited twice more after that during the New York trading session. It was allowed to close just off its low, at $1,118 spot...down 40 bucks from Thursday -- and 12 dollars off its Kitco-recorded low tick.
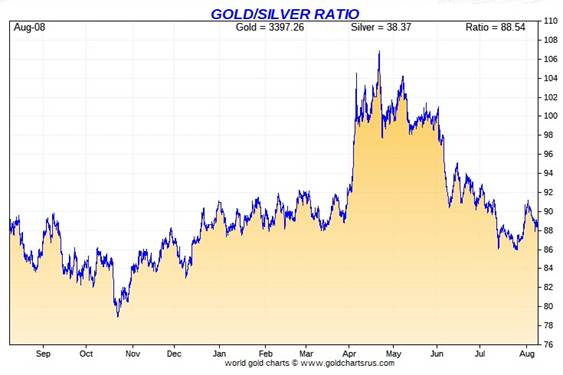
Based on the kitco.com spot closing prices in silver and gold posted above... the gold/silver ratio worked out to 88.8 to 1 on Friday...unchanged from Thursday.
Here's Nick's 1-year Gold/Silver Ratio chart, updated with this past week's data. Click to enlarge.
![]()
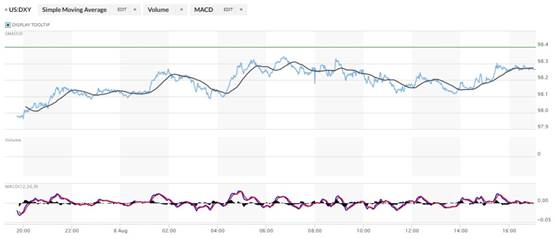
The dollar index was marked-to-close on Thursday afternoon in New York at 98.40 -- and then opened lower by 42 basis points once trading commenced at 7:45 p.m. EDT on Thursday evening...which was 7:45 a.m. China Standard Time on their Friday morning. It then took three broad and uneven steps higher until its high tick was set at 11:45 a.m. in London -- and from that juncture it chopped quietly lower until around 1:43 p.m. in New York. It then chopped a tad higher until 3:30 p.m. -- and didn't do much of anything after that.
The dollar index was marked-to-close on Friday afternoon in New York at 98.18...down 22 basis points on the day -- and 9 basis points below its indicated close on the DXY chart below.
Here's the DXY chart for Friday...thanks to marketwatch.com as usual. Click to enlarge.
![]()
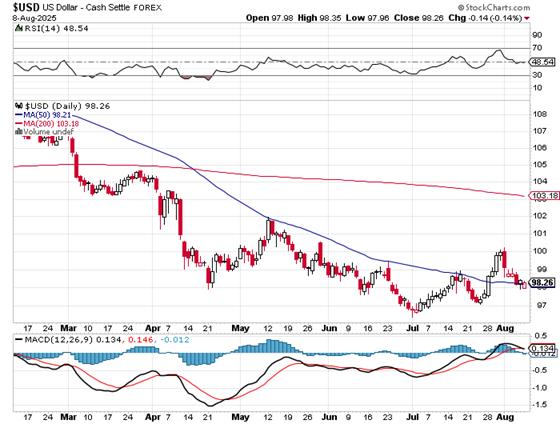
Here's the 6-month U.S. dollar index chart...courtesy of stockcharts.com as always. The delta between its close...98.26...and the close on DXY chart above, was 8 basis points above that. Click to enlarge.
![]()
U.S. 10-year Treasury: 4.2850%...up 0.0410/(+0.9661%)...as of the 1:59:54 p.m. CDT close
The ten-year finished the week up only 6.5 basis points from its close a week ago on Friday, August 1 -- and that's despite the ugly 3-year, 10-year and 30-year treasury auctions this past week. So it's more than obvious that the Fed and maybe other central banks as well, had to have been big buyers to keep the yields down.
Here's the 5-year 10-year U.S. Treasury chart from the yahoo.com Internet site -- which puts the yield curve into a somewhat longer-term perspective. Click to enlarge.
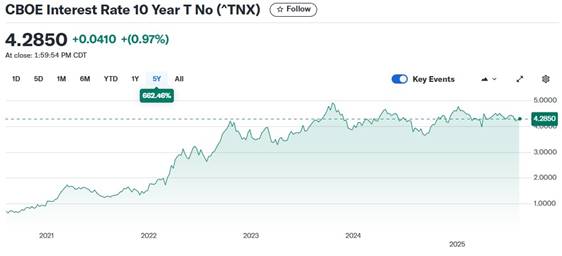
As I continue to point out in this spot every week, the 10-year hasn't been allowed to trade above its 4.92% high tick set back on October 15, 2023 -- and it's more than obvious from the above chart that it will he held at something under 5% until further notice. The word on the street is that a 25 basis point cut in the Fed's fund rate is in the cards for the September FOMC meeting.
![]()
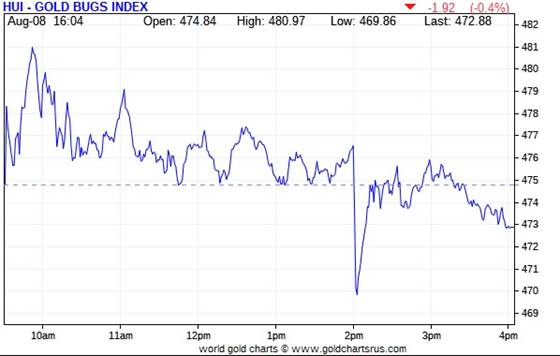
The gold stocks jumped up a bit at the 9:30 opens of the equity markets in New York on Friday morning -- and their respective highs were set around 9:50 a.m. EDT. They began to chop lower from there until a 'fat finger' trade or a computer algorithm went wild at precisely 2:00 p.m. -- and their low ticks were set a few minutes later. They recovered quickly until exactly 3 p.m. -- and then continued to chop quietly lower until trading ended at 4:00 p.m. EDT. The HUI closed down 0.40 percent.
![]()
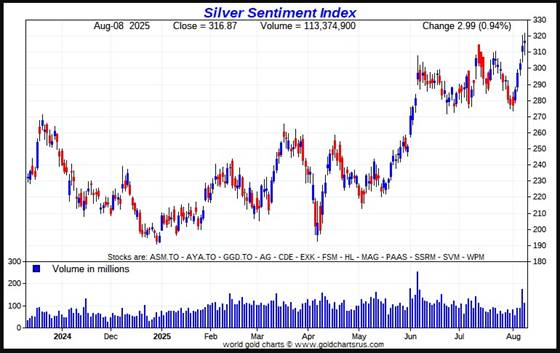
The silver equities performed in a similar fashion as the gold shares on Friday...sans the 'fat finger' trade at 3 p.m. EDT. Nick Laird's Silver Sentiment Index managed to close up 0.94 percent -- and at another new high going back to May of 2021. Click to enlarge.
![]()
The two stars yesterday were Fortuna Mining and Hecla Mining, closing higher by 5.95 and 5.35 percent respectively. The hound was Silvercorp Metals, as it got hit by 6.43 percent, as Mr. Market obviously didn't care for its Q2/2025 numbers that came out after the market closed on Thursday.
I didn't see news yesterday on any of the thirteen silver companies that comprise the above Silver Sentiment Index.
In the interest of full disclosure, I purchased a position in Pacifica Silver Corp yesterday...a micro cap silver exploration company in Mexico...ticker symbol: PSIL.CN here in Canada that's only been trading for a few days. From what I've been told, it's not even listed on any U.S. exchange as of yet Their website remains a work in progress, but the salient bits about the company are linked here.
The silver price premium in Shanghai over the U.S. price on Friday was 4.14 percent.
The reddit.com/Wallstreetsilver website, now under 'new' and somewhat improved management, is linked here. The link to two other silver forums are here -- and here.
![]()
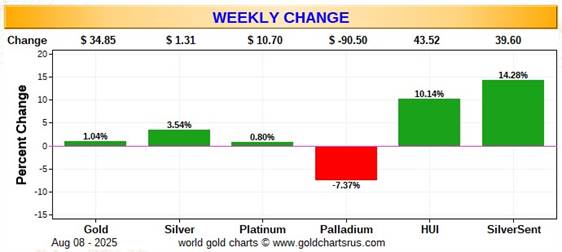
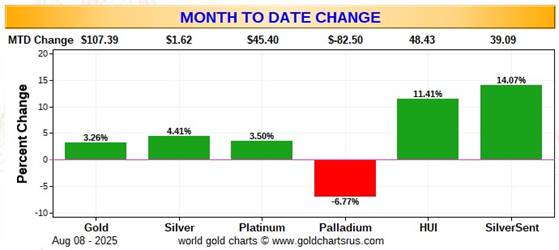
Here are the usual three charts that appear in this spot in every weekend missive. They show the changes in gold, silver, platinum and palladium in both percent and dollar and cents terms, as of their Thursday closes in New York — along with the changes in the HUI and the Silver Sentiment Index.
Here's the weekly chart -- and after the rallies we've had all week, it's a sight to see...with the gains in the equities far outperforming the gains allowed in their underlying precious metals. We'll take it! Click to enlarge.
Here's the month-to-date chart...the above weekly chart, plus one day, last Friday, August 1 -- and there's not a lot of difference between it and the weekly chart above. Click to enlarge.
Here's the year-to-date chart -- and it's a lovely shade of green across the board. Thanks to 'da boyz' the silver equities are lagging -- despite the fact that silver the metal is outperforming gold by a bit. Click to enlarge.
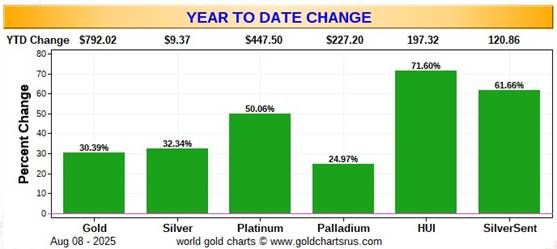
Of course -- and as I also point out in this spot every Saturday -- and will continue to do so...is that if the silver price was sitting close to a new all-time high of 'whatever' dollars an ounce, like gold is sitting at its current price of $3,397 spot -- and within three percent of its all-time high... it's a given that the silver equities would be outperforming their golden cousins...both on a relative and absolute basis -- and by an absolute country mile...or two. That day, as I also keep mentioning, lies in our future...somewhere.
![]()
The CME Daily Delivery Report for Day 8 of August deliveries showed that an expected and monstrous 3,986 gold -- plus 37 silver contracts were posted for delivery within the COMEX-approved depositories on Tuesday.
In gold, the only three short/issuers that mattered were British bank Standard Chartered, Deutsche Bank and British bank HSBC...issuing 1,926...1,695 and 300 contracts respectively... HSBC from its client account.
There were six long/stoppers of note...with JPMorgan being the largest, picking up 1,748 contracts for its 'client' account...followed by Wells Fargo Securities and Canada's Scotia Capital/Scotiabank, stopping 732 and 721 contracts for their respective house accounts. After them came Australia's Macquarie Futures, Canada's RBC [Royal Bank of Canada] Capital Markets -- and British bank Barclays...picking up 313, 266 and 183 contracts respectively -- and all for their respective client accounts.
In silver, the only short/issuer that mattered was British bank HSBC, issuing 36 contracts out of its client account. The only two of the six long/stoppers that mattered were ADM and Wells Fargo Securities, picking up 24 and 7 contracts respectively...ADM for clients.
The link to yesterday's Issuers and Stoppers Report is here.
Month-to-date there have been an enormous 26,615 gold contracts issued/reissued and stopped already -- and that number in silver is 1,687 contracts. In platinum it's 1,120 contracts -- and in palladium it's 153. I'll have more on this in The Wrap.
The CME Preliminary Report for the Friday trading session, showed that gold open interest in August increased by 1,480 COMEX contracts, leaving 5,332 still around...minus the 3,986 contracts out for delivery on Tuesday, as mentioned a bunch of paragraphs ago. Thursday's Daily Delivery Report showed that 844 gold contracts were actually posted for delivery on Monday, so that means that 1,480+844=2,324 more gold contracts were added to the August delivery month.
Silver o.i. in August fell by 142 COMEX contracts, leaving just 50 left...minus the 37 contracts out for delivery on Tuesday as per the above Daily Delivery Report. Thursday's Daily Delivery Report showed that 179 silver contracts were posted for delivery on Monday, which means that 179-142=37 more silver contracts were added to August deliveries -- and it's guaranteed that those are the same 37 contracts out for delivery on Tuesday.
Total gold open interest on Friday rose by 9,077 COMEX contracts -- but total silver o.i. decreased by a net 900 contracts...another very counterintuitive number in silver...one of many we've seen since First Day Notice. I have more on this in The Wrap.
[I checked the final total open interest numbers for the Thursday trading session -- and they showed a downward adjustment in gold, thankfully...from +15,203 contracts, down to +12,527 contracts. Total silver o.i. also decreased...from -2,073 contracts, down -2,604 contracts. The fact that silver o.i. was down on Thursday was wildly counterintuitive considering its rally -- and the fact that it decreased even more in the final report, is even more hinky.]
Gold open interest in September increased by a net and further 308 contracts yesterday, leaving 6,526 contracts still open. This number is also subject to revision in the final report from the CME Group -- and Thursday's 250 contract increase was cut by a whole bunch.
![]()
There was a deposit into GLD on Friday, as an authorized participant added 17,419 troy ounces of gold. But according to Nick's data, an incredible 158,013 troy ounces of gold were added to GLDM. I asked him if this was correct -- and he said that it was. There were a hefty 3,905,500 troy ounces of silver were withdrawn from SLV -- and whether that silver was removed because it was needed elsewhere, or was the result of a conversion of SLV shares into physical metal, is impossible to tell.
The SLV borrow rate started the Friday session at 0.74% -- and finished it at 0.93%... with only 500,000 shares still available...down from the 1.7 million that were available for shorting at the start of the day. The GLD borrow rate started the day at 0.54% -- and closed at 0.55%...with 4.1 million shares available.
In other gold and silver ETFs and mutual funds on Earth on Friday...net of any changes in COMEX, GLD, GLDM and SLV activity, there were a net 83,671 troy ounces of gold added -- and a net 1,243,117 troy ounces of silver were added as well.
And still nothing from the U.S. Mint yesterday -- and nothing month-to-date, either.
![]()
The only activity in gold over at the COMEX-approved depositories on the U.S. east coast on Thursday were the 83,719 troy ounces shipped out of Brink's, Inc.
There was big paper activity, as 120,566.250 troy ounces/3,750 kilobars were transferred from the Eligible category and into Registered over at Brink's, Inc. -- and no doubt going out for immediate delivery. The remaining 8,013 troy ounces were transferred from the Registered category and back into Eligible over at JPMorgan.
The link to all of Thursday's COMEX gold action is here.
In silver, there were 476,775 troy ounces dropped off at CNT -- and 106,268 troy ounces departed Brink's, Inc. There was no paper activity -- and the link to this is here.
The Shanghai Futures Exchange reported that a net 258,783 troy ounces of silver were added to their inventories on Friday...which now stands at 37.243 million troy ounces.
Although I don't have room for the charts in today's column, Nick passed around the ones showing the amount of gold and silver that were withdrawn from the Shanghai Gold Exchange -- and updated with July's data.
During that month they reported that 93.497 tonnes/3.006 million troy ounces of gold were taken out...along with 107.565 tonnes/3.458 million troy ounces of silver. I'll have the charts for you in Tuesday's missive.
![]()
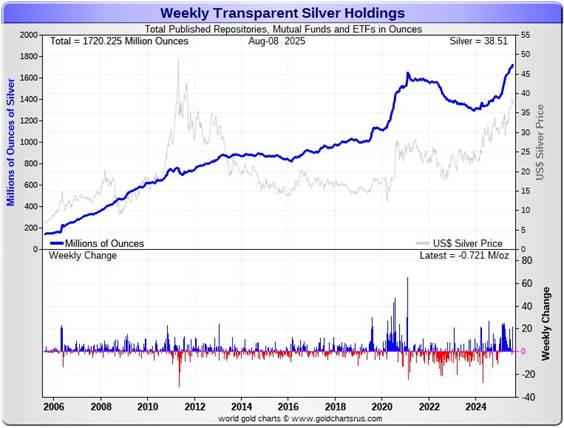
Here are the usual 20-year charts that show up in this space in every weekend column. They show the total amounts of physical gold and silver held in all known depositories, ETFs and mutual funds as of the close of business on Friday.
During the business week just past, there were a net 449,000 troy ounces of gold added... and all of that went into the COMEX -- and was mostly related to the August delivery month. but a net 721,000 troy ounces of silver were withdrawn -- and that's entirely because of that 3.905 million ounces withdrawn from SLV on Friday. Click to enlarge.
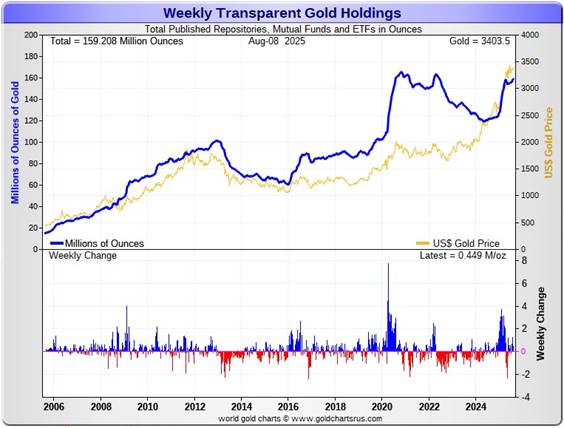
According to Nick Laird's data on his website, a net 3.249 million troy ounces of gold were added to all the world's known depositories, mutual funds and ETFs during the last four weeks -- with the largest 'in' amount by far being the 1.836 million troy ounces added to the COMEX. There were no large withdrawals to speak of.
As I continue to point out in this space, despite the fact that we're well north of $3,000 in gold -- and have been in record high price territory for a very long while now, the amount of gold held by all the world's mutual funds, depositories and ETFs is still a bit below its all-time high set back in late 2020.
However, it should be also be carefully pointed out that despite the fact that silver is a very long way from its previous $50 nominal high of April 2011...the amount of silver held in all these depositories, ETFs and mutual funds is now a noticeable amount above its old all-time high inventory level of January 2021.
And here's another thing that I notice in Nick's weekly data every Friday. Except for the odd week here and there, there have been 27 almost consecutive weeks/6+ months of net silver inflows into all the world's depositories, ETFs and mutual funds. As I keep saying in this space, there are obviously some deep-pocket silver stackers out there that know what we know -- and probably know more than we know as well.
A net 12.131 million troy ounces of silver were added during that same 4-week time period... with the largest net 'in' amount being the 9.869 million troy ounces added to the COMEX... followed by the 2.637 million troy ounces added into Aberdeen's various silver ETFs. In third spot was ZKB, taking in 1.267million troy ounces.
Retail bullion sales remain somewhat above moribund -- and U.S. Mint sales remain the poster children for that, as mentioned earlier. It remains a buyer's market for physical at the retail level for the moment -- and why that's so, is still a mystery. John Q. Public is nowhere in sight -- although the big institutional investors are certainly starting to make their presence felt...silver in particular.
At some point there will be ever larger quantities of silver and gold required by all the rest of these ETFs and mutual funds once serious institutional buying really kicks in -- and there have been significant signs of that across the board in silver over the last month...although its been very spotty in gold, because it's been trading mostly sideways since April.
However, the really big buying lies ahead of us when the silver price is finally allowed to rise substantially, which I'm sure is something that the powers-that-be in the silver world are more than aware of -- and it appears that $39 is a line in the sand at the moment, although only temporarily, I'm sure.
And as Ted Butler stated some time ago now, it stands to reason that JPMorgan has parted with a large portion of the one billion troy ounces that they'd accumulated since the drive-by shooting that commenced at the Globex open at 6:00 p.m. EDT on Sunday, April 30, 2011.
It's pretty much a given that most of the silver flown into the COMEX from London so far this year came from their stash. I'm sure they've been supplying the silver that's flowing into the rest of world's ETFs and mutual funds too...including what's been going into the COMEX, SLV, Aberdeen, and ZKB -- and others over the last four weeks.
Little has changed from last week, as the physical demand in silver at the wholesale level continues very strong -- and COMEX silver deliveries have been huge all year...including the current delivery month...August...where 8.435 million troy ounces have been issued and stopped on the COMEX so far. The amount of silver being physically moved, withdrawn, or changing ownership remains very elevated -- and that's certainly been true of SLV this past month or so...especially the last two weeks.
New silver has to be brought in from other sources [JPMorgan in London] and elsewhere to meet the ongoing demand for physical metal...as the metal currently sitting in New York is obviously already spoken for and not for sale. This demand will continue until available supplies are depleted...which will most likely be the moment that JPMorgan & Friends stop providing silver to feed this deepening structural deficit, now well into its fifth year according to the ongoing reports from The Silver Institute.
The vast majority of precious metals being held in these depositories are by those who won't be selling until the silver price is many multiples of what it is today.
Sprott's PSLV is the third largest depository of silver on Planet Earth with 194.3 million troy ounces...unchanged from last week -- and now a great distance behind the COMEX, now the largest silver depository, where there are 506.5 million troy ounces being held...down about 200,000 troy ounces this past week...but minus the 103 million troy ounces being held in trust for SLV by JPMorgan.
That 103 million ounce amount brings JPMorgan's actual silver warehouse stocks down to around the 107 million troy ounce mark...quite a bit different than the 210.3 million they indicate they have...unchanged for the last four weeks in a row.
PSLV remains a very long way behind SLV as well -- as they are now the second largest silver depository after the COMEX, with 482.0 million troy ounces as of Friday's close...down 2.1 million ounces from last week.
The latest short report [for positions held at the close of business on Tuesday, July 15] showed that the short position in SLV rose by a further 9.58%...from the 44.23 million shares sold short in the prior report...up to 48.46 million shares in this past Thursday's report...9.01 percent of total SLV shares outstanding. This amount remains grotesque, obscene -- and fraudulent beyond description...as there is no physical silver backing any of it as the SLV prospectus requires.
BlackRock issued a warning several years ago to all those short SLV that there might come a time when there wouldn't be enough metal for them to cover. That would only be true if JPMorgan decides not to supply it to whatever entity requires it...which is most certainly a U.S. or U.K. bullion bank, or most likely more than one.
The next short report...for positions held at the close of trading on Thursday, July 31...will be posted on The Wall Street Journal's website on Monday evening EDT on August 11.
Then there's that other little matter of the 1-billion ounce short position in silver held by Bank of America in the OTC market...with JPMorgan & Friends on the long side. Ted said it hadn't gone away -- and he'd also come to the conclusion that they're short around 25 million ounces of gold with these same parties as well.
The latest OCC Report for Q1/2025 came out about six weeks ago ago now -- and it showed that the precious metal derivatives held by the four largest U.S. banks only increased by around $20 billion/3.90% from Q4/2024.
JPMorgan's precious metals derivatives rose from $287.0 billion, up to $323.5 billion in Q1/2025...whereas Citigroup's fell from $163.4 billion...down to $142.8 billion. BofA's rose from $57.7 billion, up to $61.7 billion -- and the derivatives position held by Goldman Sachs is a piddling and immaterial $269 million -- down from the $350 million held in Q4/2024.
But with JPMorgan holding 61% of all the precious metals derivatives... Citibank holding 27% -- and Goldman about 10% of the total of the four reporting banks, it's only the first two banks that matter.
However, as I keep pointing out in this spot every weekend, the OCC indicator is flawed for two very important reasons, as way back 10-15 years ago, this report used to include the top dozen or so U.S. banks -- and included the likes of Wells Fargo and Morgan Stanley, amongst others...that are card-carrying members of the Big 8 shorts. Now the list is down to just four banks ...so a lot of data is hidden...which is certainly the reason why the list was shortened. On top of that, the list doesn't include the non-U.S. banks that are members of the Big 8 shorts: British, French, German, Canadian -- and Australian.
![]()
The Commitment of Traders Report, for positions held at the close of COMEX trading on Tuesday, showed the hoped-for big drop in the Commercial net short position in silver -- and an increase in the commercial net short position in gold.
In silver, the Commercial net short position fell by 6,701 COMEX contracts... 33.505 million troy ounces of the stuff -- but only about two thirds of that amount was a drop in the short position of the Big 8 traders. The rest was long-buying by Ted's raptors, the other small commercial traders.
They arrived at that number through the sale of 532 long contracts...but bought back 7,233 short contracts -- and it's the difference between those two numbers that represents their change for the reporting week.
Under the hood in the Disaggregated COT Report, it was all Managed Money traders -- and then some, as they decreased their net long position by a hefty 13,201 COMEX contracts. This meant that in order to balance things out, the Other Reportables and Nonreportable/small traders had have been buyers during the reporting week -- and they were. The former increased their net long position by 4,452 COMEX contracts -- and the latter by 2,048 contracts.
Doing the math: 13,021 minus 4,452 minus 2,048 equals 6,701 COMEX contracts...the change in the Commercial net short position.
The Commercial net short positionin silver now stands at 72,228 COMEX contracts/361.140 million troy ounces, down those 6,701 contracts from the 78,929 COMEX contracts/394.645 million troy ounces that they were short in last Friday's COT Report -- but still very bearish.
The Big 4 shorts decreased their net short position by 4,104 COMEX contracts ...from 58,933 contracts, down to 54,829 contracts...their smallest short position since May 30.
The Big '5 through 8' shorts decreased their net short position as well...but only by 239 contracts...from the 22,654 contracts in last Friday's COT Report, down to 22,415 contracts in yesterday's COT Report.
The Big 8 shorts in total decreased their overall net short position from 81,587 contracts, down to 77,244 COMEX contracts week-over-week...a drop of 4,343 COMEX contracts.
But since the Commercial net short position fell by 6,701 contracts in yesterday's COT Report -- and the Big 8 only decreased their net short position by 4,343 contracts, this meant that Ted's raptors...the small commercial traders other than the Big 8...had to have been buyers during the reporting week -- and they were...for the third week in a row...increasing their net long position by a further 6,701-4,343=2,358 COMEX contracts. They are now net long silver by 5,016 COMEX contracts.
Here's Nick's 9-year COT chart for silver -- updated with the above data. Click to enlarge.
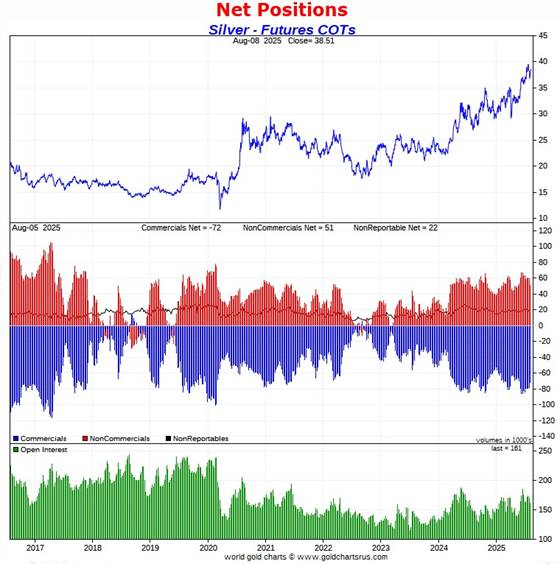
So it was the Managed Money traders that were the monster long sellers during the reporting week -- and every other group of traders...commercials and non-commercials alike...were scarfing up everything they were dumping.
We ended up getting the positive surprise in silver that I was hoping to see. But as impressive as the 6,701 contract drop in open interest was...2,358 contracts/35.2% of that amount was long-buying by Ted's raptors, the small commercial traders other than the Big 8...which is only a mathematical decrease.
The big decrease was in the Big 4 category...down 4,104 contracts -- and if you remember from the July 15 COT Report, there was that hinky drop of 3,900 contracts in the Big '5 through 8' category, which I stated at the time looked like a stage-managed event.
Overall, the short position of the Big 8 commercial traders in silver remains off-the-charts bearish from a COMEX futures market perspective. They would have to cover 30,000 contracts of their short position to get back to being bullish -- and that just ain't going to happen...especially with Ted's raptors front-running them every chance they get.
The Big 8 are short 47.9 percent of total open interest in the COMEX futures market...exactly unchanged from what they were short in last week's COT Report -- and only unchanged because of the 9,067 contract drop in total open interest, which obviously affects the calculation.
But nothing has changed with regards to that ongoing and deepening structural deficit in the physical market...which is now well into its fifth consecutive year according the Silver Institute.
Of course not to be forgotten -- and which also has a huge and negative impact on the silver price, is the outrageous and grotesque short position in SLV...now up to 48.46 million shares/troy ounces...9.01% of the total shares outstanding...as of the most recent short report that came out ten days ago. Not one of those ounces sold short has any physical silver backing it as their prospectus requires. What would the silver price be if those short SLV had to go into the open market and buy the physical metal to back those shares?
The next short report, for positions held at the close of COMEX trading on Thursday, July 31 will be posted on the WSJ's website Monday evening, August 11.
![]()
In gold, the commercial net short position increased by 11,067 COMEX contracts...1.107 million troy ounces of the stuff.
They arrived at that number through the sale of 5,018 long contracts -- and also sold 6,049 short contracts. Its the sum of those two numbers that represents their change for the reporting week.
Under the hood in the Disaggregated COT Report, the Managed Money traders increased their net long position by a healthy 19,731 COMEX contracts...which meant that the other two categories had to have been net sellers -- and they were. The Other Reportables reduced their net long position by 6,277 contracts -- and the Nonreportable/small traders by 2,387 COMEX contracts.
Doing the math: 19,731 minus 6,277 minus 2,387 equals 11,067 COMEX contracts...the change in the commercial net short position.
The commercial net short position in gold now sits at 270,146 contracts/ 27.015 million troy ounces of the stuff, up those 11,067 contracts from the 259,079 contracts/25.908 million troy ounces they were short in last Friday's COT Report...which is bearish, bordering on very bearish.
The Big 4 shorts in gold increased their net short position by a hefty 12,641 contracts this reporting week...from the 142,037 contracts they were short in the last COT report, up to 154,678 contracts in yesterday's report...but still well below the obscene 198,271 contracts there were net short in the January 21 COT Report.
The Big '5 through 8' shorts also increased their net short position...from the 84,154 contracts they were short in the last COT Report, up to 92,627 contracts held short in the current report...an increase of 8,473 COMEX contracts.
The Big 8 short position rose from 226,191 COMEX contracts/22.619 million troy ounces in the last COT Report...up to 247,305 contracts/24.731 million troy ounces in yesterday's report... an increase of 21,114 COMEX contracts.
But since the commercial net short position only increased by 11,067 COMEX contracts during the reporting week -- and the Big 8 commercial short position increased by 21,114 COMEX contracts, that meant that Ted's raptors...the small commercial traders other than the Big 8...had to have been big buyers during the reporting week. They were -- and for the second week in a row...decreasing their short position by 21,114-11,067=10,047 COMEX contracts.
The raptor short position is now down to a still ugly 22,841 contracts...from the 32,888 contract short position they held in last Friday's COT Report -- and now even further below the obscene 76,723 contracts they were short back on February 14.
Here's Nick's 9-year COT chart for gold -- and updated with the above data. Click to enlarge.
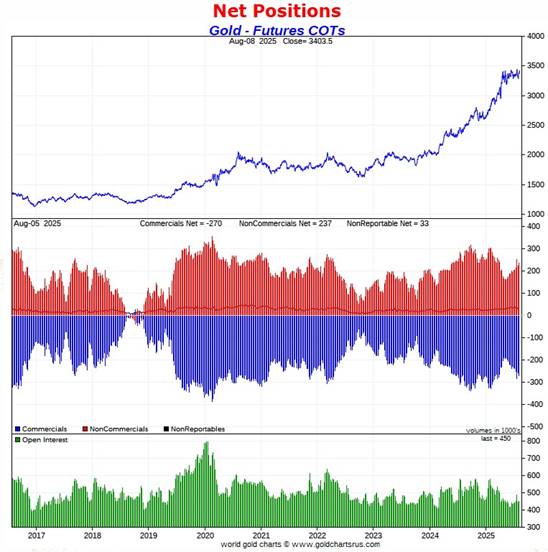
So, with the Managed Money traders going mega long by 19,731 contracts -- plus Ted's raptors buying 10,047 long contracts on top of that, it was up to the Big 8 collusive commercial shorts to fall on their collective swords to prevent the gold price from blowing sky high -- and that's precisely what they did as short sellers of last resort.
From a COMEX futures market perspective, the set-up in gold remains bearish, to very bearish.
The Big 8 collusive traders in gold are short 55.0 percent of total open interest in the COMEX futures market...up from the 50.8 percent they were short in last Friday's COT Report -- and for obvious reasons.
But once you add in the considerable short position of Ted's raptors...22,841 contracts... the commercial net short position in gold...all held by the collusive bullion banks and commodity trading houses, et al...now represents 60.0% of total open interest...up from the 58.2% of total open interest they were short in last Friday's COT Report. This, like the silver number, is an obscene and manipulative amount.
As it has been for 50 years, the short positions of the collusive commercial traders remains the cork in the bottle -- and standing in the way of their actual free-market prices which, in the case of silver, is some rather spectacular 3-digit number.
As I pointed out in The Wrap in a recent column, the unbooked margin call losses of the shorts in gold and silver is somewhere in the neighbourhood of $50 billion -- and despite that fact, there has been no big rush to cover any of their short positions in either gold or silver. This is particularly true of the thousands of small traders other the the Big 8 shorts.
![]()
In the other metals, the Managed Money traders in palladium increased their net short position by by 638 COMEX contracts -- and are net short palladium by 2,039 contracts. As to why they're short this precious metal, I have no idea. The commercial traders in the Swap Dealers category are net long palladium by 3,038 contracts...while the traders in the Producer/ Merchant category are net short 2,337 COMEX contracts. The traders in the Other Reportables and Nonreportable/ small trader categories are both net long palladium by a bit.
And it shouldn't be forgotten that the world's banks remain net long 3.7 percent of total open interest in palladium in the COMEX futures market as of the August Bank Participation Report that came out yesterday...down from the 6.5 percent they were net long in the July BPR. They've sold a lot of long contracts in their attempt to squelch its recent short covering rally.
In platinum, the Managed Money traders decreased their net long position by 4,458 COMEX contracts during the reporting week -- but remain net long platinum by 10,641 COMEX contracts.
The commercial traders in the Producer/Merchant category are net short 19,448 COMEX contracts -- and the Swap Dealers in the commercial category remain on the short side by 3,004 contracts in yesterday's COT Report...after being net long 3,117 contracts just three weeks ago...so they've been aggressively selling into platinum's big rally. The traders in the Other Reportables category are net long platinum by 6,021 COMEX contracts...while the Nonreportable/small traders are net long 6,337 contracts.
It's mostly the world's banks in the Producer/Merchant category that are 'The Big Shorts' in platinum in the COMEX futures market, as per August's Bank Participation Report that came out yesterday...but have actually decreased their short position in platinum by a bit since the July report.
In copper, the Managed Money traders decreased their net long position by a not surprising and whopping 18,411 contracts because of the 20% drop in its price on that tariff issue -- but remain net long copper by 18,249 COMEX contracts...about 456 million pounds of the stuff as of yesterday's COT Report ...down big from the 916 million pounds they were net long copper in last Friday's COT report.
Copper, like platinum and palladium, continues to be a wildly bifurcated market in the commercial category. The Producer/Merchant category is net short 45,947 copper contracts/1.148 billion pounds -- while the Swap Dealers are net long 13,185 COMEX contracts/329 million pounds of the stuff.
Whether this dichotomy in copper means anything or not, will only be known in the fullness of time. Ted said it didn't mean anything as far as he was concerned, as they're all commercial traders in the commercial category. This bifurcation has been in place for as many years as I've been keeping records -- and that's a very long time.
In this vital industrial commodity, the world's banks...both U.S. and foreign ...are now net long only 3.1 percent of the total open interest in copper in the COMEX futures market as shown in the August Bank Participation Report -- and down a bit more from the 4.8 percent they were net long in July's.
At the moment it's mostly the commodity trading houses such as Glencore and Trafigura et al., along with some hedge funds, that are net short copper in the Producer/Merchant category, as the Swap Dealers are net long, as pointed out above.
The next Bank Participation Report is due out on Friday, September 5.
![]()
Here’s Nick Laird’s “Days to Cover” chart, updated with the COT data for positions held at the close of COMEX trading on Tuesday, August 5. It shows the days of world production that it would take to cover the short positions of the Big 4 — and Big '5 through 8' traders in every physically traded commodity on the COMEX. Click to enlarge.
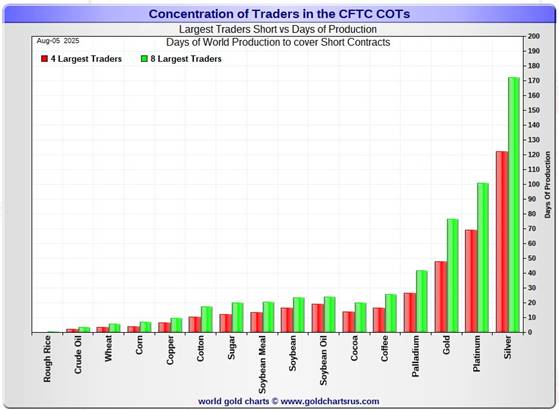
In this week's data, the Big 4 traders are short 122 days of world silver production...down about 9 days from the prior COT report. The ‘5 through 8’ large traders are short an additional 50 days of world silver production...down about 1 day from the prior COT Report, for a total of 172 days that the Big 8 are short -- and down 10 days from last Friday.
Those 172 days that the Big 8 traders are short, represents around 5.7 months of world silver production, or 386.220 million troy ounces/77,244 COMEX contracts of paper silver held short by these eight commercial traders ...which still remains off-the-charts grotesque. Several of the largest of these are now non-banking entities, as per Ted's discovery a year or so ago. August's Bank Participation Report continues to confirm that this is still the case -- and not just in silver, either.
The small commercial traders other than the Big 8 shorts, Ted's raptors, were buyers this past reporting week...for the third week in a row, through the purchase of 2,358 long contracts. This took them from a net long position of 2,658 contracts in last Friday's COT Report...up to a net long position of 5,016 contracts in yesterday's COT Report.
And as I keep saying...why these same traders are net long silver -- but massively net short gold, still remains the 8th wonder of the world. However, as Ted Butler pointed out over the last 20-odd years, the small commercial traders have always shown great reluctance in being short silver.
In gold, the Big 4 are short about 48 days of world gold production...up 4 days from last Friday's COT Report. The Big '5 through 8' are short an additional 29 days of world production...up 3 days from last Friday...for a total of 77 days of world gold production held short by the Big 8 -- and up 8 days from the last COT Report.
As mentioned further up, the Big 8 commercial traders are net short 47.9 percent of the entire open interest in silver in the COMEX futures market as of yesterday's COT Report, unchanged from what they were net short in last Friday's COT Report -- and only so because of the 9,067 contract drop in total open interest, which obviously affects the calculation. If not for that, the percentage number would have certainly been lower than the 47.9 percent shown.
In gold, it's 55.0 percent of the total COMEX open interest that the Big 8 are net short, up big from the 50.8 percent they were short last week...and up big solely because they went massively short in yesterday's COT Report. The minuscule change in total gold open interest was not a factor in this week's calculation.
And as I also mentioned further up in the COT discussion in gold, the short position of Ted's raptors is now a huge [but decreasing] factor once again in the total commercial net short position. Adding in their 22,841 contract current short position, increases the commercial net short position to 60.0 percent of total open interest. So their short position represents 60.0-55.0=5.0 percentage points of total open interest.
And I'll point out once again that the short interest position in SLV now sits at 48.46 million shares as of the last short report, for positions held at the close of COMEX trading on Tuesday, July 15 -- up from the 44.23 million shares sold short on the NYSE in the prior report. This number remains off-the-charts grotesque and obscene -- and yet another way that 'da boyz' are keeping a lid on the silver price, as I mentioned further up.
The next short report is due out on Monday, August 11...for positions held at the close of business on Thursday, July 31.
In the overall, the Big 8 commercial traders decreased their short position in silver by a decent amount...mostly the Big 4. But were forced to go massively short in gold. The set up in silver from a COMEX futures market perspective remains ultra bearish -- and in gold, it's bearish to very bearish.
As Ted Butler had been pointing out ad nauseam, the resolution of the Big 4/8 short positions will be the sole determinant of precious metal prices going forward...although that big short position in gold held by Ted's raptors still remains a factor.
But as he also pointed out over the years, there will come a time when what the numbers show in the COT Report won't matter, as events in the real world will overtake them. What the financial powers-that-be do then in order to save the shorts when that time comes, will be of more than passing interest.
![]()
The August Bank Participation Report [BPR] data is extracted directly from yesterday's Commitment of Traders Report data. It shows the number of futures contracts, both long and short, that are held by all the U.S. and non-U.S. banks as of Tuesday’s cut-off in all COMEX-traded products.
For this one day a month we get to see what the world’s banks have been up to in the precious metals. They’re usually up to quite a bit -- and they certainly were again this past month.
[The August Bank Participation Report covers the five-week time period from July 1 to August 5 inclusive]
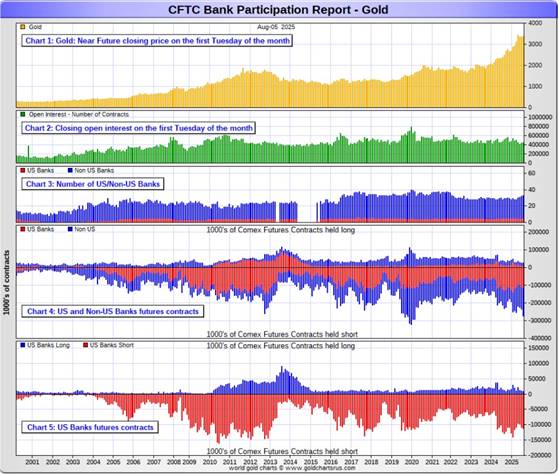
In gold, 5 U.S. banks are net short 103,093 COMEX contracts, up 4,584 contracts from the 98,509 contracts that these same 5 U.S. banks were net short in the July BPR.
Also in gold, 28 non-U.S. banks are net short 144,476 COMEX contracts, an increase of 31,987 contracts from the 112,489 contracts that 27 non-U.S. banks were short in July's BPR.
At the low back in the August 2018 BPR...these non-U.S. banks held a net short position in gold of only 1,960 contacts -- so they've been back on the short side in a gargantuan way ever since. Only a handful of these banks hold meaningful short positions in gold. The short positions of the rest are of no consequence -- and never have been.
Although a lot of the largest U.S. and foreign bullion banks are in the Big 8 short category, some of the hedge fund/commodity trading houses are short grotesque amounts of gold in that category as well. There's also the possibility that the BIS could be short gold in the COMEX futures market as well.
As of August's Bank Participation Report, 33 banks [both U.S. and foreign] were net short 55.1 percent of the entire open interest in gold in the COMEX futures market...up big from the 48.3 percent that 32 banks were net short in the July BPR. This remains an obscene and manipulative short position.
Here’s Nick’s BPR chart for gold going back to 2000. Charts #4 and #5 are the key ones here. Note the blow-out in the short positions of the non-U.S. banks [the blue bars in chart #4] when Scotiabank’s COMEX short position was outed by the CFTC in October of 2012. Click to enlarge.
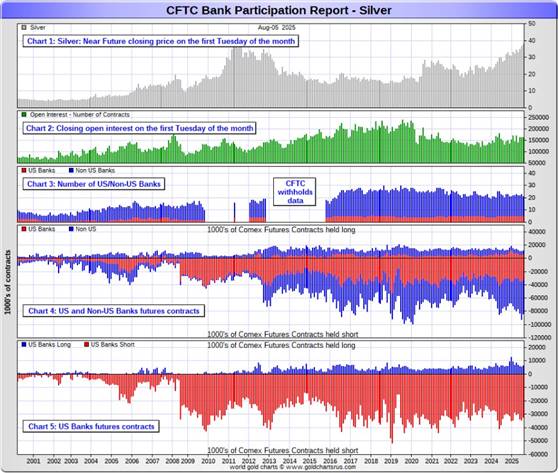
In silver, 5 U.S. banks are net short 25,916 COMEX contracts, down 3,002 contracts from the 28,918 contracts that these same 5 U.S. banks were short in the July BPR.
The five U.S. banks that are mega net short silver would be Citigroup, Wells Fargo, Bank of America, Goldman Sachs and JPMorgan.
Also in silver, 16 non-U.S. banks are net short 45,927 COMEX contracts, down 6,532 contracts from the 52,459 contracts that 18 non-U.S. banks were net short in the July BPR.
It's a given, based on silver deliveries so far this year, that HSBC, Barclays, Standard Chartered, BNP Paribas and Macquarie Futures hold by far the lion's share of the short positions of these non-U.S. banks. Canada's Bank of Montreal is card-carrying member of this group as well.
And, like in gold, the BIS could also be actively shorting silver. However, the remaining short positions divided up between the rest of the small handful of non-U.S. banks, are immaterial — and have always been so....the same as most of the 20-odd non-U.S. banks in gold as well.
As of August's Bank Participation Report, 21 banks [both U.S. and foreign] were net short a grotesque 44.6 percent of the entire open interest in silver in the COMEX futures market — but down from the 49.7 percent that 23 banks were net short in the July BPR.
Here’s the BPR chart for silver. Note in Chart #4 the blow-out in the non-U.S. bank short position [blue bars] in October of 2012 when Scotiabank was brought in from the cold. Also note August 2008 when JPMorgan took over the silver short position of Bear Stearns—the red bars. It’s very noticeable in Chart #4—and really stands out like the proverbial sore thumb it is in chart #5. Click to enlarge.
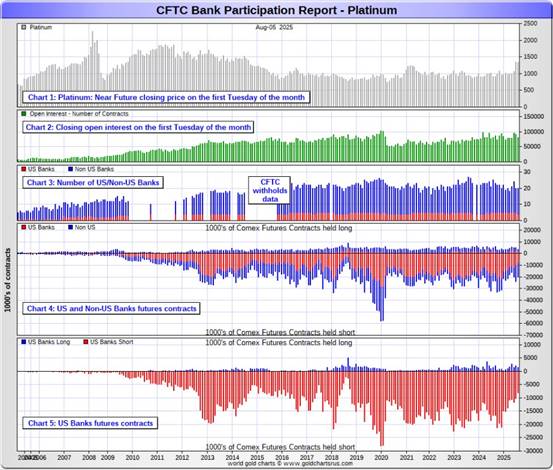
In platinum, 4 U.S. banks are net short 6,622 COMEX contracts in the August BPR, down a further 1,463 contracts from the 8,085 contracts that 5 U.S. banks were short in the July BPR. This is the smallest short position the U.S banks have held since October 2018.
At the 'low' back in September of 2018, these U.S. banks were actually net long the platinum market by 2,573 contracts...so they still have work to do to get back to market neutral...but they've been making great progress in that direction.
Also in platinum, 16 non-U.S. banks also decreased their net short position by 1,008 contracts... from 10,960 contracts held by 15 banks in July's BPR...down to 9,952 contracts in the August BPR...but double the amount they held short in the June BPR.
Back in the December 2023 BPR, these non-U.S. banks were net short a microscopic 35 platinum contracts...so they have yeoman work to do if they ever want to get back to that number.
As you know, platinum remains the big commercial shorts No. 2 problem child after silver -- and there's now a long-term structural deficit in it [and palladium] as well.
And as of August's Bank Participation Report, 20 banks [both U.S. and foreign] were net short 20.6 percent of platinum's total open interest in the COMEX futures market, down from the 20.9 percent that these same 20 banks were net short in July's BPR. The reason that the percentage isn't down more is because of the huge decrease in total open interest during July, which obviously affects the percentage calculation.
Here's the Bank Participation Report chart for platinum. Click to enlarge.
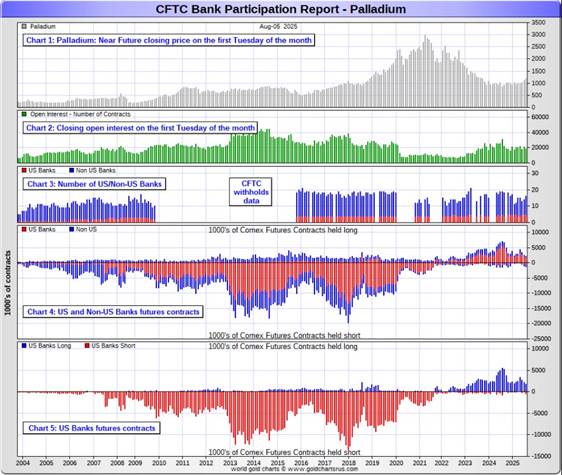
In palladium, 5 U.S. banks are net long 1,148 COMEX contracts in the August BPR, down a further 868 contracts from the 2,016 contracts that these same 5 U.S. banks were net long in the July BPR.
Also in palladium, 11 non-U.S. banks are net short by 435 COMEX contracts... up from the 679 contracts that 9 non-U.S. banks were net short in the July BPR.
This is the second month in a row -- and the first time in many years that these non-U.S. banks have been on the short side in palladium. But it doesn't mean much considering how microscopic the amount is...especially when divided up between 11 banks.
And as I've been commenting on for almost forever, the COMEX futures market in palladium is a market in name only, because it's so illiquid and thinly-traded. Its total open interest in yesterday's COT Report was only 19,043 contracts...compared to 80,547 contracts of total open interest in platinum...161,262 contracts in silver -- and 449,647 COMEX contracts in gold.
Total open interest in palladium has increased quite a bit over the last number of years, because I remember when it was less than 9,000 contracts on average. So it's nowhere near as illiquid as it used to be -- and it's also been helped along by the fact that the bid/ask is now down to only 20 bucks. It used to be $150 at one point way back when.
As I say in this spot every month, the only reason that there's a futures market at all in palladium, is so that the Big 8 commercial traders can control its price. That's all there is, there ain't no more.
As of this Bank Participation Report, 16 banks [both U.S. and foreign] are net long 3.7 percent of total open interest in palladium in the COMEX futures market...down from the 6.5 percent of total open interest that 14 banks were net long in the July BPR. So they've obviously been selling into palladium's rally too.
For the last 5 years or so, the world's banks have not been involved in the palladium market in a material way...see its chart below. And with them still net long, it's almost all hedge funds and commodity trading houses that are left on the short side. The Big 8 shorts, none of which are banks, are short 39.8 percent of total open interest in palladium as of yesterday's COT Report...down from the 41.0 percent they were short in July's BPR.
Here’s the palladium BPR chart. Although the world's banks are net long at the moment, it remains to be seen if they return as big short sellers again at some point like they've done in the past. Click to enlarge.
Excluding palladium for obvious reasons, and almost all of the non-U.S. banks in gold, silver and especially platinum...only a handful of the world's banks, most likely no more than a dozen or so in total -- and mostly U.S. and U.K.-based...along with French bank BNP Paribas...continue to hold meaningful short positions in the other three precious metals...although I won't let Canada's Bank of Montreal or Australia's Macquarie Futures off the hook just yet...nor Deutsche Bank in gold.
As I pointed out above, some of the world's commodity trading houses and hedge funds are also mega net short the four precious metals...far more short than the U.S. banks in some cases. They have the ability to affect prices if they choose to exercise it. But it's still the collusive Anglo/American/Western bullion bank cartel in the commercial category that are at Ground Zero of the price management scheme in the COMEX futures market in the other three.
And as has been the case for a couple of decades now, the short positions held by the Big 4/8 traders is the only thing that matters...especially the short positions of the Big 4...or maybe only the Big 1 or 2 in both silver and gold. How this is ultimately resolved [as Ted kept pointing out] will be the sole determinant of precious metal prices going forward.
The collusive Big 8 commercial traders et al. continue to have an iron grip on their respective prices -- and that circumstance will continue until they either relinquish control voluntarily, are told to step aside...or get overrun. Of course closing the COMEX/LBMA would also get them out with their skins intact.
Considering the current state of affairs of the world as they stand today -- and the structural deficit in silver -- and now in platinum and palladium as well, the chance that these big bullion banks and commodity trading houses could get overrun at some point, is no longer zero -- and certainly within the realm of possibility if things go totally non-linear somewhere.
But...as Ted kept reminding us...if they do finally get overrun, it will be for the very first time...which obviously wasn't allowed to happen this past month, either.
The next Bank Participation Report is due out on Friday, September 5.
![]()
CRITICAL READS & VIDEOS
On the surface, there were no major surprises in today's consumer credit report: after last month's $5.1 billion increase, consensus expected a sequential increase of $7.5 billion and it got almost exactly that: an increase of $7.37 billion to $3.758 trillion, up from $3.749 trillion in May.
However, taking a closer look at the components reveals something troubling.
While boring non-revolving credit increased by $8.4 billion or more or less in line with what it has done in recent months...
... an increase that in Q2 was driven in roughly equal part from contribution in student loans (+8.2BN) and auto loans (+$5.1)...
... the surprise was in the amount of revolving loans, i.e. credit card debt, which declined by just over $1 billion in June, which was the second consecutive monthly drop in the series...Click to enlarge.
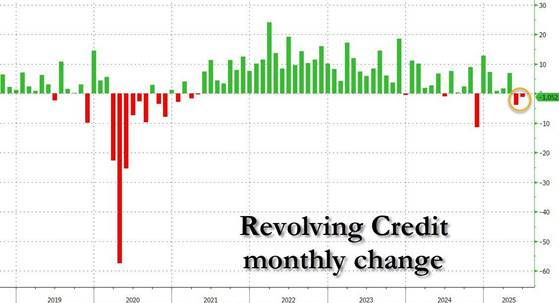
... which is very notable because that would make it the first time since the economic collapse at the peak of the covid crash.
Which begs the question: is the a cause - i.e...will the economy now suffer a sharp slowdown with consumers clearly hunkering down and no longer charging it - or effect - has the economy already stalled and this is just the consequence. If indeed this is the latter, then expect a dramatic downward revision of all recent economic data, similar to what we saw last week with payrolls, as the U.S. economy enters its new glide slope to a recession.
This rather brief 5-chart Zero Hedge news item showed up on their Internet site at 7:04 a.m. on Friday morning EDT -- and another link to it is here.
![]()
The Nasdaq100 surged 3.7% this week to close at an all-time high. Powered by Apple 13.3% melt-up, the Bloomberg MAG7 Index surged 5.4% to a record high.
Last week’s fledgling risk aversion was reversed as fast as you can yell “cover your shorts” and “unwind your hedges.” High yield CDS dropped 13 bps, reversing just over half of last week’s 22 bps spike. Investment-grade CDS reversed three of last week’s four bps increase. The VIX’s 5.2 drop (to 15.2) essentially reversed the previous week’s jump.
Even in normal times, I would struggle to turn short-term negative on the U.S. economy, not with financial conditions this loose and markets booming. But a historic AI arms race is Anything But Normal Times.
Yet financial conditions have loosened further. The market backdrop is increasingly manic. Credit is more overheated these days. High yield CDS is currently 40 bps lower than a year ago, with yields almost 70 bps lower (6.99% vs. 7.68%). Leveraged loan prices are meaningfully higher.
It could be the proverbial “frog in the pot.” Or perhaps it’s just that speculative markets are so enamored with the scope of Trump’s pro-growth, pro-Bubble agenda that they’re willing to cut the administration a lot of slack. A whole lot.
And so long as markets accommodate, the President’s great power play will power ahead without bounds. The bond bears were run over last week. Ample good reasons to get off the pavement and regroup. Miran on the FOMC, ongoing tariff madness, and booming markets should have the attention of the bond vigilantes.
The markets, financial system, and economy are today more vulnerable. April’s episode illuminated latent fragilities and the potential for deleveraging to wreak swift havoc.
Doug's weekly commentary is always worth reading -- and the link to this one, posted on his website shortly before midnight on Friday night PDT, is linked here. Gregory Mannarino's post market close rant for Friday is linked here -- and this one runs for about 23 minutes.
![]()
![]()
This 27-minute video interview with former CIA analysts McGovern and Johnson was hosted by Judge Andrew Napolitano -- and appeared on the youtube.com Internet site very late on Friday afternoon EDT. It's certainly worth your while if you have the interest -- and I thank Guido Tricot for sharing it with us. Another link to it is here.
![]()
This very worthwhile and wide-ranging interview with the Colonel was hosted by Nima Alkhorshid on Tuesday -- and for length and content reasons, had to wait for today's column. Another link to it is here.
![]()
A U.S. move to put tariffs on imports of gold bars is unleashing fresh turmoil in the bullion market, with prices spiking in New York as dealers brace for a major reordering of global trade flows.
U.S. Customs and Border Protection has clarified that 1-kilogram and 100-ounce gold bars are subject to reciprocal tariffs enacted by President Donald Trump, and are not exempted as the industry had initially understood, according to a letter from the agency seen by Bloomberg. The ruling was first reported by the Financial Times.
Gold futures in New York -- which are backed by those forms of bullion -- surged to a record high, as traders, analysts, and executives across the industry were left reeling. The move threatens to disrupt shipments from Switzerland and other key trading and refining hubs including Hong Kong and London, where prices are now trading at a big discount to the U.S. market.
Traders and analysts are scrambling to understand the full scope and consequences of the ruling, including whether the CBP would treat larger 400-ounce bars that underpin trading in London in the same way, and what the levies for major gold-producing countries will be. The potential market consequences are so profound that some questioned whether the dramatic change could be an error on the CBP's part, and suggested it may be subject to legal challenges.
"In the long run, the existence of U.S. tariffs on deliverable gold products raises the question on the role of futures trading in the U.S.," said Joni Teves, a strategist at UBS AG. "Until there is clarity, we expect the gold market and precious metals markets more generally to remain very nervous."
Nervous indeed, as a very hefty 18 tonnes of gold have been added to the August delivery month in the last two days. This Bloomberg story from yesterday was picked up by finance.yahoo.com -- and I found it embedded in a GATA dispatch. Another link to it is here. A related story I found on Sharps Pixley from the fxstreet.com Internet site is headlined "Gold tariffs spark firestorm: Switzerland’s refining empire runs into a COMEX-sized wall" -- and linked here.
![]()
In the early hours of trading today, global markets were shaken by the announcement by the Trump administration of a 39% tariff on imported gold bars weighing 100 ounces or more. U.S. December gold futures reached an all-time high price of $3,534.10 per ounce shortly after the declaration was made.
This sudden move injected uncertainty into the bullion market, unsettling dealers, refiners, and institutional investors trading in larger "exchange delivery" formats. While gold is rarely targeted by protectionist measures -- unlike base metals, agriculture, or manufactured goods -- this decision warrants close attention, both for its immediate market impact and potential implications for future monetary policy.
From an economic perspective, there are several plausible motivations (several of which may hold true simultaneously) for such a steep and sudden measure...
This interesting opinion piece was posted on thedailyeconomy.org Internet site on Friday -- and I fount it on the gata.org website. Another link to is here. And also from a GATA dispatch yesterday is this 12-minute very pointed and forceful video commentary/opinion piece on the same issue by Jan Skoyles over at goldcore.com. That's linked here.
![]()
The White House will issue an executive order "clarifying" the U.S. stance on gold bar tariffs, after a ruling that a widely-traded form of the precious metal is subject to levies sent shock waves through the bullion market. ...
"The White House intends to issue an executive order in the near future clarifying misinformation about the tariffing of gold bars and other specialty products," a White House official said today.
The above two paragraphs from a Financial Times of London news item on Friday are the only two that are posted in the clear. I found this in another GATA dispatch -- and the rest of the story is behind the FT's paywall. Another link to it is here.
![]()
QUOTE of the DAY

![]()
The WRAP
"Understand this. Things are now in motion that cannot be undone." -- Gandalf the White
![]()
Today's pop 'blast from the past' is 49 years young...which is almost impossible to believe -- and is one I've posted before on more than one occasion, but it's worth a revisit, as I'm in the mood for it. It's considered by most to be this American rock band's all-time greatest song -- and you'll get no argument from me on that one. The founder of the band, an MIT-trained engineer, did not enjoy the limelight of being a performer. The link to it is here. Of course there's a bass cover to this -- and here's infusion26 laying it down just right. The link is here.
And if you're interested in the story about the man, the engineer, his musical genius -- and how it all came to be, there's a 5+ minute video about him linked here.
Today's classical 'blast from the past' is an aria that Mozart composed in 1780 for an opera that he never finished. It's a short work entitled "Ruhe sanft, mein holdes Leben". Soprano Dame Mojca Erdmann is the soloist -- and the link to it is here.
![]()
All the action that mattered was in gold yesterday -- and what a day it was. Although it only closed higher by $3.10 in the spot market, with an intraday price move of $26.90...net volume was over the moon -- and the intraday move in the December contract was an astonishing $89.20 the ounce.
Gold also traded well above $3,500 at its high tick in the December contract, its current front month...$3,534.20 to be exact...but was closed below that mark at $3,491.30 in that month.
On top of that, there were 7,257 COMEX contracts traded in August, of which 2,324 contracts of that amount showed up in Friday night's Preliminary Report -- and I'll have more on this below the charts.
Market maven Alyosha had this to say about gold early on Friday morning... "COMEX December gold took a 4th look at contract highs posted on April 22 of $3,585.80 last night, and responsive sellers rejected the attempt for a 4th time. Usually…the more times a market returns to its highs the greater the probability it will break them.
The Swiss tariff narrative is adding to an already troublesome EFP problem that has been getting worse, not better, since last December."...."It looks like a seller is defending these highs." [Yes, they are...the collusive commercial traders of whatever stripe -- Ed]
On the other hand, it was a bit of a yawner day in silver -- and although it did trade in a 51 cent price range in the spot market, net volume was on the lighter side once again.
Alyosha had this to say about silver and SLV..."Silver came along for the ride, but it’s really in its own world."...yes, it is - Ed.He continues..."There is a minor SLV expiry today with fewer than 2 million shares at risk of creation. However, circa 30 million shares (1 share = 1 troy ounce) are ITM, ATM...In the Money/At the Market, or close to it, so there is a gamma risk above $35/share in SLV today and expiration risk next Friday."
I thank Roy Stephens for sending along his commentary on Friday morning.
Platinum and palladium were both closed down on the day. Platinum remains above its 50-day moving average, at least for the moment...but 'da boyz' closed palladium below its by a very decent amount -- and why it was down on both its weekly and month-to-date charts further up.
Copper caught a bid, as it closed up 6 cents at $4.46/pound...still 15 cents below its 200-day moving average -- and now out of oversold territory by a bit on its RSI trace.
Both natural gas [chart included] and WTIC were closed lower...the former by 7 cents at $3.00/1,000 cubic feet -- and the latter by 53 cents at $63.35/barrel. Both are well below any moving averages that matter on their respective RSI traces.
Here are the 6-month charts for the Big 6+1 commodities...courtesy of stockcharts.com as always and, if interested, their COMEX closing prices in their current front months on Friday should be noted. Click to enlarge.
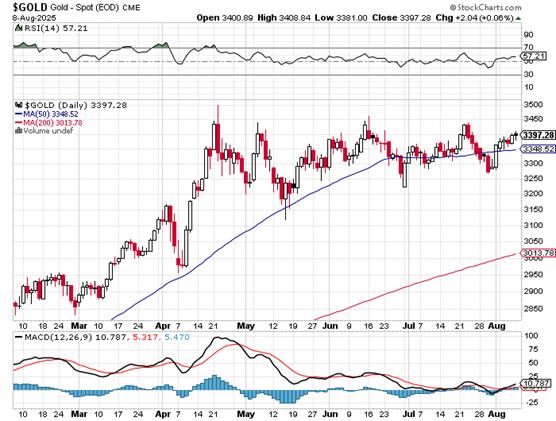
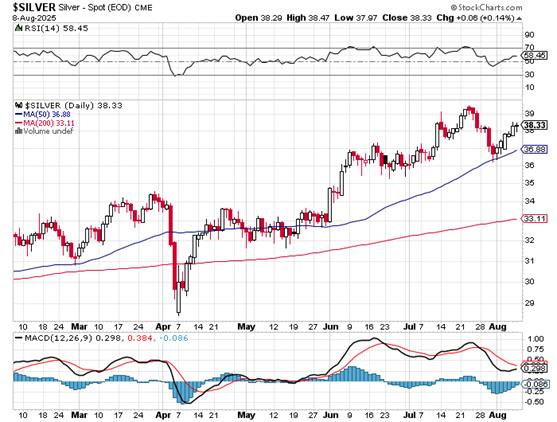
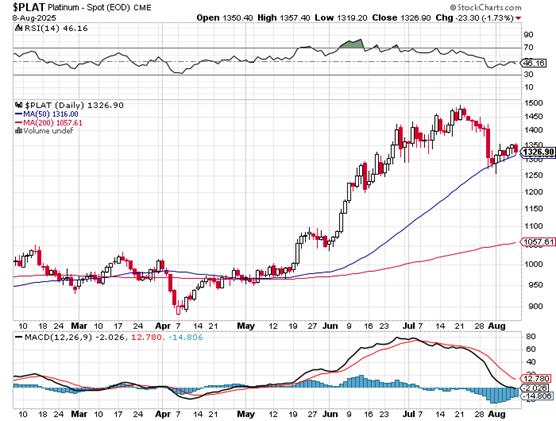
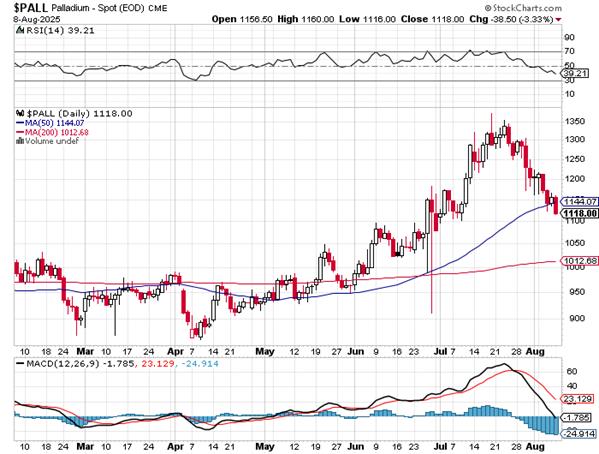
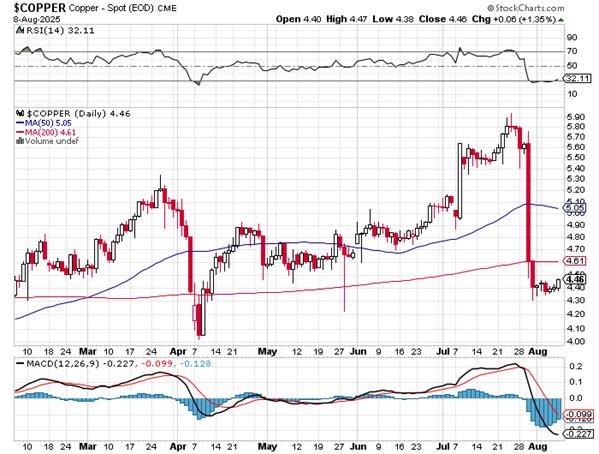
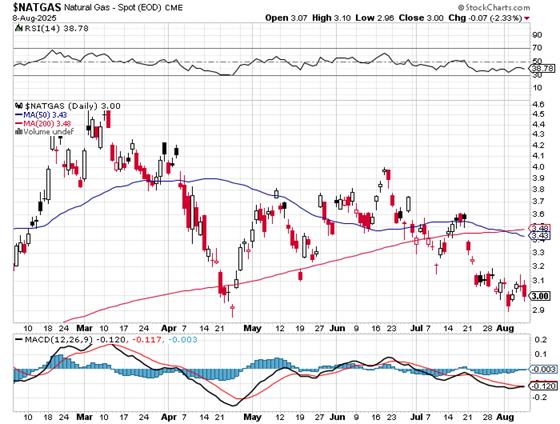
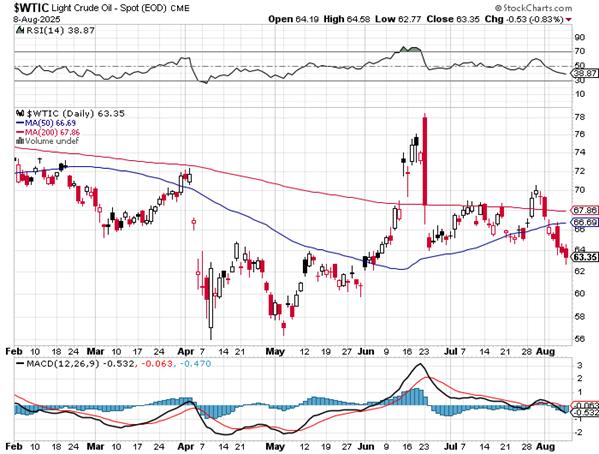
As I mentioned above the charts, it was an astonishing day in gold...monster volume, but little activity in the spot market. All of the price action was in October and December, as the intraday price moves in both December and October were enormous -- and out of sight unless one knew where to look.
But what really got my attention in gold were the number of contracts added to the August delivery month on Thursday and Friday. On Thursday, it was 3,479 COMEX contracts -- and on Friday...2,324 contracts...for a total of 5,803 contracts/580,300 troy ounces/18.05 tonnes.
On First Notice Day for August deliveries back on the evening of July 31...there were only 19,466 gold contracts of August open interest left. But since then, there have been 7,149 contracts added to the August delivery month...with the lion's share of that amount added during the last two trading sessions. Someone wants their gold now...thank you very much!
Then there's silver. Total August open interest remaining on First Day Notice was only 940 COMEX contracts...but as of last night's Preliminary Report, there had been 1,687 silver contracts issued and stopped...an increase of 79.5% so far this month -- and there's lots of delivery month left in both of these precious metals.
Regarding yesterday's COT Report I took a pass on what might be in it regarding gold -- and glad I did...but not because of the 11,000+ contract increase in open interest, but the fact that it wasn't 'all for one -- and one for all' in the commercial trader category, as Ted Raptors broke ranks and covered about a third of their grotesque short position...which forced the Big 8 to add far more shorts than they would have liked.
In silver, the last four trading days of the reporting week were all higher closes -- and all above its 50-day moving average...a sure bet the the Managed Money traders were buyers -- and the commercial traders of whatever stripe were going short against them. Wrong! The Managed Money traders puked longs big time -- and every category of commercial traders were huge buyers -- and thus the big and counterintuitive 6,701 contract drop in the Commercial net short position.
I mentioned several times prior to Friday that there was some hinky stuff going on regarding the ultra low volumes and the counterintuitive drops in total open interest on several days regarding silver. I also mentioned several times that I hoped for a positive surprise in yesterday's COT Report...well, we got it.
What does 'all of the above' might mean in the grand scheme of things, you ask? I don't know, nor does anyone else. But it's way out of the ordinary -- and I've never seen anything like it before. As Ted would have said..."it's man bites dog" stuff -- and now around all this swirls the talk of a 'revaluation'...a 'Great Reset' of one type or another.
As I've been going on for most of the year, there are a lot of pieces in motion on the precious metals chessboard...all of which are now moving faster and faster.
Taking our eyes off that for a moment, the greatest financial 'everything bubble' the world has ever known, continues without let-up. Concurrent with that is the 54-year young experiment in fiat currencies that underpins it... that's long past it's 'best before' use date -- and now saddled with the burden of unending sanctions and tariffs. What could possibly go wrong?
And...on the Grand Chessboard in the Asian heartland...the Putin/Trump summit looms.
Those are all the reasons that I need to be 'all in' in the precious metals and, as always, will remain so to whatever end.
I'm done for the day -- and the week -- and I'll see you here on Tuesday.
Ed


