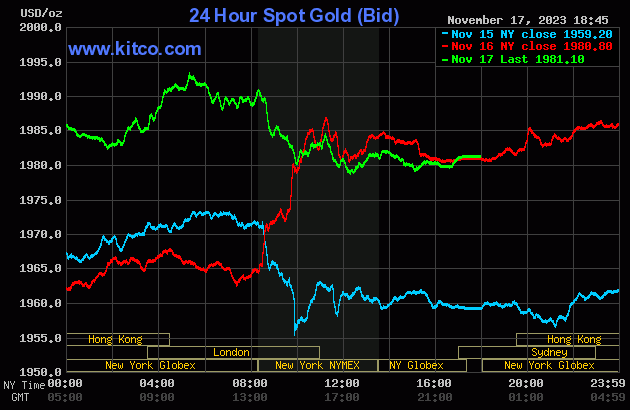
The gold price began to creep quietly higher shortly after GLOBEX trading began at 6:00 p.m. EST in New York on Thursday evening -- and that lasted until minutes after 12 o'clock noon China Standard Time on their Friday afternoon. It was sold quietly lower from there until around 2:45 p.m. CST -- and its ensuing rally ran into 'something' very shortly after 10 a.m. in London. Despite the dollar index heading for the nether regions of the earth, 'da boyz' engineered the gold price lower until around 12:15 p.m. in COMEX trading in New York. From there it wandered sideways to a few dollars higher until the market closed at 5:00 p.m. EST.
The high and low ticks in gold were reported as $1,996.40 and $1,981.10 in the December contract. The December/February price spread differential in gold at the close in New York yesterday was $20.10...February/April was $19.40...April/June was $19.90 -- and June/August was $17.70 an ounce.
Gold was closed on Friday afternoon in New York at $1,981.10 spot, up 30 cents from Thursday -- and 12 bucks off its Kitco-recorded high tick. Net volume was ultra-light a bit over 107,000 contracts -- and there were a hair under 26,000 contracts worth of roll-over/switch volume out of December and into future months...mostly February, but with noticeable amounts into April, June and August as well.
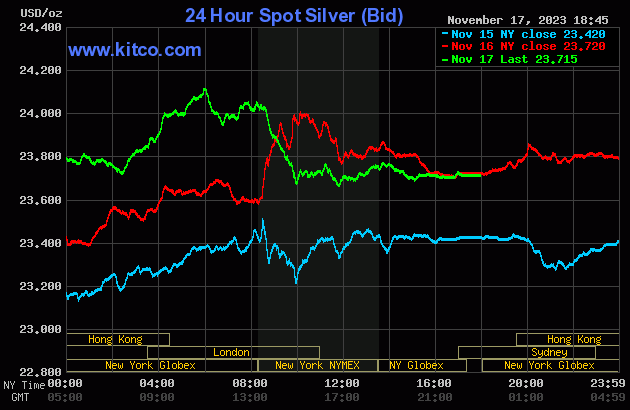
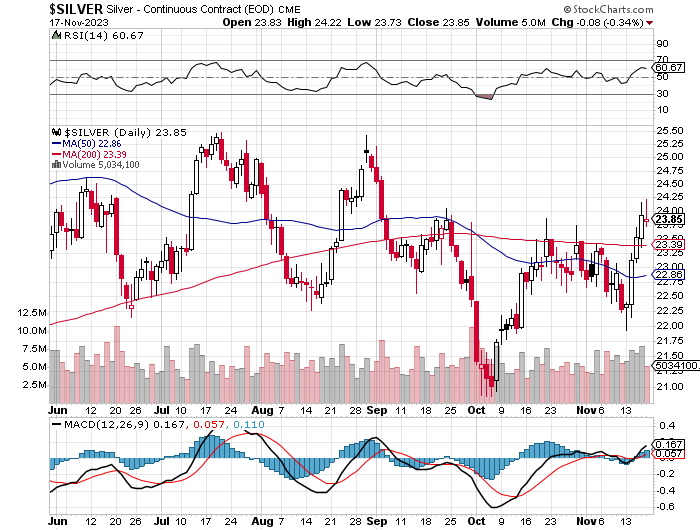
The silver price came close to going 'no ask' at 9 a.m. China Standard Time in GLOBEX trading on their Friday morning -- and that was summarily dealt with. From that juncture it was sold sideways to a bit lower until around 3:25 p.m. CST. Its rally from there was capped at 11 a.m. GMT in London -- and it was then engineered two steps lower until the 10 a.m. EST London afternoon gold fix. It then chopped/wandered quietly sideways until trading ended at 5:00 p.m.
The high and low ticks in silver were recorded by the CME Group as $24.22 and $23.73 in the December contract. The December/March price spread differential in gold at the close in New York yesterday was 34.9 cents...March/ May was 23.9 cents -- and May/July was 23.7 cents an ounce.
Silver was closed in New York on Friday afternoon at $23.715 spot, down 0.5 cents on the day -- and a very long way...40.5 cents...off its Kitco-recorded high tick. Net volume was certainly on the quieter side in it as well...only 41,000 contracts -- and there were a bit under 13,500 contracts worth of roll-over/switch volume out of December and into future months in this precious metal...mostly March.
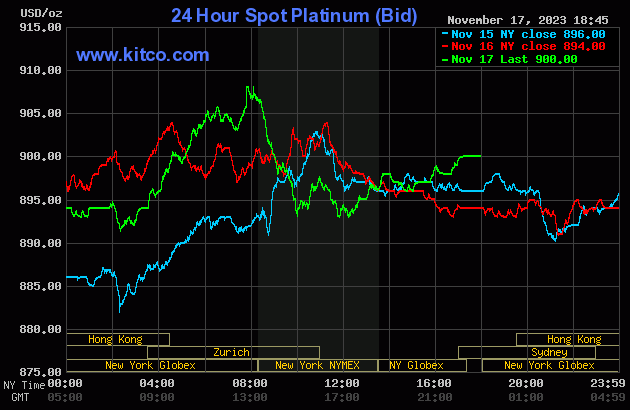
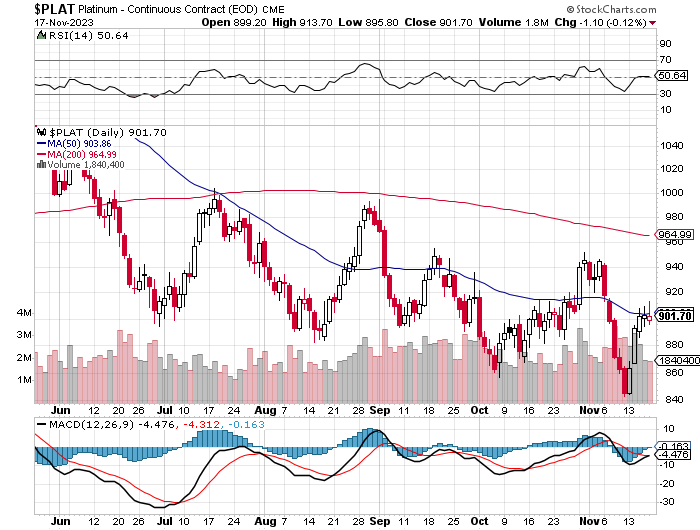
The platinum price chopped quietly sideways until around 3:20 p.m. China Standard Time in GLOBEX trading on their Friday afternoon. Its ensuing rally ran into 'something' around 1:45 p.m. CET in Zurich -- and shortly after that 'da boyz' appeared and reversed it entire gain up to that point by the 10 a.m. EST afternoon gold fix in London. Then, starting around 2 p.m. in after-hours trading, it began to edge unevenly higher -- and that lasted until the market closed at 5:00 p.m. EST. Platinum closed up 6 dollars on the day -- and 8 bucks off its Kitco-recorded high tick.
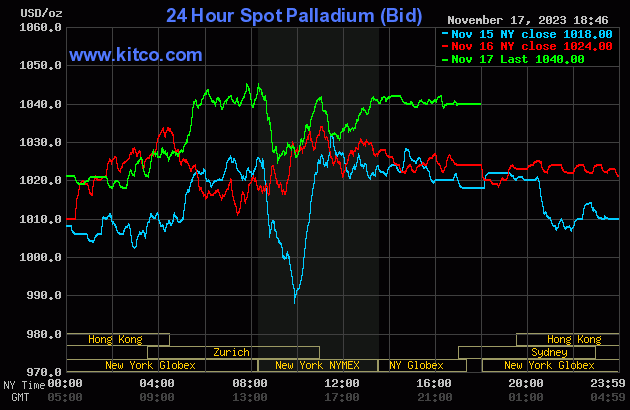
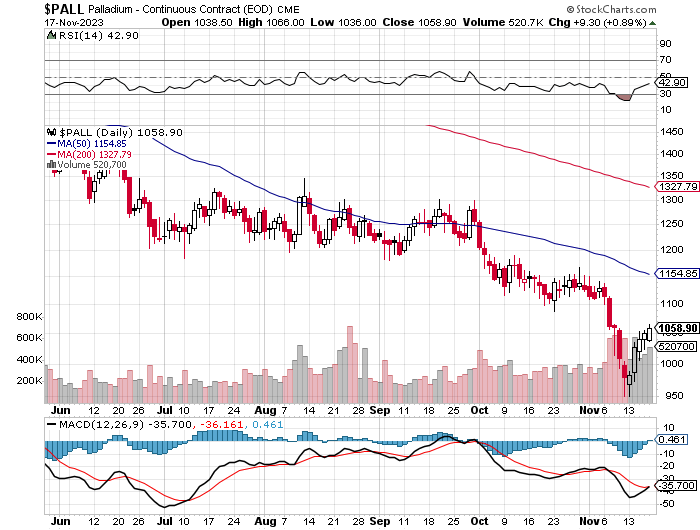
Palladium didn't do a thing until around 3:40 p.m. CST -- and its ensuing and very uneven rally from there, came to an end very shortly before the 1:30 p.m. EST COMEX close in New York. It didn't do much after that. Palladium was closed at $1,040 spot, up 16 dollars from Thursday.
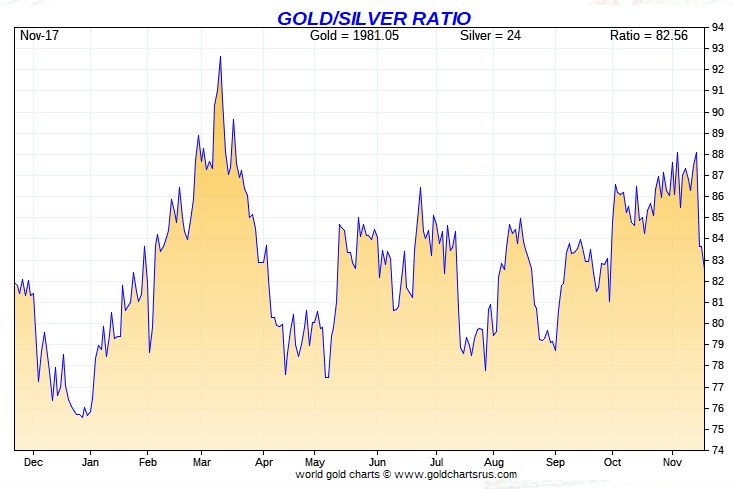
Based on the kitco.com spot closing prices in silver and gold posted above, the gold/silver ratio worked out to 83.5 to 1 on Friday...exactly unchanged from Thursday.
Here's Nick's 1-year Gold/Silver Ratio chart, updated with last week's data and, as always, yesterday's data point is not on it for whatever reason. Click to enlarge.
![]()
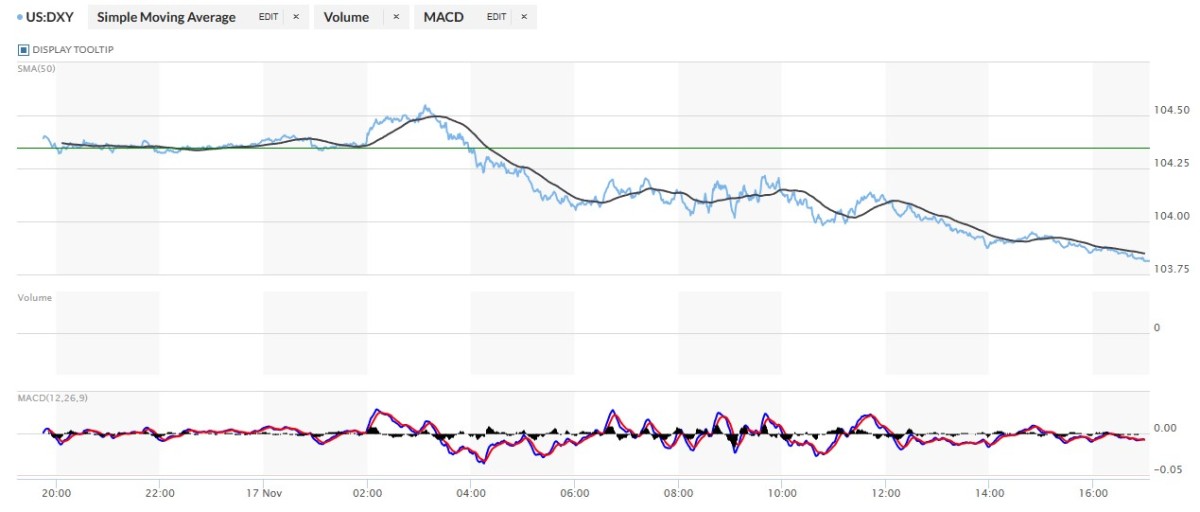
The dollar index closed very late on Thursday afternoon in New York at 104.35 -- and then opened higher by 4 basis points once trading commenced at 7:45 p.m. EST on Thursday evening, which was 8:45 a.m. China Standard Time on their Friday morning. It chopped very quietly lower from there until it jumped up a bit starting at 2:50 p.m. CST, with its high tick of the day coming around 8:07 a.m. GMT in London. From there it took several very broad steps lower -- and that sell-off continued right until trading ended at 5:00 p.m. EST in New York.
The dollar index finished the Friday trading session in New York at 103.92 down 43 basis points from its close on Thursday -- and 10 basis points above its indicated close on the DXY chart below.
Here's the DXY chart for Friday, thanks to marketwatch.com as usual. Click to enlarge.
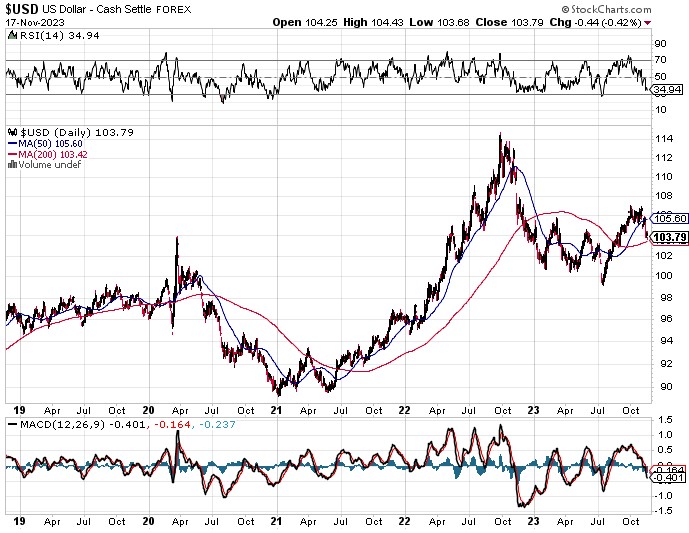
And here's the 5-year U.S. dollar index chart that appears in this spot every Saturday, courtesy of stockcharts.com as always. The delta between its close...103.79...and the close on the DXY chart above, was 13 basis points below its spot close. Click to enlarge.
There was a tiny bit of correlation between the currencies and gold and silver prices for a while in early GLOBEX trading. But that all ended minutes before 2 p.m. CST when the DXY and the precious metals began to head higher in tandem...then went totally out the window shortly after 10 a.m. GMT in gold -- and 11 a.m. GMT for silver when 'da boyz' showed up.
U.S. 10-Year Treasury: 4.4410%...down 0.0040 (-0.0900%)...as of 01:25 p.m. EST
And here's the 5-year 10-year U.S. Treasury chart from the yahoo.com Internet site -- which puts the yield curve into a somewhat longer-term perspective. Click to enlarge.
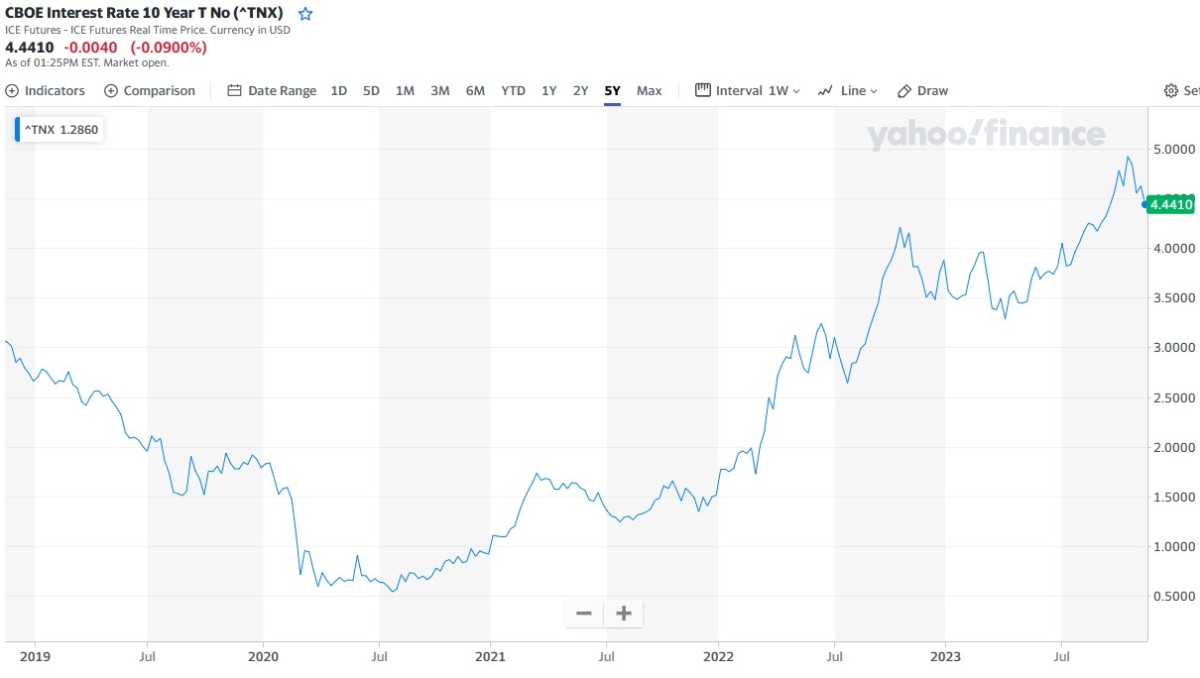
As I pointed out in this spot last week, it's now crystal clear that the 5 percent mark on the 10-year is a permanent line in the sand for the Fed...until it become indefensible at some point in the future.
![]()
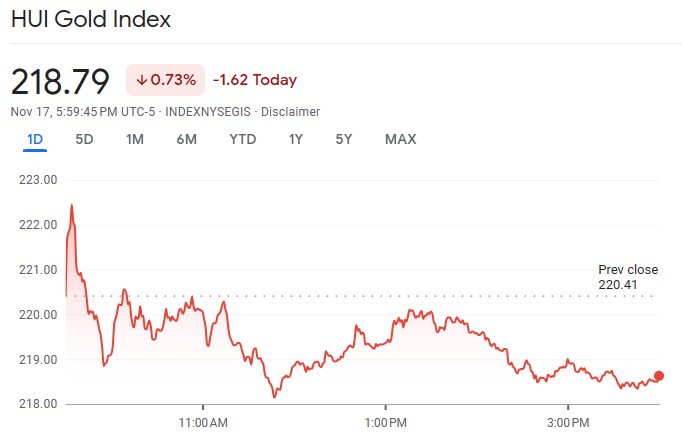
The gold shares jumped up a bit at the open, but were then sold immediately and unevenly lower until their respective lows were set around 11:45 a.m. in New York trading. From that point they had a broad and quiet up/down move that last until the markets closed at 4:00 p.m. EDT. The HUI closed lower by 0.73 percent -- and the chart comes courtesy of Google Finance.
Computed manually, the new Silver Sentiment/Silver 12 Index finished higher by 0.11 percent...so call it unchanged.
Here's Nick's old 1-year Silver Sentiment/Silver 7 Index chart, updated with Friday's candle. Click to enlarge.
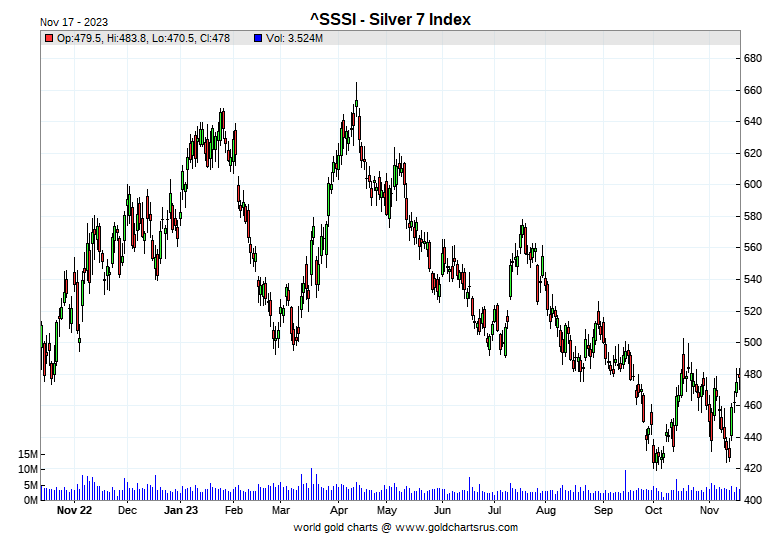
The star was Hecla Mining, as it closed up 3.80 percent -- and the biggest underperformer was Aya Gold & Silver, as it closed down 2.06 percent.
The reddit.com/Wallstreetsilver website, now under 'new' but not necessarily improved management, is linked here. The link to two other silver forums are here -- and here.
![]()
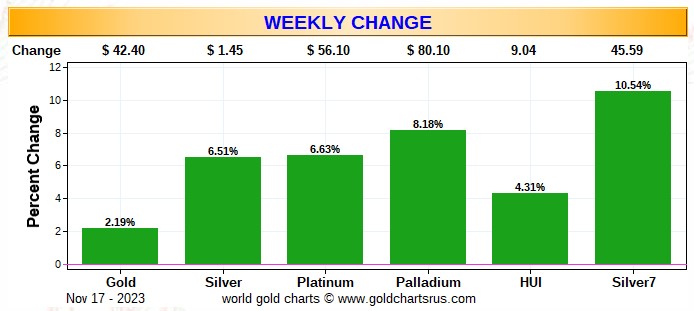
Here are the usual three charts that appear in every weekend missive. They show the changes in gold, silver, platinum and palladium in both percent and dollar and cents terms, as of their Friday closes in New York — along with the changes in the HUI and the old Silver 7 Index.
Here's the weekly chart -- and it's a soothing wall-to-wall green -- and one can only fantasize at what these gains would have looked like if gold, silver and their respective equities had been allowed to trade freely yesterday. Click to enlarge.
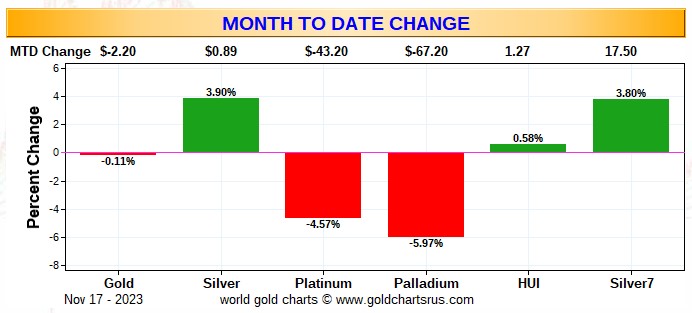
Here's the month-to-date chart -- and this past week's big gains have helped it a lot, especially everything silver related. They've also pared the loses in platinum and palladium as well. Click to enlarge.
Here's the year-to-date graph -- and for more than two months now, it's still only gold that is up on the year, with the silver equities continuing to underperform badly vs. the gold shares...although their performance is pretty brutal as well considering how much gold is up year-to-date. The engineered price decline in palladium all year long has been nothing short of astounding, with platinum's engineered decline...the U.S. bullion banks' No. 2 problem child...very noticeable as well.
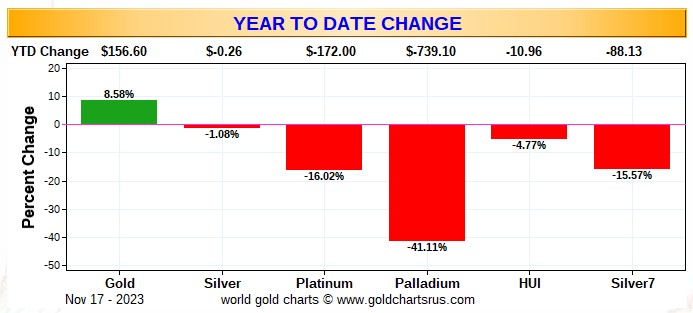
Of course -- and as I mention in this spot every Saturday -- and will continue to do so...is that if the silver price was sitting within 5 or so percent of its old high of $50 the ounce...like gold is currently within 5 percent or so of its old high of around $2,080...it's a given that the silver equities would be outperforming their golden cousins by an absolute country mile.
![]()
The CME Daily Delivery Report showed that 9 gold -- and zero silver contracts were posted for delivery within the COMEX-approved depositories on Tuesday.
In gold, the sole short/issuer was Wells Fargo Securities. The two long/ stoppers were BMO Capital and Canada's Scotia Capital/Scotiabank, picking up 8 and 1 contracts respectively. All contracts, both issued and stopped involved their respective house accounts.
The link to yesterday's Issuers and Stoppers Report is here.
Month-to-date so far, there have been 1,980 gold contracts issued/reissued and stopped -- and that number in silver is 820 contracts. In platinum, it's 115 contracts -- and in palladium, zero.
The CME Preliminary Report for the Friday trading session showed that gold open interest in November rose by 2 contracts, leaving 187 still around, minus the 9 contracts mentioned a few paragraphs ago. Thursday's Daily Delivery Report showed that zero gold contracts were actually posted for delivery on Monday, so that obviously means that 2 more gold contracts were added to November deliveries.
Silver o.i. in November increased by 28 contracts, leaving 43 still open. Thursday's Daily Delivery Report showed that 2 silver contracts were posted for delivery on Monday, so that means that 28+2=30 more silver contracts just got added to November deliveries.
Total gold open interest at the close on Friday increased by 1,121 COMEX contracts -- and total silver o.i. declined by 696 contracts. Both these numbers are subject to some revision by the time the final figures are posted on the CME's website later on Monday morning CST.
One more note, like on Tuesday, Wednesday -- and again yesterday... looking back at silver's total [and preliminary] open interest change on Thursday, I pointed once again that despite its big rally on that day, total o.i. only rose by 1,459 COMEX contracts -- and by the time the final number was posted on the CME's website on Friday morning, that number had been whittled down to just 430 contracts. This is still 'man bites dog' stuff.
Ted and I had a brief discussion about it on the phone yesterday -- and the day before -- and don't know what to make of it. There was nothing I could see about this in yesterday's COT Report -- and hopefully next week's will shine some light on it. I suspect he'll have something to say about this in his his weekly review this afternoon. But whatever is going on 'under the hood', doesn't appear to be bearish for its price.
![]()
At last there was a deposit into GLD, as an authorized participant, or more than one, added 417,209 troy ounces of gold. And, for the third time this week, there was another withdrawal from SLV, as an authorized participant removed a further 1,832,144 troy ounces/three truckloads of silver.
Since Monday, there have been 4,442,980 troy ounce of silver removed from SLV. But because of the rally we've had recently, there should be silver being deposited, but that isn't happening. What that most likely means is that one more more authorized participants are shorting SLV shares in lieu of depositing physical metal...as it just isn't available.
I suspect that Ted will have something to say about this in his weekly review for his paying subscribers this afternoon.
In other gold and silver ETFs and mutual funds on Planet Earth on Friday, net of any changes in COMEX, GLD and SLV inventories, there were a net 118,544 troy ounces of gold taken out, plus 234,087 troy ounces of silver was removed as well...123,787 troy ounces out of GoldMoney -- and the remaining 110,300 troy ounces out of iShares/SVR.
And after the mint's decent sales report on Thursday, there was no sales report from the U.S. Mint on Friday.
Month-to-date the mint has sold 31,500 troy ounces of gold eagles -- 10,000 one-ounce 24K gold buffaloes -- and 1,439,000 silver eagles.
Who is buying all this production is open for debate, as it certainly isn't the average retail investor.
![]()
The only activity in gold over at the COMEX-approved depositories on the U.S. east coast on Thursday were the 699 troy ounces that departed Manfra, Tordella & Brookes, Inc. Nothing was received -- and there was no paper activity, either. The link to this is here.
The only activity in silver was the one truckload/599,425 troy ounces that arrived at CNT. Nothing was shipped out.
But there was pretty hefty paper activity...starting with the 69,307 troy ounces that were transferred from the Eligible category and into Registered -- and no doubt going out for immediate delivery.
Then there were the 921,295 and 522,476 troy ounces that were transferred from the Registered category and back into Eligible over at Brink's, Inc. and JPMorgan respectively.
The link to Thursday's COMEX action in silver, is here.
There was fairly decent activity over at the COMEX-approved gold kilobar depositories in Hong Kong on their Thursday. They reported receiving 839 kilobars -- and shipped out 1,241 of them. Except for the 40 kilobars that arrived at Loomis International, the remaining in/out activity took place over at Brink's, Inc. as always. The link to that is here.
![]()
A few days ago I posted a story in the Critical Reads section about India's October trade deficit increasing a lot because of all the gold and silver they imported that month. But there were no amounts or dollar figures included in the story, so I just let it pass.
But in my Friday phone call with Ted, he brought the subject up -- and sent me two stories that showed the dollar amounts of gold and silver imported during that month. The link to one of them is here. For gold, it was the same in both articles...$7.23 billion and, depending on which story your read, it was either $1.31 or $1.80 billion in silver. Ted assumed the former number and, to be conservative, so am I.
Assuming an average $1,860 per ounce price for gold, that means they imported around 3.9 million ounces/121 tonnes of gold. For silver, I'll guesstimate $21.50 the ounce, which works out to around 60 million troy ounces...about 1,900 tonnes of the stuff.
The official numbers for October won't show up in their statistics until early January, as Nick doesn't even have their official data for September as of yet. But if September's numbers are available, he hasn't updated his charts with that data as of yet.
![]()
Here are the usual 20-year charts that show up in this space in every Saturday column. They show the total amounts of physical gold and silver held in all know depositories, ETFs and mutual funds as of the close of business on Friday.
During the week just past, there were a net 28,000 troy ounces of gold removed -- and a net 4.990 million troy ounces of silver were taken out as well during the reporting week...with most of that amount being the result of the big withdrawals from SLV this past week. Click to enlarge for both.
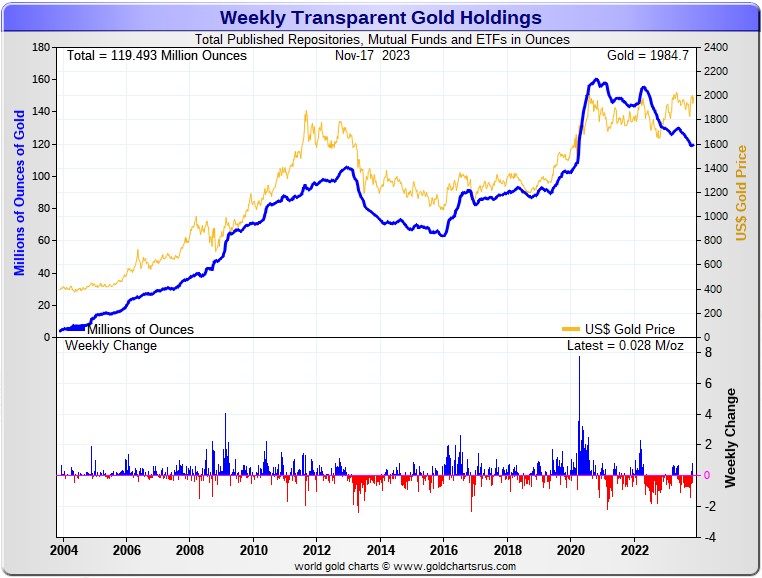
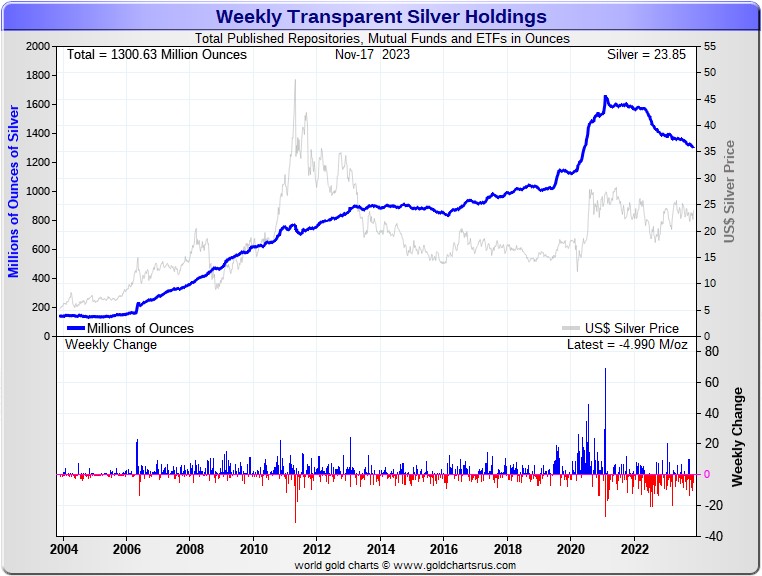
According to Nick Laird's data on his website, there have been a net 667,000 troy ounces of goldadded -- but an eye-watering and net 17.080 million troy ounces of silver were withdrawn from all the world's known depositories, mutual funds and ETFs during the last four weeks.
In gold, there were only two ETFs showing net deposits worthy of the name...the 758,000 troy ounces that went into GLD -- and the 666,000 troy ounces added to ZKB. The two largest 'out' amounts were the 191,000 troy ounces that left the XetraGold...followed by the 177,000 troy ounces that departed Deutsche Bank. After them were the 161,000 troy ounces that were shipped out of iShares/IAU. The list goes on and on...
In silver, there were zero mutual funds or ETFs that had net inflows over the last four weeks. The largest 'out' amounts were the 7.287 million troy ounces taken out of iShares/SLV...followed by the 2.812 million troy ounces that departed the COMEX. Next were the 2.112 million troy ounces out of iShares/SVR. In fourth and fifth place were the 1.402 million troy ounces and 1.052 million troy ounces that were shipped out of SIVR and Sprott's/PSLV respectively. The list goes on and on here as well.
Retail bullion sales still aren't all that great, although I'm sure they've picked up during the last month or so. When retail investment demand really gets serious once again, we will be back to shortages/back orders and high premiums in very short order. And that's not taking into account the mind-boggling quantities of silver that will be absorbed by all the silver ETFs and mutual funds.
Where will all this physical metal come from in the face of this ongoing and accelerating physical shortage, one wonders? It's one of the things that the powers-that-be fear most I suspect, as it just won't be there at some point... although JPMorgan & Friends are sitting on a goodly amount of the stuff according to Ted -- and appear to be supplying it to various mutual funds and ETFs at times.
Of course SLV is exempt from requiring deposits, as the authorized participants appear to be shorting the shares in lieu of depositing physical metal...something that's been more than apparent since the rally in silver began on Monday. There have been nothing but withdrawals from it since then.
The physical demand in silver at the wholesale level continues unabated -- and obviously picked up even more this past week. Most of what's left in the various public ETFs and mutual funds is not available for sale...including the COMEX, where new silver has to be brought in from other sources [JPMorgan?] to meet the ongoing rabid demand for physical metal. How long this will continue before available supplies are depleted is unknown...but is getting closer to zero with each passing week.
The vast majority of precious metals being held in these depositories are by those who won't be selling until the silver price is many multiples of what it is today. That's particularly true of shareholders in PSLV. However, that big redemption of a week ago or so were a bit of a shocker.
Sprott's PSLV is the third largest depository of silver on Planet Earth with 171 million troy ounces -- and some distance behind the COMEX, where there are 267 million troy ounces being held. However, as Ted Butler mentions from time to time, it's most likely that 103 million troy ounces of that amount is actually held in trust for SLV -- and his letter to the SEC and CFTC on Monday about this issue has yet to be answered. But PSLV is light years behind SLV, as they are the largest silver depository, with 437 million troy ounces as of Friday's close.
The latest short report from Thursday November 9th showed that the short position in SLV declined by 16.76%...down to 16.46 million shares held short. But it's a good bet that the authorized participants have added to their short positions in SLV this past week in lieu of depositing physical metal. If you remember, BlackRock issued a warning a couple of years ago to all those short SLV, that there might come a time when there wouldn't be enough metal for them to cover.
And as you already know, there were a bit over 11 million troy ounces added to SLV about a month ago...some of which have made itself known in the latest short report mentioned above. Where they got it from, or how much they had to pay to get it, is unknown. But most of that deposit still hasn't shown up as a reduction in the short position.
The next short report will be posted on The Wall Street Journal's website on Monday, November 27 -- and one has to hope that more of those 11 million ounces, will be included. But as Ted has mentioned on several occasions, the bullion bank that deposited that silver could be "short against the box" -- and it may not be reported for a while.
Then there's that other little matter of the 1-billion ounce short position in silver held by Bank of America in the OTC market...with JPMorgan & Friends on the long side. Ted says it hasn't gone away -- and he's also come to the conclusion that they're now short around 30 million ounces of gold with these same parties as well...down 7 million oz. from the 37 million they were short in the March OCC Report. You can read Ted's commentary about it linked here.
The latest report from the OCC for Q2/2023 came out about six weeks ago now -- and this is what silver analyst Ted Butler had to say about it..."Bank of America’s total precious metals position declined by 20%, from $101 billion to $82 billion, the first decline I can recall over the past few years, since BofA suddenly emerged as a big player in OTC precious metals derivatives.
Unfortunately, because the OCC report is so (intentionally) opaque, it’s impossible to uncover much as to the details of BofA’s, or for that matter, any bank’s positions. My sense is that the billion oz. silver short position I’ve attributed to BofA is largely intact and would only account for $23 billion of BofA’s $82 billion total precious metals position as of June 30. I would conclude that Bank of America may have finally awoken to the potential financial disaster it created for itself, but far too late to do much good."
![]()
The Commitment of Traders Report, for positions held at the close of COMEX trading on Tuesday, November 14 showed a tiny increase in the Commercial net short position in silver -- and a smallish decline in the commercial net short position in gold.
In silver, the Commercial net short position increased by a tiny 912 COMEX contracts, or 4.560 million troy ounces of of the stuff.
They arrived at that number by increasing their long position by 3,302 contracts -- but also increased their short position by 4,214 COMEX contracts. It's the difference between those two numbers that represents their change for the reporting week.
Under the hood in the Disaggregated COT Report, is where the surprises were, as the commercial traders as a group didn't do much -- and most of the action involved the non-commercials and small traders.
The Managed Money traders, after showing an almost record low gross long position last week, added 5,070 long contracts this past reporting week, plus they covered 1,285 short contracts...for a total of 6,355 COMEX contracts purchased. They are now net long 6,705 contracts -- and are undoubtedly even more long since the Tuesday cut-off.
The traders in the Other Reportables and Nonreportable/small trader categories were the big sellers, as the former reduced their net long position by 2,210 contracts -- and the latter by 3,233 COMEX contracts.
Doing the math: 6,355 minus 2,210 minus 3,233 equals 912 COMEX contracts, the change in the Commercial net short position.
The Commercial net short position in silver now stands at 31,634 COMEX contracts/158.170 million troy ounces...up those 912 contracts from the 30,722 COMEX contracts/153.610 million troy ounces they were short in the November 10 COT Report.
Like in the previous COT Report, the Big 4/8 shorts didn't do much at all during this reporting week, either.
The Big 4 shorts increased their short position by a smallish 601 contracts to 40,447 contracts, up from the 39,846 contracts they were short in the prior week's COT Report.
The Big '5 through 8' shorts decreased their short position by a very decent 953 COMEX contracts, down to 12,809 contracts...their lowest short position ever -- and the 17th consecutive weekly decrease in a row. They've cut their short position by almost half over that time period.
Ted is still of the opinion that there's a Managed Money traders in the No. 7/8 spot -- and that they increased the decreased their short position by around 800 contracts during the reporting week, down to 3,000 contracts from the 3,800 or so they were short last week...about the same amount they increased it during the prior week.
The Big 8 shorts in total decreased their net short position from 53,608 contracts, down to 53,256 COMEX contracts week-over-week...an decrease of 352 contracts. But the Big 8 commercial shorts number is overstated by those 3,000 contracts held by that Managed Money short, so that has to be subtracted out...leaving the Big 8 traders short a bit over 50,000 contracts.
Ted's raptors, the small commercial traders other than the Big 8, net of that managed money trader, sold about 400 long contracts during the reporting week.
Their selling of long contracts has the mathematical effect of increasing the Commercial net short position by that amount, which isn't an increase at all. And as I've mentioned before, these raptors currently hold about half the long position they normally hold at this point in the price cycle.
Don't forget, that despite their small size, they're still commercial traders in the commercial category -- and all in the Swap Dealers category.
Here's Nick's 3-year COT Reportfor silver, updated with the above data. Click to enlarge.
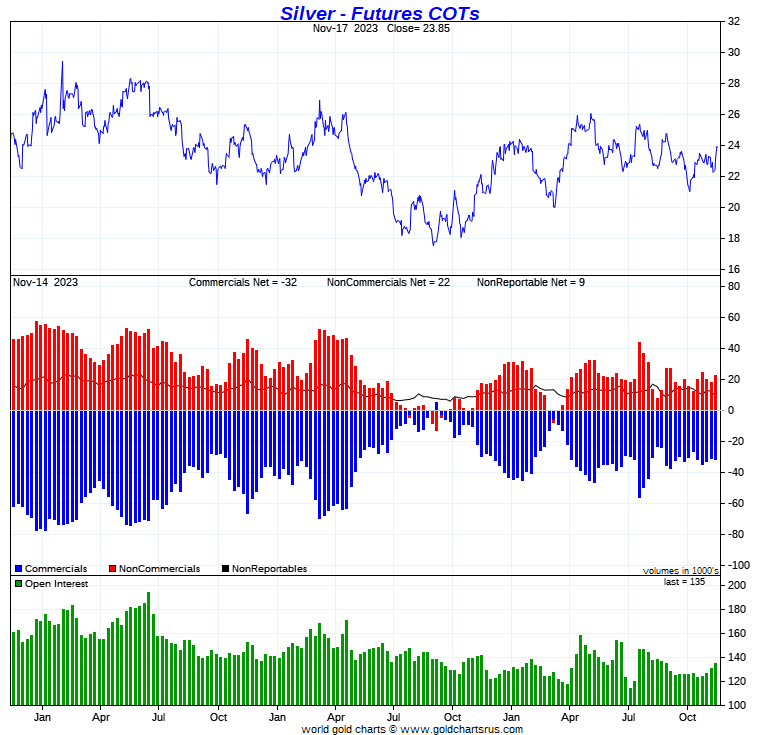
Like last week, this COT Report is very much "yesterday's news" because of the price action since the Tuesday's cut-off.
But, having said that, the stand-outs in this report were the great reluctance of the Big 4 shorts to add to their short position by much -- and the further and ongoing reduction in the short position of the Big '5 through 8' traders.
To add to that, Ted and I are both of the opinion that its only one or two of the Big 4 shorts in silver that are now controlling its price -- and the two remaining traders in that category are, at worst, standing pat or, at best, quietly reducing their short positions along with the Big '5 through 8' traders.
Of course there's been an increase in the Commercial net short position since the Tuesday cut-off, but the tiny changes in total silver open interest during this current silver rally is an indication that there are things going on 'under the hood' that won't be visible until we get a look at the next COT Report.
I was hoping to see signs of that in yesterday's report, but I noted nothing out of the ordinary...except for the fact that Big 8 commercial traders didn't have to do much, as all the big selling came from the Other Reportables and Nonreportable/small traders categories.
The set-up from a COMEX futures market perspective for a continuing and strong rally in silver remains firmly in place...at the discretion of the Big 2 shorts, of course.
![]()
In gold, the commercial net short position declined by 9,072 COMEX contracts ...of which a bit more that 50 percent of that amount was the result of Ted's raptors adding to their long position.
They arrived at that number by increasing their long position by a piddling 77 contracts, but covered 8,995 short contracts -- and it's the sum of those two numbers that represents their change for the reporting week.
Under the hood in the Disaggregated COT Report, it was all Managed Money selling -- and then some, that accounted for the change...which is usually the case. The decreased their net long position by 13,920 COMEX contracts... which meant that the other two categories were buyers -- and they were.
The Other Reportables increased their net long position by 3,080 contracts -- and the Nonreportable/small traders did the same to the tune of 1,768 contracts. These increases in both categories mostly came as a result of them reducing their gross short positions...not by buying long contracts.
Doing the math: 13,920 minus 3,080 minus 1,768 equals 9,072 COMEX contracts, the change in the commercial net short position.
The commercial net short position in gold now sits at 177,019 contracts/ 17.702 million troy ounces of the stuff...down those 9,072 contracts from the 186,091 contracts/18.609 million troy ounces they were short in the November 10 COT Report.
All the commercial traders were buyers last week.
The Big 4 shorts reduced their net short position by a smallish 1,710 contracts, from 153,053 contracts, down to 151,343 COMEX contracts.
The Big '5 through 8' shorts decreased their net short position for the fifth week in a row, from the 64,903 contracts they held short in the November 10 COT Report, down to 62,775 contracts held short in the current COT Report...a decline of 2,128 COMEX contracts. They've decreased their net short position by just about 12,000 contracts over the last eight weeks.
The Big 8 commercial short position declined from 217,956 contracts/ 21.796 million troy ounces, down to 214,118 contracts/21.142 million troy ounces...a rather insignificant decrease of 3,838 COMEX contracts.
That puts Ted's raptors, the small commercial traders other than the Big 8, long 37,099 COMEX contracts, up 5,234 contracts from the 31,865 contracts they were long in the prior week's report.
[So, if you add the 3,838 contracts that the Big 8 bought during the reporting week, to the 5,234 contracts scarfed up by the raptors, that comes to 9,072 COMEX contracts...the change in the commercial net short position. As I keep pointing out, this ain't rocket science.]
Their buying of long contracts had the mathematical effect of decreasing the commercial net short position by that amount which, as you already know, isn't a decrease at all. It's only what the Big 4/8 commercial short do that matters, which is something you already know.
Don't forget that despite their small size, the raptors are still commercial traders in the commercial category -- and are in direct competition with the Big 4/8 shorts for the longs that the Managed Money traders et al. are selling.
Here's Nick Laird's 3-year COT Report chart for gold, updated with the above data. Click to enlarge.
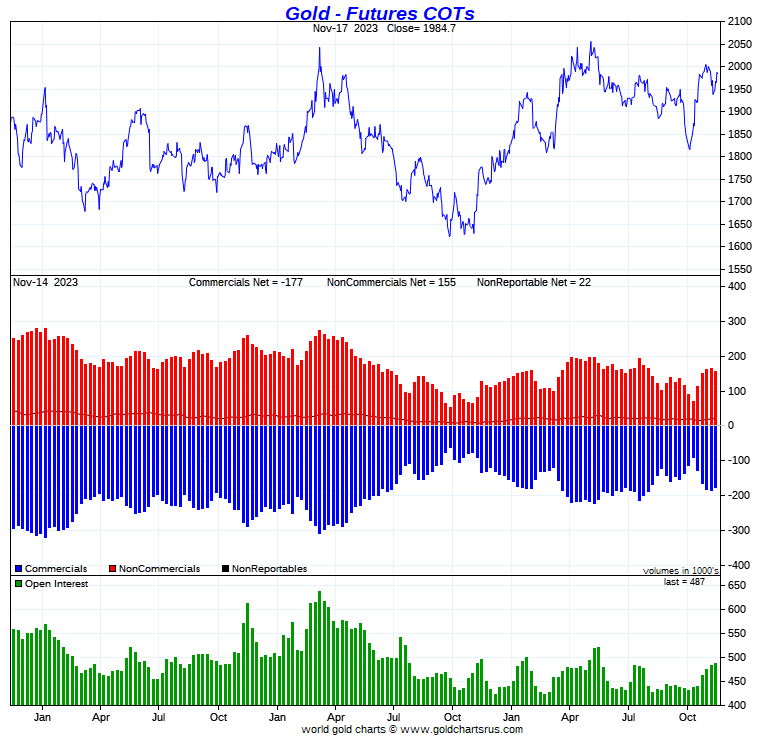
Like the COT Report in silver, this data for gold is also somewhat yesterday's news -- but there should be no doubt in anyone's mind that the commercial traders have been sellers once again into Managed Money buying since the Tuesday cut-off.
From a COMEX futures market perspective, the set-up in gold is still far away from bullish -- and it remains to be seen as to how much room is allowed to the upside in it, before the Big 4 shorts step in to end it.
And I'll point out here that because of U.S. Thanksgiving next Thursday, the next COT Report [for positions held at the close of COMEX trading on Tuesday, November 21] won't be available until Monday, November 27.
![]()
In the other metals, the Managed Money traders in palladium increased their net short position by a further 443 COMEX contracts -- and they're net short palladium by a monstrous 10,945 contracts...40 percent of total open interest. The commercial traders remain very net long palladium in both categories...especially the Swap Dealers. The traders in the Other Reportables and the Nonreportable/small traders are now both net short palladium from a COMEX futures market perspective.
In platinum, the Managed Money traders increased their net short position by an astounding 15,396 contracts during the reporting week -- and are now net short platinum by 17,253 COMEX contracts. The Producer/Merchant category is the only other category net short platinum at the moment -- and they are mega net short to the tune of 17,178 contracts -- and are mostly U.S. bullion banks as per last week's Bank Participation Report. The rest of the categories are net long by very decent amounts...including the Swap Dealers in the commercial category -- and all increased their net long positions by copious amounts during this past reporting week.
In copper, the Managed Money traders increased their net short position by 3,890 contracts during the reporting week -- and are now net short 12,609 COMEX copper contracts...about 315 million pounds of the stuff as of the November 17 COT Report...compared to the 218 million pounds they were net short in the prior week's report.
Copper, like platinum, continues to be a wildly bifurcated market in the commercial category. The Producer/Merchant category is net short 18,664 contracts -- and the Swap Dealers are net long 35,113 COMEX contracts.
Whether this means anything or not, will only be known in the fullness of time. Ted says it doesn't mean anything as far as he's concerned, as they're all commercial traders in the commercial category.
In this vital industrial commodity, the world's banks...both U.S. and foreign...are net long 10.6 percent of the total open interest in copper in the COMEX futures market as shown in last week's Bank Participation Report... down a bit from the 11.6 percent they were net long in October's. At the moment it's the commodity trading houses such as Glencore and Trafigura et al., along with some hedge funds, that are still net short copper in the Producer/Merchant category, as the Swap Dealers are mega net long, as pointed out above.
![]()
Here’s Nick Laird’s “Days to Cover” chart, updated with the COT data for positions held at the close of COMEX trading on Tuesday, November 14. It shows the days of world production that it would take to cover the short positions of the Big 4 — and Big '5 through 8' traders in every physically traded commodity on the COMEX. Click to enlarge.
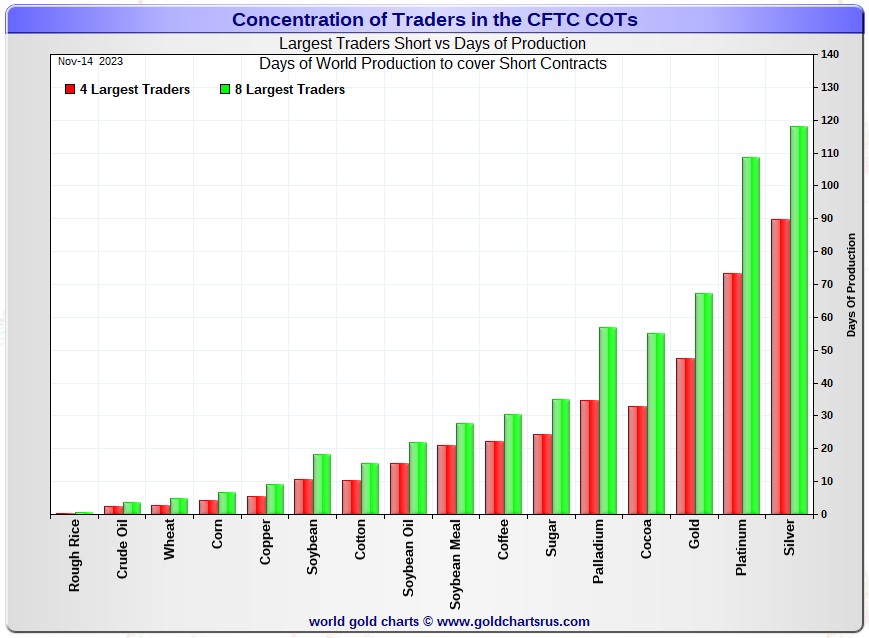
In this week's data, the Big 4 traders are short about 90 days of world silver production...up about 2 days from last week. The ‘5 through 8’ large traders are short an additional 28 days of world silver production ...down about 3 days, for a total of about 118 days that the Big 8 are short...down about 1 day from last week's report.
Those 118 days that the Big 8 traders are short, represents just under 4 months of world silver production, or 266.28 million troy ounces/53,256 COMEX contracts of paper silver held short by these eight traders. Several of the largest of these are now non-banking entities, as per Ted's discovery in last December's Bank Participation Report. November's Bank Participation Report continues to confirm that this is still the case -- and not just in silver, either.
Ted's raptors, the small commercial traders other than the Big 8, decreased their long position down to 21,622 COMEX contracts. But the 3,000 contract short position held by that Managed Money trader that now contaminates the Big '5 through 8' category, has to be subtracted out. Once that is done, the raptors sold about 400 long contracts during the reporting week.
In gold, the Big 4 are short about 48 days of world gold production... unchanged from last week's COT Report. The '5 through 8' are short 19 days of world production, down about 2 days from last week...for a total of 67 days of world gold production held short by the Big 8 -- and obviously down about 2 days from last week.
The Big 8 commercial traders are short 39.5 percent of the entire open interest in silver in the COMEX futures market as of yesterday's COT Report, down a bit from the 40.9 percent that they were short in the November 10 COT Report. And once whatever market-neutral spread trades they have on are subtracted out, that percentage would be something over the 45 percent mark. In gold, it's 44.0 percent of the total COMEX open interest that the Big 8 are short, also down a bit from the 45.0 percent they were short in the November 10 COT Report -- and a bit over the 50 percent mark once their market-neutral spread trades are subtracted out.
And as also mentioned earlier, Ted is still of the opinion that Bank of America is short about one billion ounces of silver in the OTC market, courtesy of JPMorgan & Friends. He's also of the opinion that they're now short 30 million troy ounces of gold, as of the March OCC Report...with the same bunch of JPMorgan & Friends crooks on the long side. That's down 7 million ounces from the 37 million that they were short in the December OCC Report. And as mentioned above, and with the June OCC Report in hand for Q1/2023, Ted feels that BofA's current short position in silver remains "mostly intact".
And as reported last week, the short position in SLV declined from from 19.78 million shares, down to 16.46 million shares in the November 9 short report -- a decrease of 16.76%. The next short report is due out on Monday, November 27.
Most of the 11 million ounce deposited into SLV some time ago, hasn't been reported as of yet. And whether some or all of that shows up in the November 27 short report remains to be seen, because as Ted also pointed out further up, they could be "short against the box" -- and the rest of the 11 million ounce reduction may continue to show up in dribs and drabs as it suits the powers-that-be.
The situation regarding the Big 4/8 commercial short position in gold is still obscene...although the Big '5 through 8' continue to whittle away at theirs.
However, the short position held by the Big '5 through 8' commercial traders in silver is now the lowest on record by a very wide margin. It's now only a couple of members in the Big 4 short category that are keeping a lid on its price.
As Ted has been pointing out ad nauseam forever, the resolution of the Big 4/8 short positions will be the sole determinant of precious metal prices going forward -- except for those whose jobs and so-called reputations depend upon them not seeing it.
I have an average number of stories and articles for you today. Plus I have a very decent number of longish video interviews as well.
![]()
CRITICAL READS
David Stockman on Washington’s Fiscal Doomsday Machine
Here’s one that will make your hair stand on end: The U.S. Treasury closed the books on FY 2023, bringing the four-year cumulative deficit to $9.0 trillion!
That’s right. During the last 1,461 days (FY 2020 thru FY 2023), Uncle Sam has generated $6.2 billion of red ink each and every day including weekends, holidays and snow-days. For anyone keeping score at home, that’s $4.2 million of red ink per minute.
For the purpose of perspective, here’s how long it took to generate the first $9 trillion of U.S. government debt: It took all of 43 presidents and 219 years to reach $9 trillion of public debt in July 2007. So the national debt clock has now accelerated to hyper-drive. Click to enlarge.
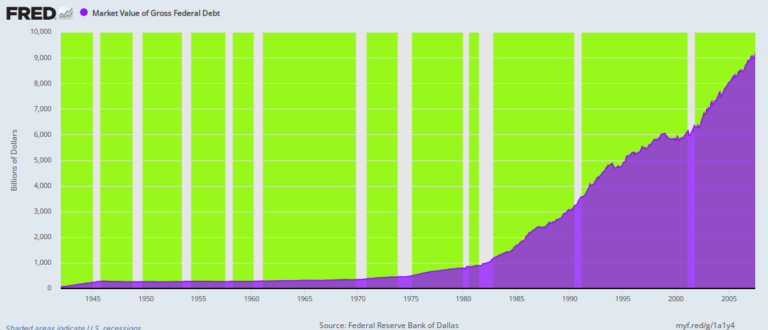
This commentary from David was posted on the internationalman.com Internet site on Friday -- and another link to it is here.
![]()
The most important thing to happen in the financial world so far this century is the sell-off in the U.S. bond market. MarketWatch reports:
An investment in 10-year U.S. Treasury notes has lost a third of its value, in real, inflation-adjusted terms, in just over three years. Investments in long-term Treasuries have lost about half their value. They have fallen as much as U.S. stocks did during the global financial crisis.
10-year Treasury bonds have been a worse investment than gold bullion this year, last year, the year before that, and all the way back to 2018.
U.S. 10-year Treasury notes have actually underperformed gold for the last 33 years. According to data reported by MarketWatch, if you’d put $10,000 into 10-year Treasuries in 1990, adjusted for inflation, you’d have approximately doubled your money. Holding gold, on the other hand, would have given you a little profit – about 15% more than if you had simply held Treasuries.
Dear Imprudence
Gold enjoys no ‘full faith and credit’ of the U.S. government. No one backs it. No grand empire issues it or guarantees to pay interest on it. It issues no press releases, pays no dividends, has no DEI director…and doesn’t give a damn what you think. And yet this ‘nothing’ of an investment has proven more valuable than the strongest credit ‘the West’ had to offer.
And in America’s publicly traded businesses, an investor might have fared even worse. Stocks have roughly tripled in this century. The broadest index, the Wiltshire 5,000, has risen from 13,800 in 1999 to around 45,191 today. But gold has gone from an average around $270/oz. to $2,000/oz. today – a 7 times increase.
This worthwhile commentary from Bill put in an appearance on his website early on Friday afternoon EST -- and I thank Roy Stephens for passing it along. Another link to it is here. Gregory Mannarino's post market close rant for yesterday is linked here -- and runs for about 19 minutes.
![]()
I believe tighter financial conditions will be necessary to reduce inflation risk. And conditions were tightening throughout September and October. But, once again, when tighter conditions begin to translate into softer market and economic backdrops, markets become susceptible to powerful squeeze dynamics – the unwind of short positions and the reversal of hedges. And in this hyper-speculative marketplace, squeezes quickly entice aggressive “FOMO” performance-chasing buying.
This week provided further evidence of extraordinary correlations – across various markets and globally. Whether it’s “risk on” or “risk off” – it is a highly synchronized world. Major equities indices this week were up 4.5% in Germany, 4.2% in Spain, 3.5% in Italy, 3.5% in Brazil, 3.1% in Japan, and 2.8% in Mexico. Ten-year yields dropped 23 bps in the UK and 22 bps in Italy. EM (local currency) yields dropped 36 bps in Chile, 34 bps in South Africa, 30 bps in Colombia, 28 bps in Brazil, and 24 bps in Hungary. EM currencies were squeezed higher, as dollar bulls took one on the chin. In China, Asia, Europe and the U.S., bank CDS prices have moved sharply lower.
Stocks are always good for upside surprises. And with all the derivatives, hedging, speculating, and leveraging, we shouldn’t be surprised by wild CDS and currency market volatility. But it’s the bond market that I find fascinating. There will be ebbs and flows. Treasuries and MBS were overdue for a “rip your face off” squeeze. But there will be a couple more Trillion of Treasuries to sell over the next year, in the face of more QT and waning international demand. And “risk on” only heightens the risk of upside surprises in economic growth and inflation.
The bottom line is that when the bond market approaches the point of imposing some desperately needed discipline (in the markets and Washington), a confluence of squeezes, unwind of hedges, speculative flows and leveraging spurs looser conditions. Enjoying the whole loosening experience, Gold jumped 2.1% this week and Silver surged 6.5%.
But I expect the bond market to push back against “risk on.” With $2 TN annual deficits as far as the eye can see, it's either begin imposing discipline or watch inflation and supply eat away at system stability.
This commentary from Doug showed up on his website late on Friday night PST -- and another link to it is here.
![]()
Former U.N. weapons inspector Scott Ritter interviewed by Mike Adams on the Israeli-Hamas war
This 47-minute video interview from a week ago, another one where Scott pulls no punches, comes to us courtesy of Mike Rekus -- and another link to it is here.
Dr. Dave Janda sent me an interview he did with Commander Scott Snow about the Israel/Hamas war. Scott is a retired F-14, F-16 & F-18 fighter pilot -- and also ran all aviation operations for the carrier groups in the Pacific, plus was in charge of operations for The Top Gun Program. This interview runs for 50 minutes. I've watched both of them in their entirety -- and thought them both very worthwhile, as both are more than qualified to speak to this issue. The link to the Snow/Janda interview is here.
![]()
Pepe Escobar on the Neocons' new low in Gaza, as NATO pivot from the Ukraine
Journalist and geopolitical analyst Pepe Escobar joins Danny Haiphong to discuss the latest developments in Gaza, Ukraine, the Belt and Road Initiative as the multi-polar world faces unprecedented challenges.
This video runs for 2 hours and 23 minutes. I watched about an hour of it, before packing it in...but you'll get the gist of it in the first 28 minutes -- and it's certainly worthwhile up until then. Once you get past that point, it's up to you whether you wish to continue. I thank George Whyte for sending it to me last Saturday -- and for obvious reasons, it had to wait for today's column. Another link to it is here.
![]()
Is Gold About to Take Off? -- Alasdair Macleod
The technical position for gold is looking very positive for higher prices. But technical analysis should be backed by fundamentals.
To a large extent, fundamentals are in the eye of the beholder, whose opinions in any situation can vary from positive to negative and everything in between. But even for the economic optimists, there are gathering clouds on the horizon likely to continue undermining the global economic outlook, the dollar, and all financial asset values. Fiat currencies are being downgraded relative to real money, which is gold.
Current thinking is that inflation is a diminishing problem and that the interest rate spike is over. In this article, I point out where inflation expectations err and the mistake of believing that interest rate control is the solution.
It follows therefore that G7 debt traps are a more serious problem than generally realized. Furthermore, China and Russia are aware of the likely impact of current events on G7 currencies, and this is why they have accumulated hidden gold reserves.
In short, we face a transition between failing fiat and emerging gold-backed currencies, which might explain why gold’s technical position looks so positive.
Well, dear reader, I skimmed this short novel -- and there's not a word in it about the real price driver for gold -- and that's the ongoing shenanigans in the COMEX futures market by the Big 4 commercial shorts. So this article from the schiffgold.com Internet site should be read with that in mind...as fundamentals and technical analysis means nothing in a managed market... something you're already well aware of. I found this in a GATA dispatch on Thursday, but thought it best to wait until today to post it. Another link to it is here.
![]()
Record industrial demand will continue to dominate the silver market and will be the most significant factor behind the precious metal’s third straight annual deficit, according to the latest update from Metals Focus on behalf of the Silver Institute.
While industrial demand is expected to hit record highs this year, total global physical demand is expected to ease slightly to 1.14 billion ounces, down 10% from the record set in 2022.
“Gains in industrial applications will be offset by losses in all other key segments,” the analysts at Metals Focus said in their updated research. “Despite the fall, total demand remains elevated by historical standards, making the 2023 figure the second highest in Metals Focus’ data series.”
The silver market’s strongest pillar is expected to grow by 8% to a record 632 million ounces this year.
“Key drivers behind this performance include investment in photovoltaics, power grid and 5G networks, growth in consumer electronics, and rising vehicle output,” the analysts said.
Despite record amounts of silver flowing into industrial applications, investor demand remains a critical missing piece of the market.
Metals Focus noted that physical demand from the investment sector is expected to fall 21% to 263 million ounces, representing a three-year low.
This silver-related article appeared on the kitco.com Internet site on Thursday -- and I found it on Sharps Pixley. Another link to it is here. The data from which the above article is derived came from the Silver Institute on Wednesday. It's headlined "Global Silver Industrial Demand Forecast to Achieve New High in 2023" -- and linked here. I found that on Sharps Pixley as
![]()
The Photos and the Funnies
After the photo shoot in the mountain gap between Seton Lake and Lillooet on May 22, we headed out of town and north down B.C. Highway 99 and, as we always do without fail, we stopped at the lookout along the highway that overlooks the Fraser River and the town. These three shots are a left-to-right panorama of the part of the town that's on the bench on the west bank of the river. The mountain gap we'd been at a few minute earlier is just left of center in the distance in the first photo. Click to enlarge.


![]()
The WRAP
"Understand this. Things are now in motion that cannot be undone." -- Gandalf the White
![]()
Today's pop 'blast from the past' was supposed to be in last week's column, but I got sidetracked by something else, so here it is now. The song was released as the lead single from her Totally Hot album in October 1978 and became a worldwide hit. The artist and tune will be instantly recognizable for most -- and the link is here. Of course, there's a bass cover to this -- and that's linked here.
Today's classical 'blast from that past' is one I've posted before, but it's been a very long time -- and is due for a revisit. It's Ludwig van Beethoven's Piano Sonata No. 23 in F minor, Op. 57 (colloquially known as the Appassionata, meaning "passionate" in Italian) -- and is among the three famous piano sonatas of his middle period. It was composed during 1804 and 1805, and perhaps 1806, and was dedicated to Count Franz von Brunswick -- and is considered one of the greatest and most technically challenging of all piano sonatas...which it is.
The last time I posted this work, I featured the incredibly gifted concert pianist Valentina Lisitsa -- and here she is again. The link is here.
![]()
The dollar index 'rally' that began at 2:55 p.m. China Standard Time on their Friday morning didn't bother the precious metals, as they continued to rise in tandem -- and they continued on that path as the DXY rolled over starting about 8:05 a.m. in London.
If that trend had been allowed to continue, all four would have finished the Friday trading session at heaven only knows what prices, so the commercial traders of whatever stripe stepped in with a vengeance. By the COMEX close, all of gold and silver's prior gains had vanished...plus a bit more.
Both were closed lower in the December contract, their respective current front months...gold by $2.60 -- and silver by 8 cents. Platinum wasn't spared either, as 'da boyz' closed it down $1.10 the ounce in the January contract. Only palladium was allowed to close higher on the day.
But with ultra-light volume in all four precious metals, those with an interest in engineering their prices lower, had little difficulty in doing so...regardless of what was happening in the currency market.
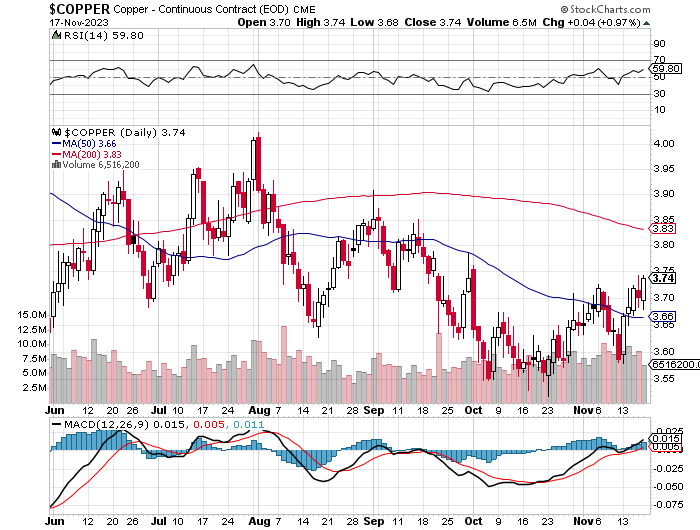
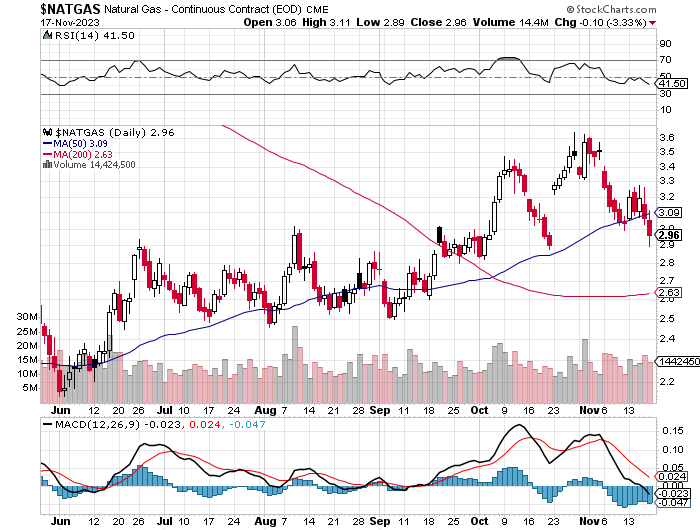
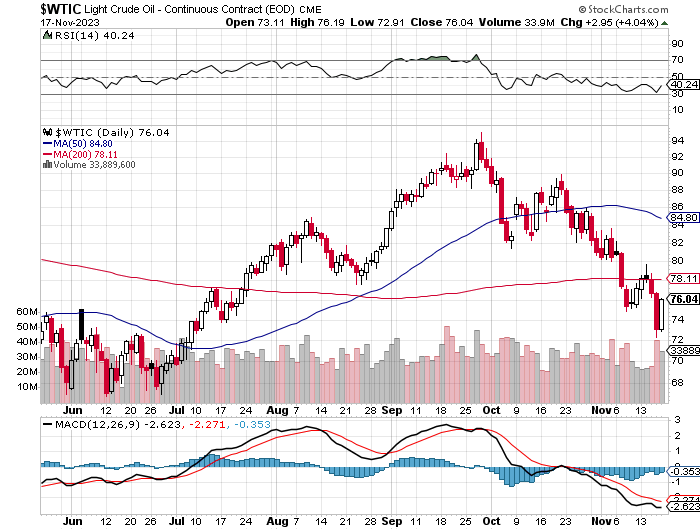
Copper managed to close up 4 cents at $3.74/pound...natural gas [chart included] was closed lower by a further 10 cents -- and below its 50-day moving average for the second day in a row. WTIC managed to gain back most of Thursday's inexplicable sell-off, as it gained $2.95/barrel, but is still below any moving average by a goodly amount.
Here are the 6-month charts for the Big 6+1 commodities, thanks to stockcharts.com as usual and, if interested, their COMEX closing prices in their current front months on Friday should be noted. Click to enlarge.
Yesterday's price action in the precious metals should leave no doubt in anyone's mind that the large commercial traders, mostly bullion banks, retain their iron grip on their respective prices.
The set-up for higher prices from a COMEX futures market perspective is still firmly in place for silver, but far from that in gold...despite the slight improvements shown in yesterday's COT Report...which are most likely out the window since the Tuesday cut-off.
But in the silver market overall, there are a lot of pieces in motion no matter where one cares to look...all of which are wildly bullish for its price. The list begins with the almost nonexistent silver movement in COMEX warehouse stocks this past week, which I've been reporting on -- and Ted mentioned on the phone yesterday.
Next is the non-existent changes in total open interest in silver all this week, despite its ongoing rally.
Then there are the big silver withdrawals [4.4 million ounces] out of SLV this week...plus the silver shipped out of other silver ETFs and mutual funds as well. No amount of silver worthy of the name has been deposited in SLV since October 23 -- and it's a given that it's owed more metal since its big rally began on Monday. But all we've seen so far are withdrawals from it for most of the week.
Then there's the mystery of the 1,439,000 silver eagles produced so far this month. Who is buying those, one has to wonder...as it certainly isn't John Q. Public.
And not to be forgotten were the approximately 61 million troy ounces that India imported during October -- and the question has to be asked as to where that all came from considering that the silver market is in a structural deficit. Inquiring minds, including yours and mine, would love to know. One has to suspect that it came from JPMorgan & Friends.
Glancing back at yesterday's COT Report one more time, the Big '5 through 8' commercial traders have been quietly reducing their short position in silver... down another 953 contracts this week...to only 12,809 COMEX contracts between them...the 17th consecutive week of declines. And that's despite all the price machinations in that precious metal over that period.
In gold, it's been eight weeks of consecutive declines in the Big '5 through 8' short position. As I mentioned further up, it's now my opinion that only one or two of the Big 4 commercial shorts are active on the short side in either of these precious metals -- and maybe platinum as well. The rest of the Big 8 shorts appear to be quietly heading for the exits.
As I've pointed out before, this 50+ price management scheme has to end sooner or later -- and it appears that they're winding it down as quietly as possible.
But, having said that, there's no way that when the end finally comes, that there won't be a massive rally and repricing of all the precious metals, plus the rest of the commodity complex...as that's already baked in the cake. But by proceeding in this manner, it will limit the damage to most of the Big 8 shorts. However, as I just said, there's a day or reckoning coming and it will be like Hemingway's comments about bankruptcy..."slowly at first, then suddenly".
We're obviously still in the "slowly at first" phase, much to our chagrin, but there's no way on God's green earth that the "suddenly" moment can be avoided when the end finally arrives.
That's why I'm convinced that the moment that things go completely non-linear in the Far East, which is certainly coming at some point...courtesy of the West's power elite...it will be used as cover for that "suddenly" moment that most of us have been waiting decades for.
However, considering the world-wide ramifications of such an event, or series of them, one should be careful of what we wish for.
I'm still "all in" -- and will remain so to whatever end.
That's it for the day -- and the week -- and I'll see you here on Tuesday.
Ed
About the author

SUBSCRIBE: https://edsteergoldsilver.com/

Ed Steer’s Daily Analysis of the Gold and Silver Markets
After eight years of writing about the precious metals for Casey Research, the folks at Stansberry & Associates—who just recently purchased controlling interest in the company—decided that my ‘niche market’ column didn’t fit into their plans.
Since the time that Casey Research was kind enough to offer me a stand-alone column, it became their most highly-rated blog almost from the outset—and has remained that way up to this date...