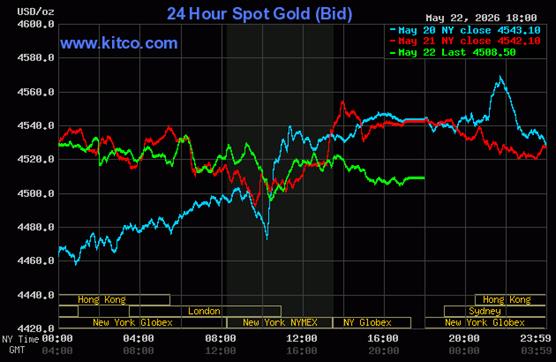
Gold was under quiet and somewhat uneven price pressure starting right at the Globex open in New York on Thursday evening -- and that lasted until around noon in London on their Friday. It chopped a bit higher from that point until the collusive commercial traders of whatever stripe put in an appearance around 9:10 a.m. in COMEX trading in New York -- and it was then sold/ engineered lower anew until 10:25 a.m. EDT. Its two rally attempts to get it above $4,525 spot were both capped -- and from the 1:30 p.m. COME close onwards, it was sold lower anew until around 3:10 p.m. EDT. From that juncture it chopped quietly sideways until trading ended at 5:00 p.m.
The high and low ticks in gold were recorded as $4,547.00 and $4,488.00 spot...an intraday move of $59.00 an ounce. The June/August price spread differential in gold at the close in New York yesterday was $33.20...August/ October was $32.30 -- and October/December was $34.70 an ounce.
Gold was closed in New York on Friday afternoon at $4,508.50 spot...down $33.60 on the day -- and $17.30 off its Kitco-recorded low tick. Net volume was the lowest I've ever seen, at a hair under 59,000 contracts -- and there were 49,500 contracts worth of roll-over/switch volume out of June and into future months...almost all into August.
I saw that 40 gold, plus 20 silver contracts were traded in May yesterday and, as is always the case, it remains to be seen just how much of these amounts show up in tonight's Daily Delivery and Preliminary Reports further down in today's column.
![]()
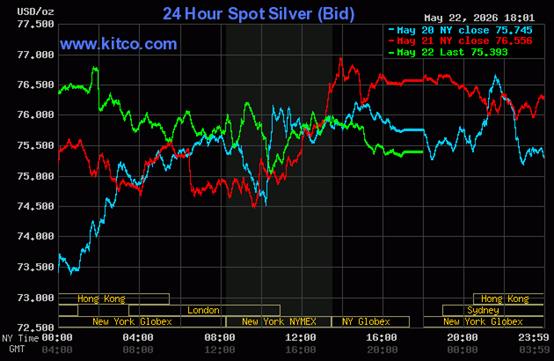
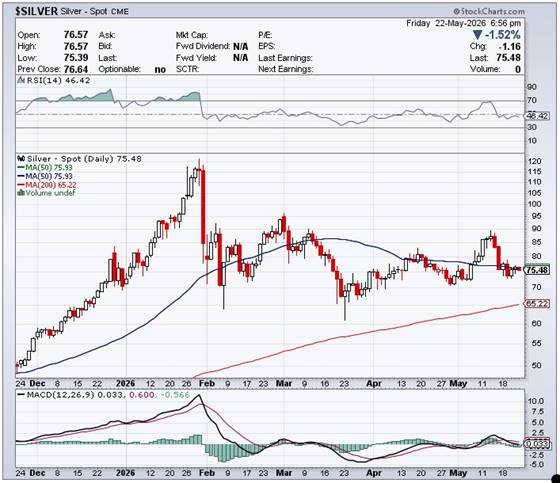
Silver was sold/engineered broadly and unevenly lower until 8:40 a.m. in COMEX trading in New York -- and its sharp rally from that point also ran into 'da boyz' at 9:10 a.m. EDT. Its engineered low tick was also set at 10:25 a.m. -- and from that juncture its price was also managed in the exact same manner as gold's until trading ended at 5:00 p.m. EDT.
The high and low ticks in silver were reported by the CME Group as $77.415 and $75.265 in the July contract...an intraday move of $2.15 an ounce. The May/July price spread differential in silver at the close in New York yesterday was 30.6 cents...July/September was 57.1 cents -- and September/December was 81.6 cents an ounce.
Silver was closed on Friday afternoon in New York at $75.39 spot...down $1.16 on the day -- and 53 cents off its Kitco-recorded low tick. Net volume in it was also the lowest I've ever seen, at a microscopic 21,700 contracts -- and there were 4,600 contracts worth of roll-over/switch volume in this precious metal.
![]()
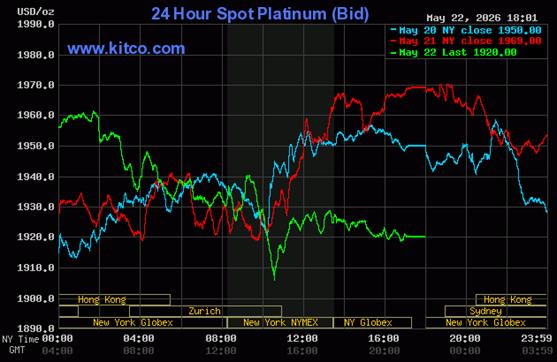
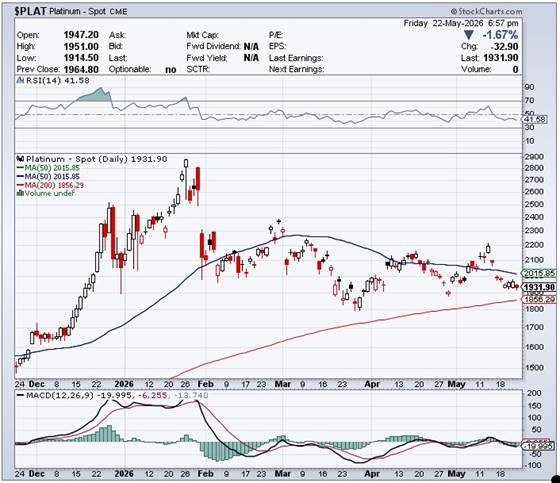
Platinum's price path was also managed in a similar fashion as gold's -- and it rally in very early COMEX trading in New York was crushed starting around 9:15 a.m. Then from about 10:40 a.m. EDT, it rallied at an ever-decreasing rate until shortly before the 1:30 p.m. COMEX close. It was then sold a tad lower until trading ended at 5:00 p.m. EDT. Platinum was closed at $1,920 spot...down 49 dollars on the day -- and 14 bucks off its Kitco-recorded low tick.
![]()
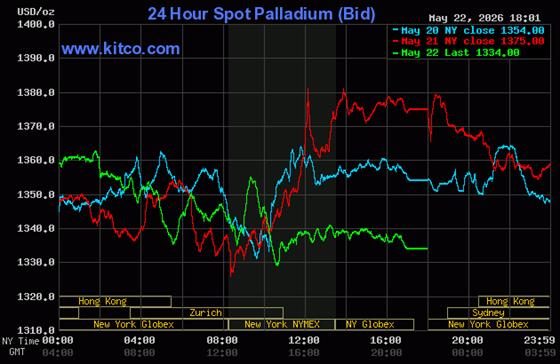
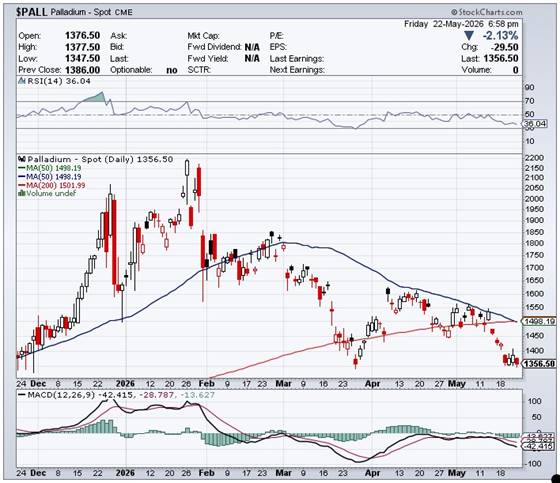
It was ditto for palladium -- and 'da boyz' closed it at $1,334 spot...down 41 bucks from Thursday -- and only 8 dollars off its Kitco-recorded low tick.
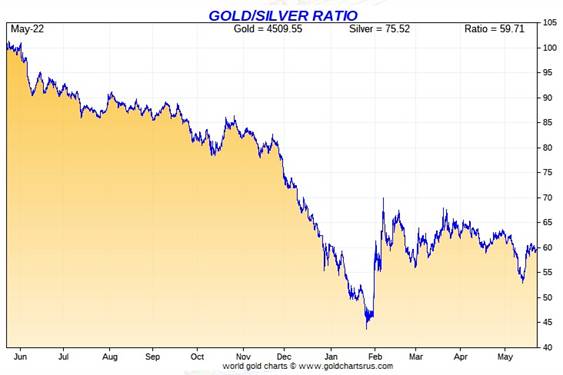
Based on the kitco.com spot closing prices in silver and gold posted above... the gold/silver ratio worked out to 59.8 to 1 on Friday...compared to 59.3 to 1 on Thursday.
Here's the 1-year Gold/Silver Ratio chart from Nick Laird -- and updated with this past week's data. Click to enlarge.
![]()
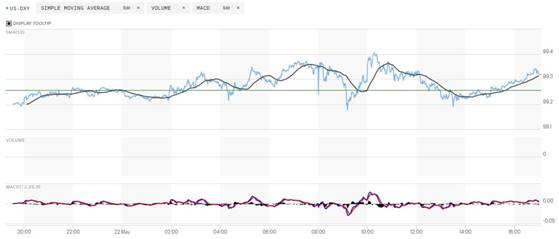
The dollar index closed very late on Thursday afternoon in New York at 99.26 -- and then opened lower by 6 basis points once trading commenced at 7:32 p.m. EDT on Thursday evening...which was 7:32 a.m. China Standard Time on their Friday morning. It then wandered/chopped broadly and unevenly higher ...with one big pothole along the way at 9:10 a.m. EDT...the New York high ticks in all four precious metals. It then rallied until around 10:17 a.m... chopped quietly lower until the 1:30 p.m. COMEX close -- and then edged quietly higher until trading ended at 5:00 p.m. EDT.
The dollar index finished the Friday trading session in New York at 99.24...down 2 basis points from Thursday -- and 8 basis points below its indicated close on the DXY chart below.
Here's the DXY chart for Friday...thanks to marketwatch.com as usual. Click to enlarge.
![]()
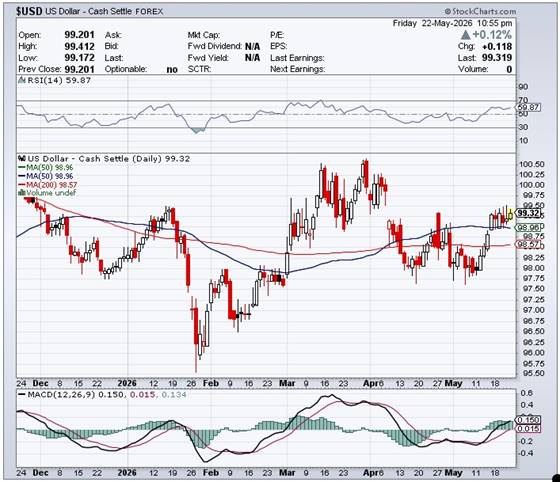
Here's the 6-month U.S. dollar index chart...courtesy of stockcharts.com as usual. The delta between its close...99.32....and the close on DXY chart above, was 8 basis points above that. Click to enlarge.
![]()
U.S. 10-year Treasury: 4.5580%...down 0.0280/(-0.61%)...as of the 1:59:53 p.m. CDT close
The ten-year made it up to the 4.5860% mark by 9:50 a.m. CDT/10:50 a.m. EDT on Friday morning -- and it certainly looks like the Fed stepped in at that point.
For the week, the U.S. ten-year treasury was finished lower by 37 basis points from its close last Friday -- and only closed lower on the week because of the continuing intervention by the Fed.
Here's the 5-year 10-year U.S. Treasury chart from the yahoo.com Internet site -- which puts the current yield into a somewhat longer-term perspective. Click to enlarge.
It still hasn't been allowed to take out its 4.92% high of October 15, 2023 -- and it's more than obvious that if the Fed hadn't been mucking about in the treasury market, buying up everything being offered over the last several months, it's yield would be massively above that mark by now.
![]()
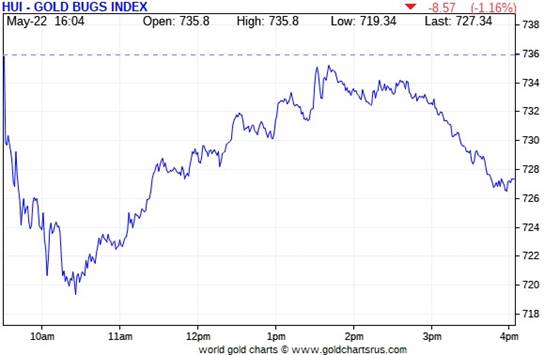
The gold equities were sold lower the moment that the equity markets opened in New York at 9:30 a.m. on Friday morning -- and that sell-off ending around 10:25 a.m. EDT when 'da boyz' set gold's engineered low tick of the day. The shares then rallied until 1:45 p.m. -- and then headed lower until around 3:50 p.m. when a little bottom fishing appeared. The HUI closed lower by 1.16 percent.
![]()
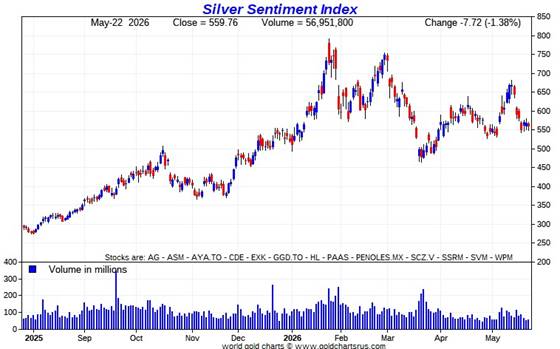
The price path of the silver stocks was identical to that of the gold equities -- and Nick Laird's Silver Sentiment Index closed down 1.38 percent. Click to enlarge.
![]()
The biggest star yesterday was Aya Gold & Silver...as it closed up on the day by 2.46 percent -- and the biggest underperformer was Peñoles...as it got hit by 4.23 percent.
There was this news from Silvercorp Metals yesterday.
Silver was closed lower by 1.52% on Friday -- the Silver Sentiment Index was closed down 1.38% -- and Sprott's PSLV finished the day down 1.74%
Gold was closed down 0.74%...the HUI closed lower by 1.16% -- and Sprott's PHYS closed down 0.76%
The Shanghai/U.S. price premium in silver was 11.85 percent on their Friday.
The reddit.com/Wallstreetsilver website, now under 'new' and somewhat improved management, is linked here. The link to two other silver forums are here -- and here.
![]()
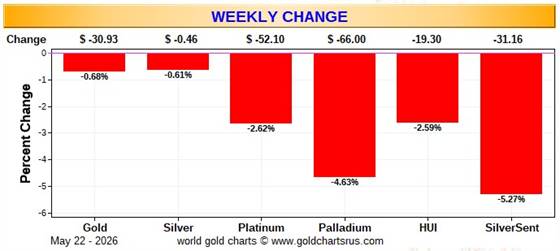
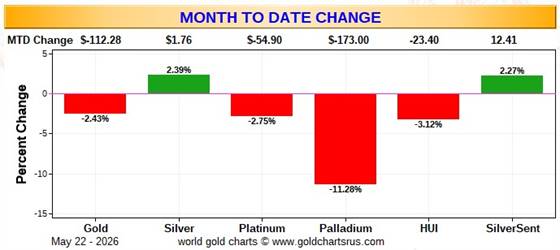
Here the usual three charts that appear in this spot in every weekend missive. They show the changes in gold, silver, platinum and palladium in both percent and dollar and cents terms, as of their Friday closes in New York — along with the changes in the HUI and the Silver Sentiment Index.
Here's the weekly chart -- and thanks to the current 'wash, rinse & spin' cycle that broke out this past week, it's wall-to-wall red for the second week in a row. The ugly standout is the dismal performance of the underlying equities vs. the declines in their underlying precious metals. Click to enlarge.
Here's the month-to-date chart -- and I'm amazed to see that the stocks remain up, while both silver and gold are down a bit. But with all paper machinations going on, I'm not prepared to read too much in this...or the weekly chart, either. Click to enlarge.
Here's the year-to-date chart -- and 'da boyz' now have both platinum and palladium down year-to-date. The standout feature, like in the weekly and month-to-date charts is the underperformance of the precious metal equities once again -- and this is another chart that I'm not prepared to read too much into, either...but I have a lot more about this in The Wrap. Click to enlarge.
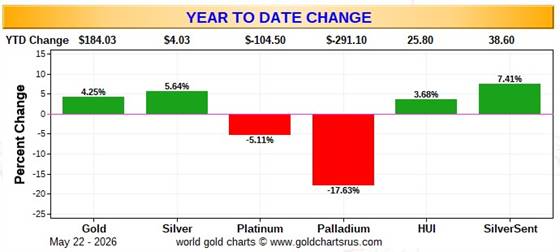
Despite the fact that silver has now broken the $120 barrier...albeit briefly -- and the silver well in London came close to running dry last October...the gold/silver ratio remains at a farcical 59.8 to 1 as of Friday's close. The 'normal' and historical ratio is around 15 to 1...which would put silver at around $300 based on gold's closing price on Friday. And if priced at the ratio of 7:1 that it comes out of the ground at, compared to gold...that would put silver at around $645 an ounce. So a rather impressive triple-digit silver price is in our future...most likely somewhere between those two numbers.
As I say in this spot every Saturday...all that remains to be resolved is what that price will be -- and how soon 'da boyz' allow it to happen. Its first attempt to reach one of these values back at the end of January was obviously crushed ...as were all the rest since then. But in the face of the continuing structural deficit in silver -- and all the other stuff going on in the world today, they can't keep it up forever.
But no matter how you slice it or dice it, the precious metal stocks continue to underperform their underlying precious metal by a wide margin. As I've been going on about for at least six months, is that the precious metal shares are being actively managed as well -- and I go into this in great detail in The Wrap.
![]()
The CME Daily Delivery Report for Day 18 of May deliveries showed that 36 gold -- and 3 silver contracts were posted for delivery within the COMEX-approved depositories next Wednesday.
In gold, the two biggest of the three short/issuers in total were Wells Fargo Securities and ADM...issuing 20 and 13 contacts respectively...the former from their house account. The two largest long/stoppers of the three in total were French bank BNP Paribas and JPMorgan, picking up 24 and 9 contracts for their respective client accounts.
In silver, the sole short/issuer was ADM out of its client account -- and BNP Paribas and JPMorgan picked up 2 and 1 contracts for their respective client accounts.
In platinum, there was 1 contract issued and stopped.
But the copper deliveries continue to impress, as a further 1,352 contracts/ 33.800 million pounds were issued and stopped. Month-to-date an eye-watering 16,588 copper contracts issued and stopped.
The link to yesterday's Issuers and Stoppers Report is here.
Month-to-date there have been 6,609 gold contracts issued and stopped -- and that number in silver is 5,684 COMEX contracts.
Back on First Day Notice for May deliveries, there were 3,937 gold contracts still open -- and in silver, that number was 6,299 COMEX contracts. So gold deliveries have far exceeded silver deliveries in May, even though May is a scheduled delivery month for silver -- and isn't for gold.
The CME Preliminary Report for the Thursday trading session showed that gold open interest in May fell by 230 contracts, leaving 824 still open... minus the 36 contracts out for delivery on Wednesday as per the above Daily Delivery Report. Thursday's Daily Delivery Report showed that 263 gold contracts were actually posted for delivery on Tuesday...so that means that 263-230=33 more gold contracts were added to May deliveries.
Silver o.i. in May declined by 5 contracts, leaving 739 still around...minus the 3 contracts out for delivery on Wednesday as per the above Daily Delivery Report. Thursday's Daily Delivery Report showed that zero silver contracts were posted for delivery on Tuesday...so that obviously means that 5 silver contracts disappeared from the May delivery month.
Total gold open interest in the Preliminary Report on Friday night rose by 8,793 COMEX contracts -- and I suspect that all of this amount will have disappeared when the final report from the CME Group shows up on their website later on Tuesday morning CDT. Total silver o.i. rose by a scant 226 COMEX contracts.
There are only two delivery days left in May...next Thursday and Friday -- and still a lot of open interest remaining in both silver and gold -- and I'll be particularly interested in who the short/issuers are...as there's no financial incentive for them to delay deliveries. In fact, its in the shorts best interest to deliver as early as possible in the delivery month.
[I checked the final change in total open interest for gold on Thursday -- and it showed the hoped-for huge decline...from +5,674 COMEX contracts, down to -4,059 contracts. The final change in total silver o.i. for Thursday showed a smallish decline...from +454 contracts, down to +302 COMEX contracts.]
Gold open interest inJune in Friday morning's final report from the CME Group [for Thursday] cratered by a further 31,155 contracts, leaving 135,311 contracts still open -- and silver o.i. June declined by 44 contracts, leaving 2,845 contracts still around.
![]()
After a deposit into GLD on Thursday, there was a withdrawal on Friday, as an authorized participant removed 91,811 troy ounces of gold. But there was a deposit into SLV, as an a.p. added 1,131,018 troy ounces of silver to it.
The SLV borrow rate showed one data point for Friday -- and that was 0.38%...with 10.0 million shares available. The GLD borrow rate began the day at 0.28% -- and finished it at 0.29%...with 7.1 million shares available.
In other gold and silver ETFs and mutual funds on Earth on Friday... net of any changes in COMEX, GLD and SLV activity, there were a net 225,665 troy ounces of gold removed -- and all because of the 235,829 troy ounces withdrawn from UBS. There were a net 421,907 troy ounces of silver removed as well -- and all because of the 1,200,000 troy ounces withdrawn from UBS as well.
These were such big changes that I fired an e-mail off to Nick Laird asking about these UBS withdrawals -- and his answer was..."I have not been able to get their data for the last couple of months & today managed to get an update. Hopefully the problem is fixed with them."
![]()
The only activity in gold over at the COMEX-approved depositories on the U.S. east coast on Thursday were the 10,062 troy ounces that ended up in JPMorgan's 'Enhanced Delivery' sub-depository. Nothing was shipped out.
There was a lot of paper activity, involving five different depositories -- and it all netted out to 52,919 troy ounces getting transferred from the Registered category and back into Eligible. The largest amount involved were the 58,562 troy ounces transferred in that direction over at Brink's, Inc.
The link to Thursday's COMEX gold activity is here.
There was huge silver activity, as 605,421 troy ounces/one truckload was dropped off at Asahi -- and 1,399,972 troy ounces were shipped out.
The largest 'out' amount by far were the two truckloads/1,200,607 troy ounces that departed Brink's, Inc...with the remaining 199,365 troy ounces leaving Manfra, Tordella & Brookes, Inc.
There was no paper activity -- and the link to all of Thursday's COMEX silver action is here.
The Shanghai Futures Exchange updated their silver inventories as of the close of business on their Friday -- and it showed that a net 93,141 troy ounces/ 2.897 tonnes of silver were withdrawn... leaving their silver inventories at 31.726 million troy ounces/986.791 metric tonnes.
![]()
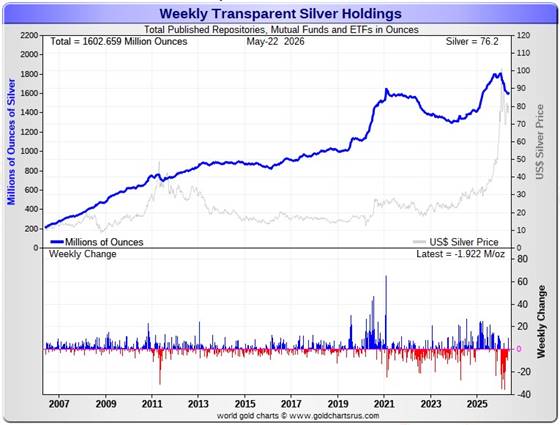
Here are the usual 20-year charts that show up in this space in every weekend column. They show the total amounts of physical gold and silver held in all known depositories, ETFs and mutual funds as of the close of business on Friday. Click to enlarge.
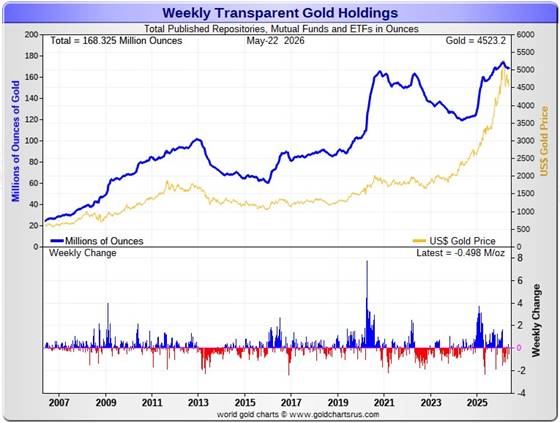
During the business week just past, there were a net 498,000 troy ounces of gold withdrawn -- along with a net 1.922 million troy ounces of silver. The reason that these number are as negative as they are is because of those big one-time adjustments over at UBS that Nick reported a bunch of paragraphs ago in today's missive.
According to Nick Laird's data on his website, a net 136,051 troy ounces of gold were removed from all the world's known depositories, mutual funds and ETFs during the last four weeks. The two biggest 'in' amounts were the 342,401 troy ounces that went into Tether...followed by the 166,628 that went into two new Swiss gold ETFs. And lastly were the 119,602 troy ounces that went into various and sundry Chinese ETFs. The largest 'out' amount by far were the 545,000 troy ounces that left the COMEX...followed by the 166,950 and 164,367 troy ounces withdrawn from GLD and UBS respectively.
The amount of gold in all the world's ETFs and mutual funds remains barely above its old all-time high of late 2020...see the above chart. But it should be far higher...considering gold's current price...far more than double it was back then. Why it isn't, is beyond me.
But a net 1.885 million troy ounces of silver were added during that same 4-week time period...the first positive 4-week number since late December of 2025.
The largest two 'in' amounts were the 1.919 million and 1.804 million troy ounces into SLV and Sprott's PSLV respectively...followed by the 1.307 million troy ounces into Aberdeen. And lastly were the 880,000 troy ounces added to iShares/SSLN.
The largest 'out' amounts were the 1.326 million oz. out of the COMEX... followed by the 1.205 and 1.200 million oz. withdrawn from India's various silver ETFS -- and UBS respectively.
I'm delighted to see that silver has turned the corner to the upside in all the world's depositories, ETFs and mutual funds...as there's been virtually continuous withdrawals from almost all of them since the start of the year... mostly because of the withdrawals from the COMEX and SLV. Let's hope it lasts.
But it should be noted that the amount of silver held in all these depositories, ETFs and mutual funds remains below its old all-time high inventory level of January 2021. But it should be far higher than it is as well, because silver is about 2.8x the price it was back then.
Back at its previous inventory peak in late January 2021, silver was around $27 an ounce. Now its about 46 bucks higher. Why the precious metal ETFs aren't doing better is a mystery for which I have no answer.
Retail demand remains very quiet -- and there are few 'out of stock' signs over at all the retail bullion stores that I follow. They have decent stocks in just about everything they normally carry. The buy/sell spreads at most bullion stores remain a bit north of 10 percent -- and in the case of anything less than 0.999+ pure, it's far more than that. This obviously means that they have lots of stock -- and aren't overly enthusiastic about buying anything.
COMEX silver withdrawals have been monstrous since the start of the year... 135 million in Q1/2026...23 million oz. in April -- but only 10.7 million oz. so far in May. I've noted that silver withdrawals from COMEX have dropped off quite a bit in the last four weeks.
These amount don't include the 28.42 million oz. issued and stopped on the COMEX in the May delivery month so far. But this is not really silver demand per se...as all that's happening is that silver already sitting on the COMEX just changes ownership.
But silver demand from the COMEX can only go on for so long, as a huge chunk of silver sitting on the COMEX is owned privately -- and not for sale or delivery. So just how much silver is actually available for shipment on demand to the LBMA of elsewhere, is unknown...but it is finite.
We're also well into the sixth year of a structural deficit in silver according to the ongoing reports from The Silver Institute. However, subscriber John Macintosh thinks it's far more than they're reporting -- and threw the b.s. flag on their latest report in an essay headlined "The Silver Institute Strikes Again" -- and linked once more here.
The vast majority of precious metals being held in these depositories are by those who won't be selling until the silver price is many multiples of what it is today...if ever.
Sprott's PSLV is the third largest depository of silver on Planet Earth with 218.6 million troy ounces...unchanged from last week -- and a great distance behind the COMEX, which has now been demoted to the second largest silver depository, where there are 313.9 million troy ounces being held...down a net 1.2 million troy ounces this past week...but minus the 103 million troy ounces being held in trust for SLV by JPMorgan that Ted Butler found out about many years ago.
That 103 million ounce amount brings JPMorgan's actual silver warehouse stocks down to around the 37 million troy ounce mark...quite a bit different than the 140.3 million they indicate they have -- unchanged for the second week in a row. They've parted with a lot of silver in the last six or so months ...around 72 million oz.
But that number doesn't include the silver that JPMorgan owns and has stored at the other COMEX-approved depositories. They've shipped out lots of that over the months and years...especially this year so far -- and a lot of it out of CNT.
PSLV remains a very long way behind SLV as well -- still the largest silver depository...with 489.2 million troy ounces as of Friday's close...down about 200,000 troy ounces from last week.
On a net basis since the latter parts of December -- and despite the big spike in the silver price at the end of January, just about every depository or ETF has been hemorrhaging silver. However, that outflow has declined markedly over the last two months.
The latest short report [for positions held at the close of business on Thursday, April 30 showed that the short position in SLV rose by 4.10%...from the 31.20 million shares sold short in the prior report...up to 32.48 million shares in the latest short report that came out earlier this week. This amount represents 6.01 percent of total SLV shares outstanding...still a bit obscene, but not nearly as bad as it was several months back. Don't forget that there's no physical silver backing any of these shorted shares as the SLV prospectus requires.
BlackRock issued a warning more than ten years ago now to all those short SLV, that there might come a time when there wouldn't be enough metal for them to cover. That would only be true if JPMorgan decides not to supply it to whatever entity requires it. Those that remain short SLV shares are in equally dire straits as those short silver in the COMEX futures market -- and I suspect that they're the same entities. I suspect that they had the opportunity to cover a bunch of them after yesterday's carnage.
The next short report...for positions held at the close of trading on Friday, May 15...will be posted on The Wall Street Journal's website on Wednesday, May 27.
Then there's that other little matter of the monster short position in silver held by Bank of America in the OTC market...with JPMorgan & Friends on the long side. Ted said it hadn't gone away. He wrote an article about this back in April 2021 headlined "A New Piece of the Puzzle" -- and linked here.
In the article, the OCC Report stated that BofA had $8.3 billion in precious metal derivatives at the end of Q4/2020 -- but the BofA's derivatives position is now up to $120.7 billion as of the end of Q4/2025...an almost fifteen-fold increase.
A while after that article came out, he also come to the conclusion that they're short around 25 million ounces of gold with these same parties as well. Once these short covering rallies in both silver and gold begin anew...we'll see if they need to get taken over, like Bear Stearns did back in 2008 -- and for the same reason. If that's the case, JPMorgan...their counterparty to these trades ...will pick them up for next to nothing as well.
![]()
The Commitment of Traders Report, for positions held at the close of COMEX trading on Tuesday, showed the expected declines in the commercial net short positions in both silver and gold...far more in the latter than in the former.
In silver, the Commercial net short position declined by only 978 COMEX contracts...4.890 million troy ounces of the stuff -- and I must admit that I was expecting a far larger amount than that.
They arrived at that number through the sale of 233 long contracts...but also covered/bought back 1,211 short contracts -- and it's the difference between those two numbers that represents their change for the reporting week.
But the big changes were under the hood in the Disaggregated COT Report, as the Managed Money traders turned in their usual Pavlovian response... reducing their net long position by 4,197 COMEX contracts. The surprise was that the other two groups of traders...the Other Reportables and Nonreportable/small traders...as they increased their net long positions, the former by 2,757 COMEX contracts -- and the latter by 462 contracts. This was totally unexpected.
Doing the math: 4,197 minus 2,757 minus 462 equals 978 COMEX contracts ...the change in the Commercial net short position.
The Commercial net short position in silver now stands at 42,668 COMEX contracts/213.340 million troy ounces...down those 978 contracts from last week's report.
The Big 4 collusive commercial traders actually increased their net short position, but only by a piddling and irrelevant 17 COMEX contracts, up to 30,326 COMEX contracts.
The Big '5 through 8' decreased their net short position, them by 849 COMEX contracts...down to 14,306 COMEX contracts -- and only 1,000 contracts above their lowest short position on record.
The Big 8 commercial traders in total are net short 44,632 COMEX silver contracts...down 832 contracts on the week -- and only about 1,200 contracts off their lowest short position I have records for.
But since the Big 8 shorts only accounted for only 832 contracts of the 978 contract decrease in the Commercial net short position in silver, that meant that Ted's raptors, the 30 small commercial traders other than the Big 8, had to have been long buyers during the reporting week -- and they were.
They increased their net long position by 978-832=146 COMEX contracts -- and now hold a net long position of 1,964 contracts.
Their act of buy long contracts that had the mathematical effect of decreasing the Commercial net short position by that amount during the reporting week...which isn't a decrease at all. When these small traders are net long as they are now...it's only what the Big 8 commercial shorts do that matters.
Here's the 3-year COT chart for silver thanks to Nick Laird -- and updated with the above data. Click to enlarge.
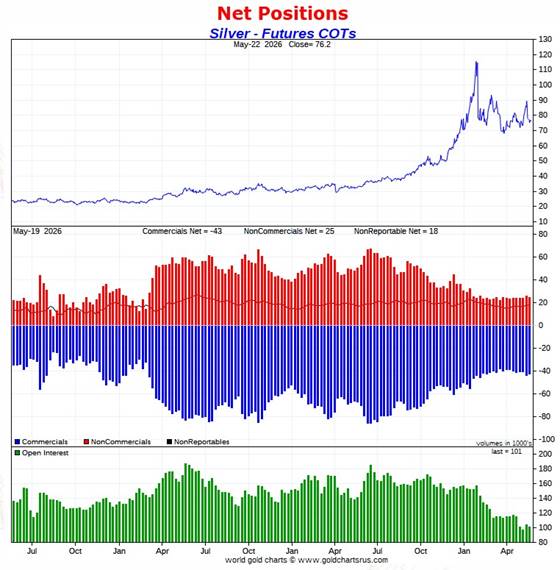
Considering the fact that silver's price was engineered lower by about ten bucks during the reporting week -- and back below its 50-day moving average in the process, I was more than disappointed in what the Big 8 shorts were able to accomplish...only decreasing their net short position by a piddling 832 contracts. They're still about 1,200 contracts above their record low short position they held back on 07 April.
The big surprise was the reaction of the Other Reportables and the Nonreportable/small traders. They didn't get the 'sell' memo during that engineered price decline -- and instead increased their net long positions. This left less food for the Big 8 shorts to eat -- and why they weren't able to accomplish as much as I was hoping for. I have a bit more to say about this in The Wrap.
The Big 8 shorts also weren't helped out by their smaller partners in crime... Ted's raptors...as they were also long buyers. There's obviously no honour amongst thieves...as the saying goes.
The Big 8 commercial traders are net short 44.3 percent of total open interest in silver in the COMEX futures market...up from the 43.8 percent they were short in last week's COT Report. The sole reason for that percentage increase was because of a decline in silver open interest, which fell by 3,049 COMEX contracts during the reporting week...about 3% -- and this obviously affected the percentage calculation.
But despite that fact that we're not back at the lows that the Big 8 shorts had on April 7...silver, from a COMEX futures market perspective, remains incandescently white-hot bullish...just waiting for 'da boyz' to set it free.
![]()
In gold -- and where the really big happy surprise was, the commercial net short position imploded by 18,629 contracts...1.863 million troy ounces of paper gold...far more than I was expecting.
They arrived at that number through the purchase of 11,795 long contracts -- and also covered/bought back 6,834 short contracts. It's the sum of those two numbers that represents their change for the reporting week.
Under the hood in the Disaggregated COT Report, all three categories of traders got the 'sell' memo -- and acted accordingly by selling aggressively. The Managed Money, Other Reportables and Nonreportable/small traders reduced their net long positions by 4,475...7,314 and 6,840 COMEX contracts respectively.
Doing the math: 4,475 plus 7,314 plus 6,840 equals 18,629 COMEX contracts...the change in the commercial net short position.
The commercial net short position in gold now stands at 191,629 COMEX contracts/19.163 million troy ounces...down those 18,629 contracts from last week's report.
The Big 4 commercial traders decreased their net short position by 5,852 COMEX contracts, down to 124,039 contracts -- and only about 2,000 contracts above their lowest short position that I have records for.
The Big '5 through 8' commercial traders also decreased their net short position...them by an equally hefty 3,833 contracts, down to 41,346 COMEX contracts held net short...their lowest short position that I have records for.
The Big 8 commercial traders in total are net short 165,385 COMEX contracts...down 9,685 contracts from last week -- and only 13 contracts above their lowest short position that I have records for.
But since the commercial net short position fell by 18,629 contracts -- and the Big 8 only accounted for 9,685 of those contracts...that meant that Ted's raptors, the 38 small commercial traders other than the Big 8, had to have been big buyers as well during the reporting week -- and they were. They decreased their net short position by a hefty 18,629-9,865=8,944 contracts -- and are now net short by 'only' 26,244 COMEX contracts...their smallest short position since March 17.
And like they currently are in silver, they would normally be net long gold by many thousands of contracts at this point in the price cycle -- and why they're not this time around, I have no idea...but suspect that they have been recruited into the trenches in the fight to prevent a massive rise in the gold price. But if they weren't short this amount -- and net long those thousands of contracts that they normally would, it's a guarantee that gold would be many, many thousands of dollars higher in price than it is now.
I suspect that no more than two or three of these small commercial traders hold the vast majority of this short position.
Here's Nick's 3-year COT chart for gold -- and updated with the above data. Click to enlarge.
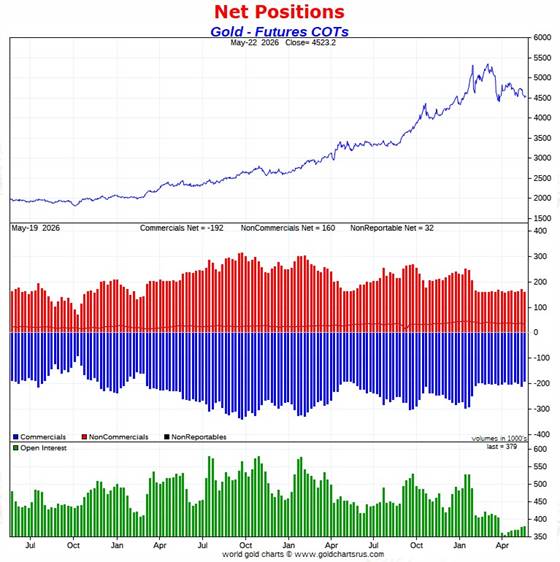
As of the cut-off on Tuesday, the Big 8 shorts are back at their record lows of April 7.
Because of all that short covering during the reporting wee, the Big 8 are now 'only' short 43.6 percent of total open interest in the COMEX futures market ...down from the 46.5 from what they were short in last week's report.
However, unlike silver, the commercial net short position in gold is much larger than the Big 8 short position...because the rest of the collusive commercial traders, Ted Butler's raptors, are also net short gold. Adding them into the mix, which you have to do, puts the commercial net short position in gold at 50.5 percent of total open interest in the COMEX futures market...down pretty big from the 55.8% that they were short in last week's report.
Despite this outlandish short position, the set-up in gold from a COMEX futures market perspective is still exceedingly bullish -- and because of that, we remain on the launchpad for a major rally in gold...but, like in silver, that will only transpire when allowed.
And the bullish positions in both silver and gold are further and greatly enhanced/ turbocharged by the 17-year lows in their respective total open interests.
![]()
In the other metals, the Managed Money traders in palladium decreased their net short position by 785 COMEX contracts -- and are now net short palladium by 2,733 COMEX contracts.
The commercial traders in the Swap Dealers category are net long palladium by 2,386 contracts -- and the traders in the Producer/Merchant category are net short 823 COMEX contracts. The traders in the Other Reportables are net long about 240 contracts in this metal at the moment -- and the Nonreportable/small trader categories are net long a bit over 900 COMEX contracts.
As I keep pointing out about these numbers, palladium is a very dinky market. Total open interest is only 17,259 COMEX contracts...a decrease of 160 contracts this reporting week...still about the lowest it's been since mid-2023. Open interest in platinum is also about the lowest since that time as well.
The world's banks are net short 12.1 percent of total open interest in palladium in the COMEX futures market as of the May Bank Participation Report that came out two Friday's ago...which is an increase from the 8.9 percent that they were net short in April's Bank Participation Report.
This is a very strange and twisted market once you get a look into its internal structure -- and as I point out in every monthly Bank Participation Report, the only reason that there's a COMEX futures market in palladium is so the collusive commercial traders of whatever stripe can control its price.
In platinum the Managed Money traders decreased their net long position by 2,777 COMEX contracts -- but remain net long platinum by 13,334 contracts. The traders in the Other Reportables and Nonreportable/ small trader category remain net long platinum by respectable amounts as well.
The commercial traders in the Producer/Merchant category in platinum are net short 14,320 COMEX contracts. The Swap Dealers are net short platinum by 8,792 COMEX contracts. Both are down on the reporting week...as they happily bought all the longs the Managed Money traders et al. sold during that time period.
It's mostly the world's banks that are 'The Big Shorts' in platinum in the COMEX futures market, as per May's Bank Participation Report that came out two weeks ago -- and haven't done much of anything in platinum in the last four months, in aggregate.
In copper, the Managed Money traders decreased their net long position by a piddling 300 COMEX contracts during the past reporting week -- and remain net long copper by 74,188 contracts...1.854 billion pounds of the stuff.
Copper, like palladium, continues to be a wildly bifurcated market in the commercial category. The Producer/Merchant category is net short 111,707 copper contracts/ 2.792 billion pounds -- while the Swap Dealers are net long 26,208 COMEX contracts/655 million pounds of the stuff.
Whether this dichotomy in copper means anything or not, will only be known in the fullness of time. Ted Butler said it didn't mean anything as far as he was concerned, as they're all commercial traders in the commercial category. But this bifurcation has been in place for as many years as I've been keeping records -- and that's a very long time.
In this vital industrial commodity, the world's banks...both U.S. and foreign... are net short copper by 2.4% of total open interest in the May Bank Participation Report. Back in the October 2025 BPR, these same banks were net long 0.90% of the total open interest in copper in the COMEX futures market. So basically they're market neutral...but only numerically, as that dichotomy between the two groups of commercial traders is still there.
At the moment it's all the commodity trading houses such as Glencore and Trafigura et al., along with some hedge funds, that are mega net short copper in the Producer/Merchant category, as the Swap Dealers are net long, as pointed out above.
The next Bank Participation Report is due out on Friday, June 5.
![]()
Here’s Nick Laird’s “Days to Cover” chart, updated with the COT data for positions held at the close of COMEX trading on Tuesday, May 19. It shows the days of world production that it would take to cover the short positions of the Big 4 — and Big '5 through 8' traders in every physically traded commodity on the COMEX. This chart is a graphical representation of what's shown in the COT Report above. Click to enlarge.
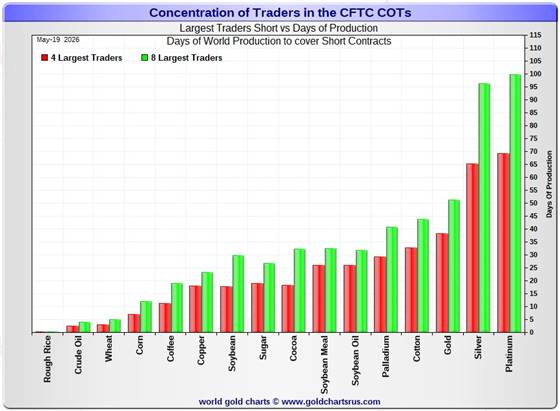
In this week's data, the Big 4 traders are short about 65 days of world silver production...unchanged from the prior COT report. The ‘5 through 8’ large traders are short an additional 31 days of world silver production ...down 2 days from last week's report...for a total of 96 days that the Big 8 are short...and obviously down 2 days from that last COT Report.
This small change should come as no surprise, considering the fact that Big 8 net short position fell by a tiny 832 contracts during the reporting week...and mostly in the Big '5 through 8' category.
Those 96 days that the Big 8 traders are currently short, represents about 3.2 months of world silver production, or 223.160 million troy ounces/44,632 COMEX contracts. That's down from the 227.320 million troy ounces/45,464 contracts in last Friday's COT Report.
In gold, the Big 4 are short about 38 days of world gold production...down about 2 days from the prior report -- and the Big '5 through 8' are short an additional 13 days of world production...down 1 day from last week, for a total of 51 days of world gold production held short by the Big 8 commercial traders -- and obviously down 3 days from last week. This is back to the lowest number of days short for them that I can remember. Like I've been saying for several months now...everything is washed out to the downside -- and that fact has to show up in these numbers as well, which it does.
In silver, I suspect that a goodly chunk of the short position in the Big 4 traders category is mostly held by only two traders...both of them U.S. banks...Wells Fargo and BofA, I suspect.
I note that the short position of the Big 8 traders in platinum remains 4 days of world production longer than the Big 8 are short in silver. This chart is also a graphical representation of why I consider platinum to be 'da boyz' No. 2 problem child after silver -- and it's a big problem child.
I also note from this chart that, for the sixth week in a row, cotton has knocked palladium out of the number four spot -- and into fifth place.
The short position in SLV now sits at 32.48 million shares/troy ounces as of the latest short report that also came out on Monday, May 11...for positions held at the close of trading on Thursday, April 30. This represents an increase of 4.10% from the prior report...which I wasn't at all happy to see. This 32.48 million share number, which represents 6.01% of total SLV shares outstanding, is not as off-the-charts grotesque and obscene as it used to be -- but realistically should be something less than half that amount.
Don't forget that there's not a single solitary troy ounce of silver backing any of these shorted shares as the SLV prospectus requires.
The next short report...for positions held at the close of business on Friday, May 15...is due out on Wednesday, May 27.
In the overall in yesterday's COT Report, the short positions of the Big 8 commercial traders in silver decreased by only a tiny amount -- but the set-up in it remains beyond wildly bullish. In gold, the Big 8 decreased their short position by a very hefty amount -- and are now back to their previous record low short position of 07 April. The set-up in it remains exceedingly bullish as well, but not quite to the same degree that it is in silver.
As Ted Butler pointed out quite often over the years, the resolution of the Big 4/8 short positions will be the sole determinant of precious metal prices going forward...although that short position in gold held by his raptors continues to be a negative factor -- but it did decrease by a hefty amount during this past reporting week.
And as he also pointed out over the years, there would come a time when what the numbers show in the COT Report won't matter, as events in the real world...whatever they may be...will overtake them. That hasn't happened yet...but someday it will.
All that we await now, is the denouement that follows. The big bear raids we've endured over the last several months, weeks and days...including the Big One this past reporting week...are all part and parcel of the process to keep their prices in line until that moment arrives.
![]()
CRITICAL READS & VIDEOS
U.S. Fed officials propose prolonging dollar swap lines to underpin stability
Some U.S. Federal Reserve officials proposed extending a critical, international supply line of U.S. dollars to underpin financial stability, according to an account of their recent meeting.
The discussion centered on extending so-called U.S. dollar swap lines, which the Fed has with five major central banks and has become a key backstop for global banking since the financial crisis.
The debate unfolded as the globe faces heightened instability and spiraling energy costs, driven by a war between the United States, Israel and Iran.
The discussion also comes amid growing apprehension towards Washington and how much the United States can be relied upon both for military defense, as well as in finance with a backup of lenders with dollars, the lifeblood of international trade and finance.
Incoming Federal Reserve Chair Kevin Warsh's suggestion that independence may not extend fully to the Fed's crisis-fighting role abroad has unsettled central banking peers in Europe.
Anything to stem the tide of foreign governments dumping their U.S. Treasuries, dear reader. This Reuters story, filed from Frankfurt on Thursday, was something I found in a GATA dispatch on Friday morning -- and another link to it is here.
![]()
US$...Slowly, then rapidly -- Alasdair Macleod
Foreigners increasingly distrust the dollar, which is why central banks, the ultimate insiders are selling them for gold. The decline in the $ has not been noticed by Americans — yet. Click to enlarge.
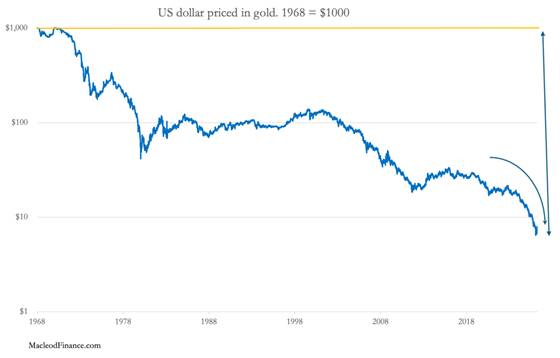
The chart above prices the dollar, which is only imaginary money, in real money which is gold. In 1968, when the exchange rate was $35 for an ounce of gold, if you bought $1,000 by selling 28.57 ounces of gold that $1,000 would be worth only 0.22 ounces today. The loss is represented by the double-headed arrow in the chart above. The pace at which the dollar’s value is slipping is now accelerating, even plotted on a log scale.
Of course, the relationship is almost always presented the other way round, showing gold having risen from $35 to $4,540 giving the illusion that gold is rising and the dollar is constant. The illusion continues to fool investors and commentators in G7 capital markets, but it no longer fools other foreign holders of the dollar, principally the Chinese. This is why gold and silver are being drained out of London and New York. Central banks and sovereign wealth funds along with increasing members of Asia’s private sector actors are dumping their excess dollars and other G7 currencies, encashing them for real money without counterparty risk.
Slowly and then suddenly, is what Hemingway said about bankruptcy. National bankruptcies are no different. But the way they are reflected in national bankruptcies is different, being exposed by loss of faith in the currency and the growing realisation that it is only imaginary money.
This very worthwhile commentary from Alasdair showed up on his Internet site on Friday -- and I thank Chris Powell for pointing it out. Another link to it is here.
![]()
Chair Powell surely had hopes to “reduce the Fed’s outsize presence in financial markets.” Every head of a central bank has a plan – until they’re smacked in the face by financial crisis. Judy Shelton suggests that resolving some of our nation’s most intractable problems is simply a matter of adopting free-market reforms and allowing the resulting supply-side boom to whip inflation now and balance the federal budget. Haven’t we followed a similar “reform” playbook a few times over recent decades?
Unfortunately, there will be no growing our way out of today’s pickle. In theory, economies can inflate away over-indebtedness. In reality, efforts to inflate out of Bubbles ensure only greater and more destructive Bubble excess. And it is fundamental to my analysis that prolonging “Terminal Phase Excess” courts disaster.
The Trump administration is pursuing every avenue to bolster late-cycle excess and prolong history’s greatest Bubble. Overheating risks are high and rising. The Iran war has significantly bolstered already powerful inflationary pressures. And, importantly, bond markets now recognize that they are on the losing end of inflationary policy-making – the sucker at the table.
Doug's weekly commentary is always worth reading -- and this one appeared on his website around midnight PDT last night -- and another link to it is here.
![]()
Two very worthwhile and informative video interviews
1. All-Out War in Iran, That's What Netanyahu Needs -- Alastair Crooke
This longish 63-minute video interview with former British diplomat and former MI6 officer was hosted by Lt. Colonel Daniel Davis early on Friday morning EDT -- and is definitely worth your time if you have the interest. I thank Guido Tricot for sharing it with us -- and the one that follows. The link to this one is here.
2. INTEL Roundtable w/Larry Johnson, Ray McGovern & Scott Ritter - Weekly Wrap 22-May
This very interesting 29-minute video interview with these three analysts was hosted by Judge Andrew Napolitano -- and showed up on the youtube.com Internet site very late on Friday afternoon EDT -- and is also worth your while if you have the interest. The link to it is here.
![]()
Dunagun Kaiser of Liberty & Finance fame, interviews your humble scribe
This 36-minute minute audio/video interview with yours truly and host Dunagun Kaiser was recorded at 3 p.m. EDT on Wednesday -- and if you think you might be interested in what I have to say...the link is here.
![]()
India gold market update: Import tightening -- World Gold Council
Highlights
- Gold import duty was raised sharply by 9%– from 6% to 15%, the steepest increase on record – alongside broader regulatory tightening
- Domestic gold prices have not yet fully reflected the duty hike amid weak demand and ample supply; local markets are currently in deep discount from the landed price1
- Past trends indicate that higher duty increases unofficial inflows, although official imports remain relatively resilient
- Gold demand is expected to moderate in 2026, with jewellery and bar and coin demand projected to decline by 50–60t (~10% y/y) on account of the import duty hike.
This very long and chart-filled essay put in an appearance on the gold.org Internet site on Friday -- and I found it on Sharps Pixley. Another link to it is here.
![]()
China to Impose Mining Controls on Strategic Minerals
The Trump-Xi meeting is now history, so Beijing can go back to doing what it does best: squeezing U.S. supply chains with its near choke-hold on most strategic and rare-earth supply chains.
China plans to impose mining controls on certain strategic minerals to ensure supply security and protect the finite resources, Beijing revealed in a government notification published by the official Xinhua News Agency.
The new rules will take effect from June 15 and allow Beijing to control total output, restrict mining entities and run security reviews on foreign investments in mining that could pose a risk to national security.
Xinhua didn’t specify which minerals will be impacted. Any adjustment to the list of strategic mineral resources will assess factors like economic importance, national security, domestic requirements and supply chain resilience, according to the regulation.
China currently has similar controls on production of rare earths, critical materials vital for high-tech manufacturing, through annual production quotas to a few licensed domestic companies.
The above five paragraphs are all there are to this Zero Hedge story that was posted on their website at 6:50 p.m. EDT on Friday evening -- and another link to the hard copy is here.
QUOTE of the DAY

![]()
The WRAP
"Understand this. Things are now in motion that cannot be undone." -- Gandalf the White
![]()
Last week's pop 'blast from the past' was one of the theme songs from the hippie/my generation back in the very late 1960s -- and I though I'd revisit that time period with anthem of that era. Composed by Canadian singer/ songwriter Joni Mitchell in 1969...it languished as a 'B' side recording. Joni's boyfriend at the time was Graham Nash of 'Crosby, Stills, Nash & Young' fame -- and their version became a North American hit. It's probably the most well known -- and that's linked here.
But it became a monster international hit...even back in the U.S...when it was released in the U.K. on 24 July 1970 by British rock/folk band...Matthews Southern Comfort. This is my favourite of the three by far -- and is linked here. There's a bass cover to this version -- and infusion26 lays it down perfectly. That's linked here.
Today's classical 'blast from the past' is somewhat more ancient...from the late Baroque era. It's Johann Sebastian Bach's Concerto for Two Violins in D minor, BMV 1043 which he composed c. 1730 as part of a concert series he ran as the Director of the Collegium Musicum in Leipzig -- and one the composer's most successful works.
This recording is by the Netherlands Bach Society on 07 October 2016. The featured soloist are Shunske Sato and Emily Deans. This is as good as it gets -- and the link is here.
![]()
The rallies in all four precious metal in very early COMEX trading were cut off at the knees the moment that the DXY began its phony baloney 'rally' at 9:10 a.m. in New York...as the powers-that-be had to step in and save the dollar index, as it was heading sharply towards the nether reaches of the earth [once again] at that point.
But with volumes in both silver and gold the lowest I can remember ever seeing...fumes & vapours on steroids...the collusive commercial traders of whatever stripe had no difficulty in closing precious metal prices at whatever they saw fit -- and that's what they did.
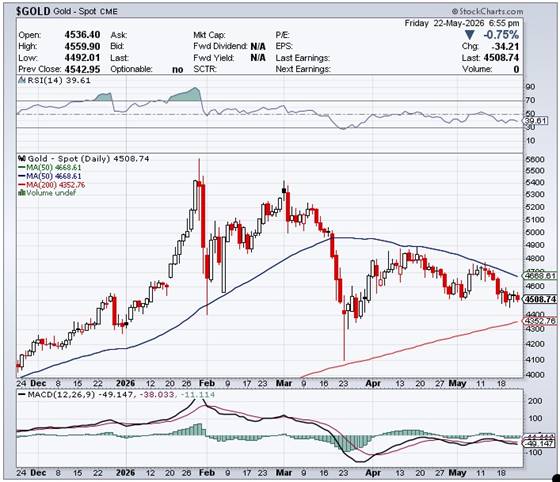
Gold open interest declined a tad for the fourth day in a row -- and silver o.i. has basically flat-lined for the last three.
Gold remains stuck halfway between its 50 and 200-day moving averages -- and silver's 'loss' on Friday closed it below its 50-day moving average by around 50 cents.
The big losses in platinum and palladium barely changed their positions on their 6-month charts below. Platinum, like gold, remains halfway between its 50 and 200-day moving averages -- and palladium remains mired far below any moving average that matters.
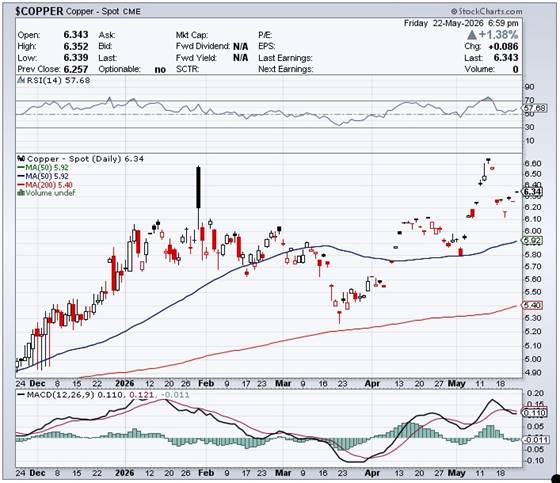
Copper tacked on an 8.6 cent gain...finishing the Friday trading session at $6.343/pound.
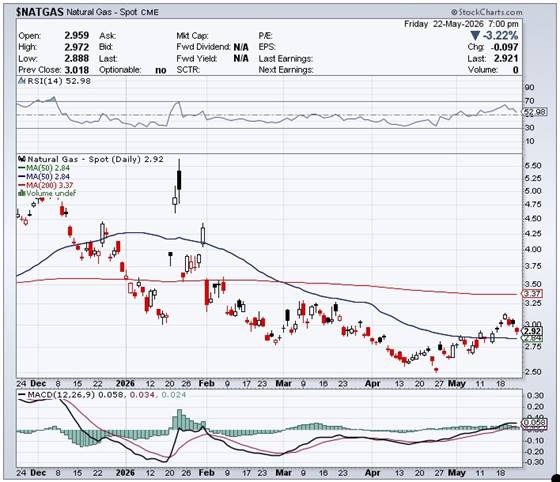
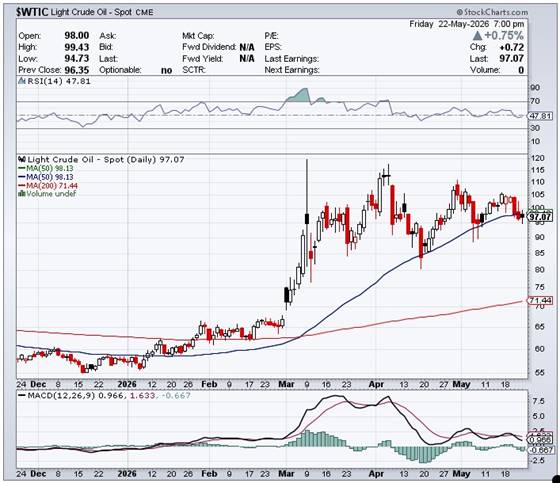
Natural gas [chart included] was closed down 9.7 cents at $2.921/1,000 cubic feet -- and WTIC closed higher by a rather inconsequential 72 cents at $97.07/barrel.
Here are the 6-month charts for the Big 6+1 commodities, as of their closes on Friday...courtesy of stockcharts.com as always. Click to enlarge.
It's 11:30 EDT on Friday night as I type this paragraph -- and still no resumption of the war against Iran by Israel and the U.S. However, most pundits that are 'familiar with the matter' -- and that I pay close attention to...say that it's only a matter of when, not if. We'll see.
It was another 'bad hair' week for the precious metals...but as I've already pointed out, this current iteration of the now-familiar 'wash, rinse & spin' cycle was just the collusive commercial traders resetting their short positions back to where they were at their record lows of April 7.
They were successful in gold, but fell short in silver by around 1,200 contracts because of the aggressive and very counterintuitive long-buying by the the traders in the Other Reportables and Nonreportable/small traders category during the reporting week. It was so counterintuitive that it has my 'spidey senses' tingling as to who might be brave enough to go long in the face of the current reporting week's engineered price decline. What might they know that we don't...yet? Just asking for a friend.
Several readers were complaining about the crummy price action of the silver equities during this past week -- and as I pointed out to them...as I've been doing all this year -- and part of last...is that their prices are being actively managed.
Here's a 3-year chart I've posted several times this year already, but it's time for a re-visit. It's a chart of the Global X Silver Miners ETF plotted against the price of silver. Everything looked semi-normal up until mid September of last year...but even up to that point, that silver ETF was only outperforming silver by a bit under 60%. Click to enlarge.
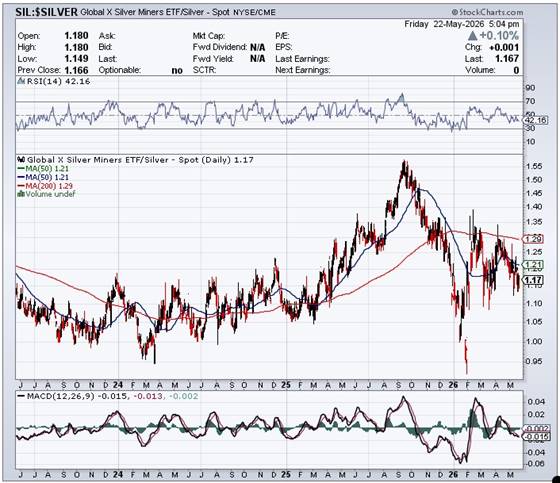
As you can see from the chart, after mid September that price relationship broke down entirely -- and during silver's parabolic rise into the end of January, the silver shares performed worse and worse relative to the silver price...so much so in fact that during the last week of its parabolic rise, it was actually underperforming the metal -- and as of Friday's close, its shares were 'outperforming' by only around 17%.
This is why, in my opinion, that starting last September, 'da boyz' began rigging the price of the shares far more aggressively than they had been up until that time...mostly, I suspect, through the sale of precious metal stocks that they accumulate on their multiple 'wash, rinse & spin' cycles -- and then selling them into their ensuing rallies. The reason I feel that way is because I've seen little sign of excessive shorting of the Big 4 companies in the bi-weekly short reports. Those companies are First Majestic, Hecla, Coeur and Pan American.
Profit is not their motive. Their sole purpose appears to be the prevention of the silver shares from attracting too much attention. Here's Nick's year-to-date chart for all of 2025. The gold stocks/HUI outperformed the gold price by 2.34x...which is normal in a bull market. However, the silver equities/Silver Sentiment Index only outperformed silver by 1.13x...less than half of the gain of the gold stocks. So you can see that this rigging has been going on for a very long time. Click to enlarge."
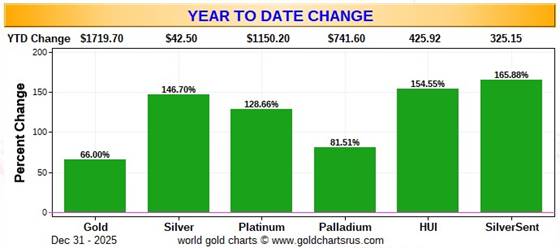
If the silver stocks had been allowed to perform as well as the gold stocks last year, Nick Laird's Silver Sentiment Index would have closed higher by 343% in 2025 -- and you wouldn't be reading this column, because it would no longer exist -- as I would be digging pennies out of the sand on a beach somewhere on Planet Earth...as would a lot of other investors.
Another thing I've noticed and pointed out the odd time is the shenanigans that appear to be going on in the pre-open session in New York. In the last fifteen or so minutes before the markets open at 9:30 a.m. EDT...the futures in the silver shares are sold down hard...putting them on the back foot right away.
Up until the end of 2025 this interference was most noticeable in the silver equities...but starting shortly after the New Year began, this underperformance began to appear in the gold stocks as well.
How long 'da boyz' can keep this up, is unknown...but they've certainly kept the excitement level on the back burner since the last major tops were set in very late January.
However...and barring a stock market crash...we're now back to being all washed out to the downside in the COMEX futures market in both silver and gold -- and their next rallies, when allowed, should be a sight to behold... especially considering the other bullish factor...the 17-year lows in total open interest in both.
We'll find out then if 'da boyz' will continue their war against the precious metal metals stocks...or will they stand aside and let 'em rip to the upside?
So we wait some more.
I'm still 'all in' and, as always, will remain so to whatever end.
I'm done for the day -- and the week -- and because of the Memorial Day holiday in the U.S. on Monday..my Tuesday missive will be as brief as I can possibly make it.
Enjoy the rest of your weekend/long weekend -- and I'll see you then.
Ed
About the author

SUBSCRIBE: https://edsteergoldsilver.com/

Ed Steer’s Daily Analysis of the Gold and Silver Markets
After eight years of writing about the precious metals for Casey Research, the folks at Stansberry & Associates—who just recently purchased controlling interest in the company—decided that my ‘niche market’ column didn’t fit into their plans.
Since the time that Casey Research was kind enough to offer me a stand-alone column, it became their most highly-rated blog almost from the outset—and has remained that way up to this date...