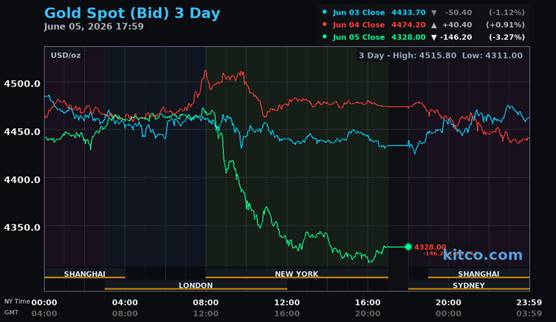
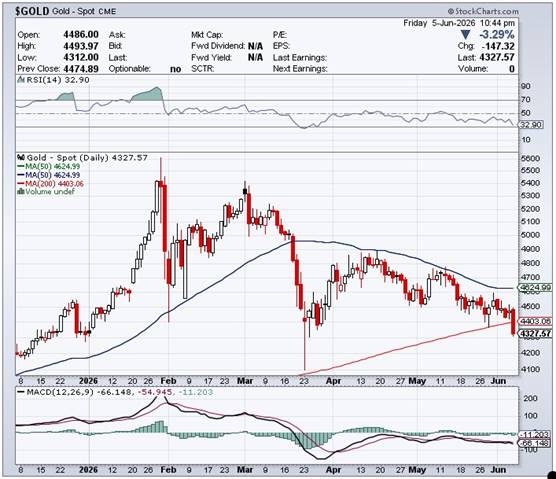
The price pressure in gold commenced about an hour after Globex trading began at 6:00 p.m. in New York on Thursday evening -- and that didn't end until around the 2:15 p.m. afternoon gold fix in Shanghai on their Friday afternoon. It rallied a bit until around 8:30 a.m. in London -- and then traded pretty flat until five minutes after the 8:20 a.m. COMEX open. 'Da boyz' showed up even before the 8:30 a.m. non-farm payroll report came out. They set its engineered low tick at 4:05 p.m. in after-hours trading in New York -- and it was then allowed to rally a bit until very shortly before the market closed at 5:00 p.m. EDT.
The high and low ticks in gold were reported as $4,508.70 and $4,336.60 in the August contract...an intraday move of $172.10 the ounce. The June/ August price spread differential in gold at the close in New York yesterday was $28.20...August /October was $30.80...October/December was $32.90 -- and December/ February27 was $34.70 an ounce.
Gold was closed in New York on Friday afternoon at $4,328.00 spot...down $146.40 on the day -- and $17.00 off its Kitco-recorded high tick. Net volume was far, far heavier than we've seen lately...but 'nothing special' in the overall ...at a bit under 159,000 contracts -- and there were around 21,500 contracts worth of roll-over/switch volume on top of that.
I saw that an eye-watering 4,062 gold, plus only 62 silver contracts were traded in June yesterday and, as is always the case, it remains to be seen just how much of these amounts show up in tonight's Daily Delivery and Preliminary Reports further down in today's column.
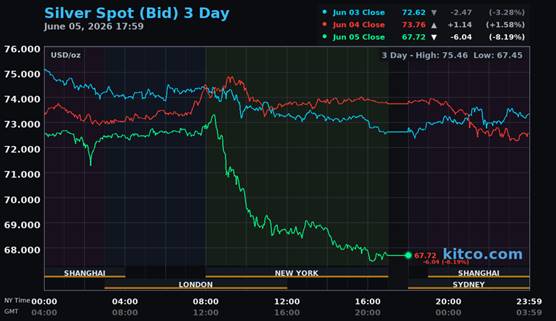
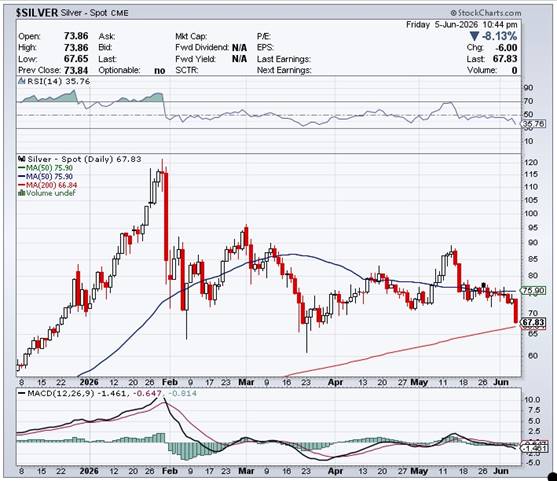
As is usually the case in bear raids such as this, silver's price path was managed in an almost identical fashion as gold's...with the only real difference being that its engineered low tick was set at 4:20 p.m. in after-hours trading in New York -- and it wasn't allowed to recover much after that.
The high and low ticks in it were recorded by the CME Group as $74.38 and $67.70 in the July contract...an intraday move of a knee-wobbling $6.68 an ounce. The July/September price spread differential in silver at the close in New York yesterday was 51.3 cents...September/December was 77.2 cents -- and December/March27 was 74.6 cents.
Silver was closed at $67.72 spot...down $6.04 on the day -- and only 27 cents off its Kitco-recorded low tick. Net volume, like gold's, was far, far higher than what we've been seeing lately...but 'normal' in the overall...at a bit over 56,500 contracts -- and there were around 24,500 contracts worth of roll-over/switch volume out of July and into future months in this precious metal.
![]()
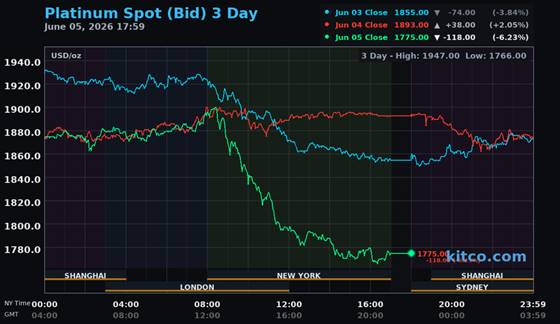
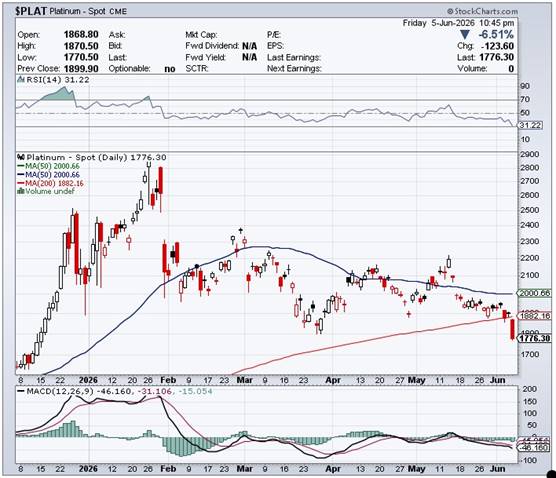
I shan't waste your time with platinum, either...as it was pretty much a carbon copy of both silver and gold. It was closed at $1,775 spot...down $118 from Thursday -- and only 9 bucks off its Kitco-recorded low tick.
![]()
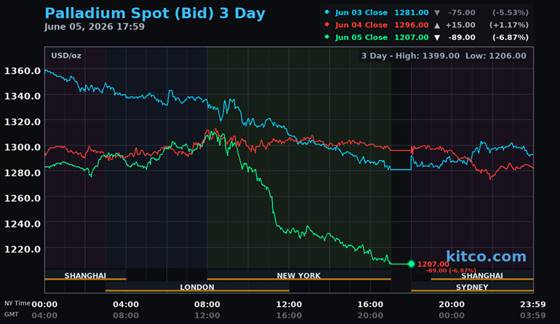
Ditto for palladium -- except it was closed only a dollar off its low tick... finishing the Friday trading session at $1,207 spot...down $89 on the day.
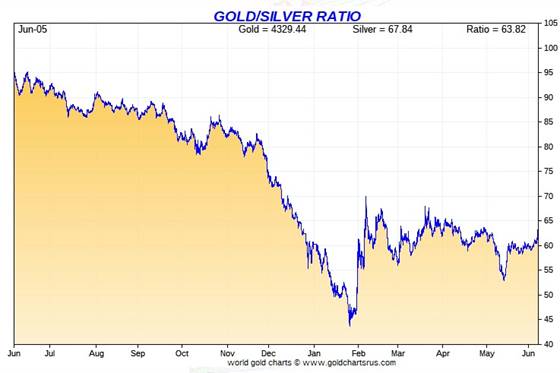
Based on the kitco.com spot closing prices in silver and gold posted above... the gold/silver ratio worked out to 63.9 to 1 on Friday...compared to 60.7 to 1 on Thursday.
Here's the 1-year Gold/Silver Ratio chart from Nick Laird -- and updated with this past week's data. Click to enlarge.
![]()
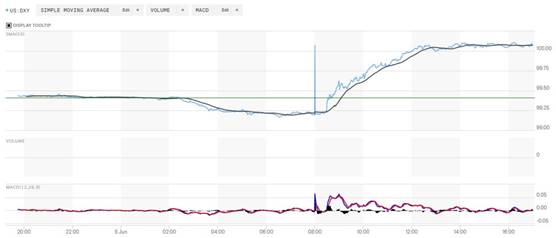
The dollar index closed very late on Thursday afternoon in New York at 99.41 -- and then opened higher by 3 basis points once trading commenced at 7:45 p.m. EDT on Thursday evening...which was 7:45 a.m. China Standard Time on their Friday morning. It didn't do anything until it began to drift lower starting at or five minutes after the 2:15 p.m. afternoon gold fix in Shanghai...touching its low tick of the day around 11:30 a.m. in London. It then crept a tad higher until it took off about 3 or so minutes before the non-farm payroll report hit the tape in New York at 8:30 a.m. EDT. That rally continued at an ever-decreasing rate until around 2:05 p.m. -- and it didn't do a whole heck of a lot between then and the 5:00 p.m. EDT close.
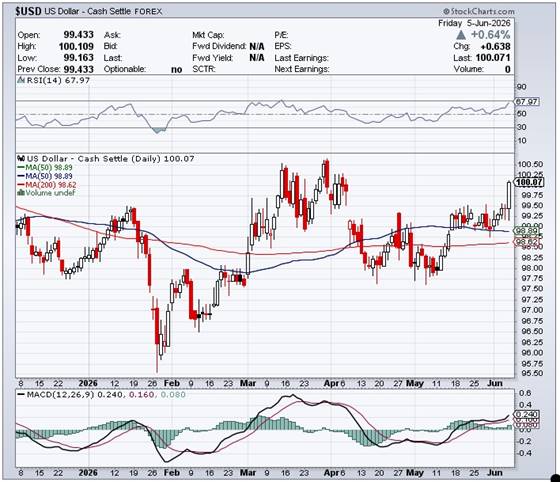
The dollar index finished the Friday trading session in New York at 100.07...up 66 basis points from its close on Thursday.
Here's the DXY chart for Friday...thanks to marketwatch.com as usual. Click to enlarge.
![]()
Here's the 6-month U.S. dollar index chart...courtesy of stockcharts.com as usual. The delta between its close...100.07...and the close on DXY chart above, was zero basis points. Click to enlarge.
![]()
One has to suspect that the financial powers-that-be made an attempt to run the dollar index shorts yesterday...but had limited success with it, as it faded pretty quickly. However, it...along with the non-farm payroll numbers, was the news that 'da boyz' used to crush the precious metals in the COMEX futures market.
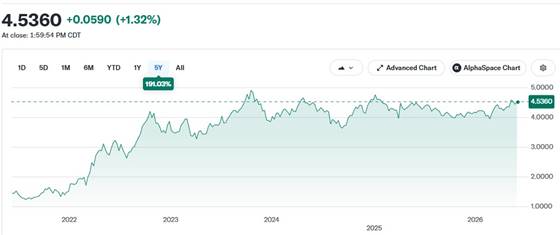
U.S. 10-year Treasury: 4.5360%...up 0.0590/(+1.32%)...as of the 1:59:54 p.m. CDT close.
The ten-year made it up to 4.5540 percent at its 1:11 a.m. CDT/2:11 p.m. EDT high tick of the day -- and it certainly looked like the Fed stepped in to ensure that its yield wasn't allowed to get any higher than that.
For the week just passed, the ten-year closed higher by 8.30 basis points, with most of that tacked on, on Friday.
Here's the 5-year 10-year U.S. Treasury chart from the yahoo.com Internet site -- which puts the current yield into a somewhat longer-term perspective. Click to enlarge.
It still hasn't been allowed to take out its 4.92% high of October 15, 2023 -- and it's more than obvious that if the Fed hadn't been mucking about in the treasury market, buying up everything being offered over the last several months, it's yield would be massively above that mark by now. It managed to close above 4.50% again this week -- and it will be of some interest to see if the Fed will allow that to last.
![]()
It's superfluous to point out that the gold shares got crushed yesterday, as the HUI closed down an eye-watering 8.42 percent.
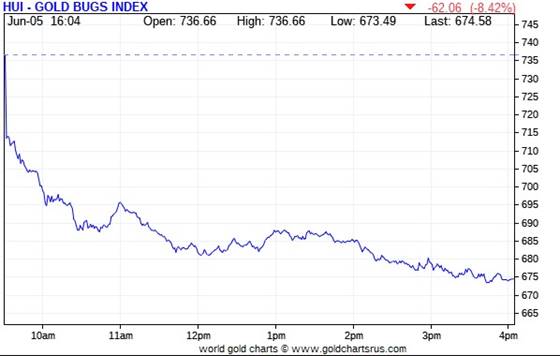
![]()
Not surprisingly, the silver stocks got it far worse, as Nick Laird's Silver Sentiment Index was crushed by 13.16 percent. Click to enlarge.
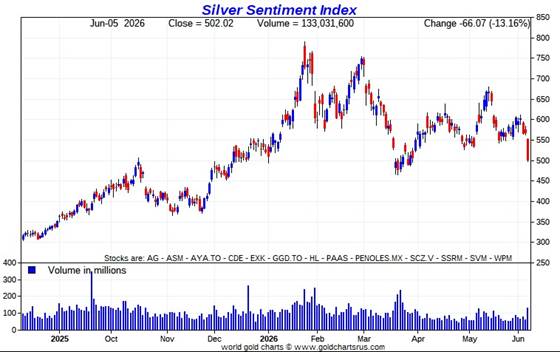
![]()
I didn't even bother looking for stars or dogs yesterday...as they all fell into the latter category with ease. I didn't even bother checking for any news on them, either.
But not surprisingly, volumes in all of them were well above their average daily trading volumes -- and it's a given that anyone who held shares on margin...or were long COMEX futures or options on margin going into Friday's trading session...got blown out of their positions, which added to the carnage.
Then the question has to be asked once more....were value investors with the white hats snapping up cheap precious metal stocks...or was it 'da boyz' with the black hats scooping them up to sell them into their next big rallies. Of course if it was the latter group, which is what I suspect, then they may just hang onto them in order to make big profits when they allow their next rallies to begin.
Silver was closed down 8.19% on Friday -- the Silver Sentiment Index was crushed by 13.16% -- and Sprott's PSLV finished the day down 8.15%
Gold was closed lower by 3.27%...the HUI closed down 8.42% -- and Sprott's PHYS closed lower by 3.76%
The Shanghai/U.S. price premium in silver was only 9.46 percent on their Friday.
The reddit.com/Wallstreetsilver website, now under 'new' and somewhat improved management, is linked here. The link to two other silver forums are here -- and here.
![]()
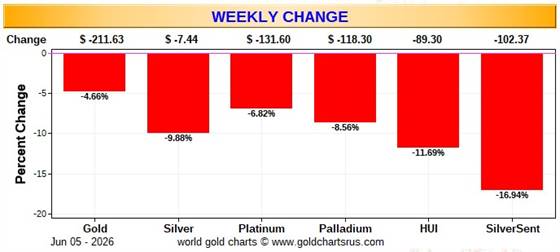
Here are two of the usual three charts that appear in this spot in every weekend missive. They show the changes in gold, silver, platinum and palladium in both percent and dollar and cents terms, as of their Friday closes in New York — along with the changes in the HUI and the Silver Sentiment Index.
Here's the weekly chart...which doubles as the month-to-date chart for this one week only -- and because of the mostly unrelenting price pressure during the week...most of which came yesterday...it's wall-to-wall red -- and there's no way to sugar-coat this. But on a 'relative' basis, the silver equities did outperformed the HUI vs. the drop in the gold price. Click to enlarge.
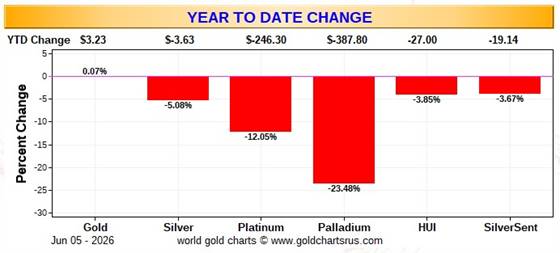
Here's the year-to-date chart -- and it's butt-ass ugly as well. Only gold is up year-to-date -- and it by a hair. Of course all this red in the weekly and year-to-date charts comes courtesy of the collusive commercial traders of whatever stripe. Click to enlarge.
Despite the fact that silver has now broken the $120 barrier...albeit briefly -- and the silver well in London came close to running dry last October...the gold/silver ratio remains at a farcical 63.9 to 1 as of Friday's close. The 'normal' and historical ratio is around 15 to 1...which would put silver at about $290 based on gold's closing price on Friday. And if priced at the ratio of 7:1 that it comes out of the ground at, compared to gold...that would put silver at a bit under $620 an ounce. So a rather impressive triple-digit silver price is in our future...most likely somewhere between those two numbers.
As I say in this spot every Saturday...all that remains to be resolved is what that price will be -- and how soon 'da boyz' allow it to happen. Its first attempt to reach one of these values back at the end of January was obviously crushed ...as were all the rest since then. But in the face of the continuing structural deficit in silver -- and all the other stuff going on in the world today, they can't keep it up forever.
![]()
The CME Daily Delivery Report for Day 7 of June deliveries showed that only a disappointing 863 gold -- and only 25 silver contracts were posted for delivery within the COMEX-approved depositories on Tuesday. I was disappointed in the gold number, as there were 4,062 gold contracts traded in June on Friday...so I was expecting a number several multiples of the actual number.
In gold, the only short/issuer of the three in total that mattered was British bank Barclays, as they issued 830 contracts out of their client account. The three biggest of the four long/stoppers in total were French bank BNP Paribas, Wells Fargo Securities -- and JPMorgan...picking up 652, 163 and 44 contracts respectively...Wells Fargo for their house account.
In silver, the two short/issuers were StoneX Financial and ADM...issuing 19 and 6 contracts out of their respective client accounts. The biggest long/ stopper was Japanese trading house Mizuho, picking up 9 contracts for clients ...followed by the 5 contracts each stopped by Deutsche Bank and Wells Fargo Securities for their respective house accounts.
In palladium, there were 15 contracts issued and stopped.
In copper, another 290 contracts/7.250 million pounds were issued and stopped.
The link to yesterday's Issuers and Stoppers Report is here.
So far in June there have been 28,791 gold...plus 2,109 silver contracts issued and stopped.
On First Notice Day, there were 25,381 gold contracts still open in June -- and that number in silver was 2,147 COMEX contracts. We're only seven delivery days into June -- and there have already been 3,410 more gold contracts issued and stopped than were posted for delivery on First Day Notice. We're not quite there in silver, but getting close.
The CME Preliminary Report for the Friday trading session was missing in action -- and I waited until 4 a.m. EDT to see if it would show up. They'll post the final report on Monday morning sometime -- and if I remember, I'll update today's column at that time.
[I checked the final change in total open interest for gold on Thursday -- and it showed an inconsequential decline...from +1,333 COMEX contracts, down to +193 contracts. The final change in total silver o.i. for Thursday showed an equally inconsequential decrease...from +567 contracts, down to +420 COMEX contracts.]
Gold open interest inJuly in Friday morning's final report from the CME Group rose by 10 contracts, leaving 2,988 contracts still open -- and silver o.i. July fell by a further 1,041 contracts, leaving 68,286 contracts still around.
![]()
There were further withdrawals from GLD and SLV on Friday, as authorized participants removed 167,937 troy ounces of gold from the former -- and 542,787 troy ounces of silver from the latter. There were also a tiny 605 troy ounces withdrawn from GLDM...although an amount this small might have been an inventory adjustment.
Once again, the SLV borrow rate showed no data points for Friday -- and hasn't shown any data since last Thursday. The GLD borrow rate began the day at 0.37% -- and finished it at 0.34%...with 6.2 million shares available.
In other gold and silver ETFs and mutual funds on Earth on Friday... net of any changes in COMEX, GLD, GLDM and SLV activity, there were a net 116,678 troy ounces of gold added -- and a net 499,352 troy ounces of silver was added as well.
![]()
Surprisingly enough, it was all zeros in gold over at the COMEX-approved depositories on the U.S. east coast on Thursday.
There was a bit of paper activity, as 37,260 troy ounces of gold were transferred from the Registered category and back into Eligible involving three different depositories...most likely done so to save on storage fees. The two largest amounts were the 16,137 and the 14,467.938 troy ounces/450 kilobars transferred in that direction over at Brink's, Inc. and JPMorgan respectively.
The link to all of Thursday's COMEX gold activity is here.
There wasn't much going on in silver, as nothing was reported received, either -- and only 25,813 troy ounces were shipped out...with all of that amount leaving Delaware. There was no paper activity -- and the link to this is here.
The Shanghai Futures Exchange updated their silver inventories as of the close of business on their Friday -- and it showed that a net and tiny 9,261 troy ounces/0.289 metric tonnes of silver were withdrawn... leaving their silver inventories at 31.271 million troy ounces/972.611 metric tonnes.
![]()
Here are the usual 20-year charts that show up in this space in every weekend column. They show the total amounts of physical gold and silver held in all known depositories, ETFs and mutual funds as of the close of business on Friday. Click to enlarge.
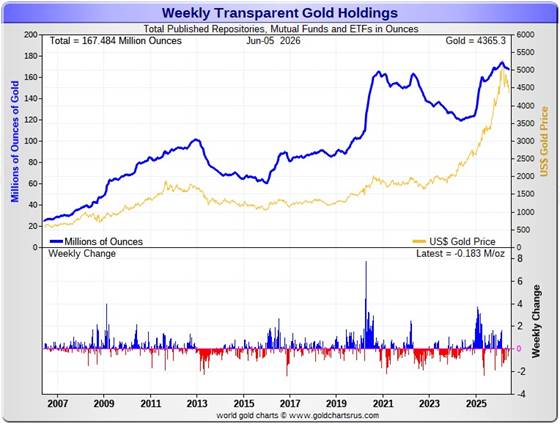
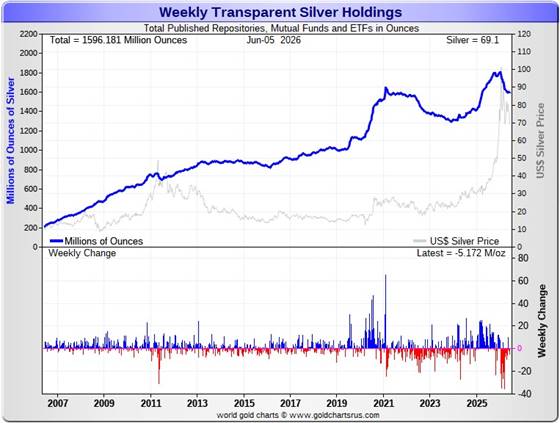
During the business week just past, there were a net and further 183,000 troy ounces of gold withdrawn -- along with a net and further 5.172 million troy ounces of silver.
According to Nick Laird's data on his website, a net 959,953 troy ounces of gold were removed from all the world's known depositories, mutual funds and ETFs during the last four weeks. The two biggest 'in' amounts were the 166,628 that went into two new Swiss gold ETFs -- and the 119,602 troy ounces that went into various and sundry Chinese ETFs.
The largest 'out' amount by far were the 909,071 troy ounces that left the COMEX ...followed by the 397,705 troy ounces that departed GLD.
The amount of gold in all the world's ETFs and mutual funds remains barely above its old all-time high of late 2020...see the above chart. But it should be far higher...considering gold's current price...far more than double it was back then. Why it isn't, is beyond me...but suspect it has something to do with the 'everything bubble' in the equity markets.
But, on the other hand, a net 1.462 million troy ounces of silver were added during that same 4-week time period.
The largest 'in' amount were the 6.881 million troy ounces into the COMEX... followed by the 704,324 troy ounces into iShares/SSLN.
The largest 'out' amounts were the 1.892 million oz. that left Sprott's CEF -- and the 1.228 million oz. out of Sprott's PSLV. Next were the 1.205 million out of India's ETFs...plus the 1.150 million troy ounces out of UBS.
It should be noted that the amount of silver held in all these depositories, ETFs and mutual funds remains below its old all-time high inventory level of January 2021. But it should be far higher than it is as well, because silver is about 2.5x the price it was back then.
Back at its previous inventory peak in late January 2021, silver was around $27 an ounce. Now its about 41 bucks higher. Why the precious metal ETFs aren't doing better is a mystery for which I have no answer....except for what was mentioned a few paragraphs ago.
Retail demand remains very quiet -- and there are no 'out of stock' signs over at all the retail bullion stores that I follow. They have decent stocks in just about everything they normally carry. The buy/sell spreads at most bullion stores remain a bit north of 10 percent -- and in the case of anything less than 0.999+ pure, it's far more than that. This obviously means that they have lots of stock -- and are not at all enthusiastic about buying anything.
COMEX silver withdrawals have been monstrous up until recently...135 million in Q1/2026...23 million oz. in April -- but only 12.6 million oz. in May -- and nothing at all in June so far. As you can see, withdrawals from the COMEX have imploded in the last couple of months.
These amount don't include the 10.545 million oz. issued and stopped on the COMEX in the June delivery month so far. But this is not really silver demand per se...as all that's happening is that silver already sitting on the COMEX just changes ownership.
But silver demand from the COMEX can only go on for so long, as a huge chunk of silver sitting on the COMEX is owned privately -- and not for sale or delivery. Just how much silver is actually available for shipment on demand to the LBMA of elsewhere, is unknown...but is most certainly finite.
We're also well into the sixth year of a structural deficit in silver according to the ongoing reports from The Silver Institute. However, subscriber John Macintosh thinks it's far more than they're reporting -- and threw the b.s. flag on their latest report in an essay headlined "The Silver Institute Strikes Again" -- and linked once more here.
The vast majority of precious metals being held in these depositories are by those who won't be selling until the silver price is many multiples of what it is today...if ever.
Sprott's PSLV is the third largest depository of silver on Planet Earth with 215.6 million troy ounces...down 2.0 million oz. on the week -- and a great distance behind the COMEX, which has now been demoted to the second largest silver depository, where there are 319.2 million troy ounces being held...up a net 2.7 million troy ounces this past week...but minus the 103 million troy ounces being held in trust for SLV by JPMorgan that Ted Butler found out about many years ago.
That 103 million ounce amount brings JPMorgan's actual silver warehouse stocks down to around the 37 million troy ounce mark...quite a bit different than the 140.3 million they indicate they have -- unchanged for the fourth week in a row. They've parted with a lot of silver in the last six or so months ...around 72 million oz.
But that number doesn't include the silver that JPMorgan owns and has stored at the other COMEX-approved depositories. They've shipped out lots of that over the months and years...especially this year so far -- and a lot of it out of CNT.
PSLV remains a very long way behind SLV as well -- still the largest silver depository...with 482.9 million troy ounces as of Friday's close...down a further 3.2 million troy ounces from last week.
On a net basis since the latter parts of December -- and despite the big spike in the silver price at the end of January, just about every depository or ETF had been hemorrhaging silver. However, that outflow has declined markedly over the last two months...as I pointed out a bunch of paragraphs ago regarding the COMEX.
The latest short report [for positions held at the close of business on Friday, May 15 showed that the short position in SLV fell by 12.32%...from the 32.48 million shares sold short in the prior report...down to 28.48 million shares in the latest short report that came out earlier this week. This amount represents 5.30 percent of total SLV shares outstanding...still a bit obscene, but not nearly as bad as it was several months back. Don't forget that there's no physical silver backing any of these shorted shares as the SLV prospectus requires.
BlackRock issued a warning more than ten years ago now to all those short SLV, that there might come a time when there wouldn't be enough metal for them to cover. That would only be true if JPMorgan decides not to supply it to whatever entity requires it. Those that remain short SLV shares are in equally dire straits as those short silver in the COMEX futures market -- and I suspect that they're the same entities.
The next short report...for positions held at the close of trading on Friday, May 29 will be posted on The Wall Street Journal's website on Tuesday, June 9.
Then there's that other little matter of the monster short position in silver held by Bank of America in the OTC market...with JPMorgan & Friends on the long side. Ted said it hadn't gone away. He wrote an article about this back in April 2021 headlined "A New Piece of the Puzzle" -- and linked here.
In the article, the OCC Report stated that BofA had $8.3 billion in precious metal derivatives at the end of Q4/2020 -- but the BofA's derivatives position is now up to $120.7 billion as of the end of Q4/2025...an almost fifteen-fold increase.
A while after that article came out, he also come to the conclusion that they're short around 25 million ounces of gold with these same parties as well. Once these short covering rallies in both silver and gold begin anew...we'll see if they need to get taken over, like Bear Stearns did back in 2008 -- and for the same reason. If that's the case, JPMorgan...their counterparty to these trades ...will pick them up for next to nothing as well.
The next report from OCC should be out in about two weeks time.
![]()
The Commitment of Traders Report, for positions held at the close of COMEX trading on Tuesday, was within the margin of error I was expecting ...but with a smallish increase in the Commercial net short position in silver. However, I was way off in gold, as the commercial net short position in it increased by a lot.
But after Friday's price action, the numbers in this COT Report are 'yesterday's news' by an absolute country mile.
In silver, the Commercial net short position increased by 1,768 COMEX contracts...8.840 million troy ounces of paper silver...but some of that amount was an increase in the long positions held by Ted Butler's raptors...the small commercial traders other than the Big 8...which is only a mathematical increase, not an increase at all.
The commercial traders arrived at that number through the sale of 1,823 long contracts...but also bought back/covered 55 short contracts -- and it's the difference between those two numbers that represents their change for the reporting week.
Under the hood in the Disaggregated COT Report, all three categories of traders added to their net long positions...the Managed Money traders by 389 COMEX contracts...the Other Reportables by 1,314 contracts -- and the Nonreportable/small traders by a smallish 65 contracts.
Doing the math: 389 plus 1,314 plus 65 equals 1,768 COMEX contracts...the change in the Commercial net short position.
The Commercial net short position in silver now stands at 42,661 COMEX contracts/213.305 million troy ounces...up those 1,768 contracts from last week's report.
The Big 4 collusive commercial traders increased their net short position by 930 COMEX contracts, up to 30,842 COMEX contracts...which is only 1,000 contracts off their lowest short position on record.
The Big '5 through 8' increased their net short position by 1,277 COMEX contracts...up to 15,216 COMEX contracts -- and only about 2,200 contracts above their lowest short position on record.
The Big 8 commercial traders in total are net short 46,058 COMEX silver contracts...up 2,207 contracts on the week -- and only about 2,650 contracts above their lowest short position I have records for.
But since the Big 8 shorts accounted for 2,207 contracts -- and the Commercial net short position only rose by 1,768 COMEX contracts, that meant that Ted's raptors, the 28 small commercial traders other than the Big 8, had to have been long buyers during the reporting week -- and they were.
They increased their net long position by 2,207-1,768=439 COMEX contracts -- and now hold a net long position of 3,397 contracts.
Their act of buy long contracts had the mathematical effect of increasing the Commercial net short position by that amount during the reporting week... which isn't an increase at all. When these small traders are net long as they are now...it's only what the Big 8 commercial shorts do that matters. It's been that way forever.
Here's the 3-year COT chart for silver thanks to Nick Laird -- and updated with the above data. Click to enlarge.
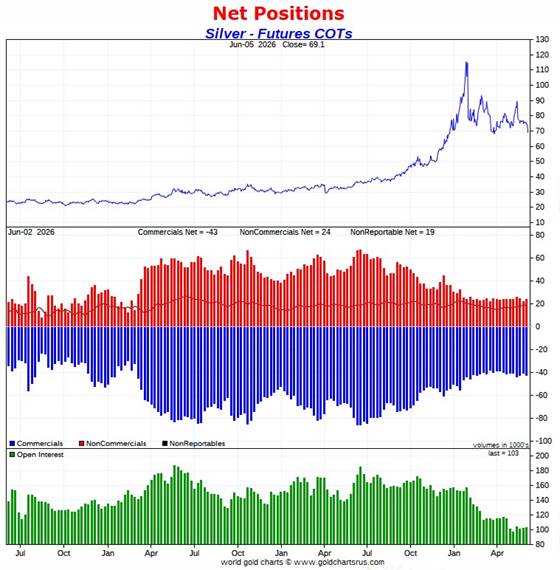
Although I was hoping for/expecting a small decrease in the Commercial net position in silver in this week's COT Report, this increase changes nothing, as the Big 8 short position in silver is only a couple of thousand contracts off its record all-time low.
And as you already know, the engineered price decline we saw in silver on Friday...will have reversed all of this week's increase...plus more, I suspect -- and it's highly likely that we're at a new record low Big 8 short position...but by just how much is open for debate. I'll have more on this later.
The Big 8 commercial traders are net short 44.8 percent of total open interest in silver in the COMEX futures market...up from the 43.1 percent they were short in last week's COT Report.
It nearly goes without saying that from a COMEX futures market perspective, the set-up in silver remains incandescently white-hot bullish...just waiting for 'da boyz' to set it free.
![]()
In gold, the commercial net short position rose by a hefty 20,579 contracts/ 2.058 million troy ounces of paper gold -- and a very long way off what I was expecting.
They arrived at that number through the sale of 20,790 long contracts...but also bought back/covered 211 short contracts -- and it's the difference between those two numbers that represents their change for the reporting week.
Under the hood in the Disaggregated COT Report, the Managed Money and Other Reportables were the big buyers, increasing their net long positions by 14,733 and 7,027 COMEX contracts respectively. This meant that the Nonreportable/ small traders had to have reduced their net long position by a bit -- and they did so to the tune of 1,181 contracts.
Doing the math: 14,733 plus 7,027 minus 1,181 equals 20,579 COMEX contracts...the change in the commercial net short position, which it must do.
The commercial net short position in gold now stands at 206,345 COMEX contracts/20.635 million troy ounces...up those 20,579 contracts from last week's report.
The Big 4 commercial traders increased their net short position by 3,467 COMEX contracts, up to 126,834 contracts -- and only about 5,000 contracts above their lowest short position that I have records for.
The Big '5 through 8' commercial traders also increased their net short position...them by a very hefty 9,398 contracts, up to 47,929 COMEX contracts...their largest short position since March 24.
The Big 8 commercial traders in total are net short 174,763 COMEX contracts...up 12,865 contracts from last week -- and their biggest short position since March 17.
But since the commercial net short position increased by 20,579 COMEX contracts -- and the Big 8 only accounted for only 12,865 of those contracts... that meant that Ted's raptors, the 38 small commercial traders other than the Big 8, had to have been big sellers as well during the reporting week -- and they were. They increased their net short position by 20,579-12,865=7,714 contracts -- and are now net short 31,582 COMEX contracts... their largest short position since May 12.
And like they currently are in silver, they would normally be net long gold by many thousands of contracts at this point in the price cycle -- and why they're not this time around, I have no idea...but suspect that they have been recruited into the trenches in the fight to prevent a massive rise in the gold price. But if they weren't short this amount -- and net long those thousands of contracts that they normally would be, it's a guarantee that gold would be many, many thousands of dollars higher in price than it is now.
I suspect that no more than two or three of these small commercial traders hold the vast majority of this short position...so it's the 'Big 10 or 11' -- and not just the 'Big 8' traders that are running the gold price management show.
Here's Nick's 3-year COT chart for gold -- and updated with the above data. Click to enlarge.
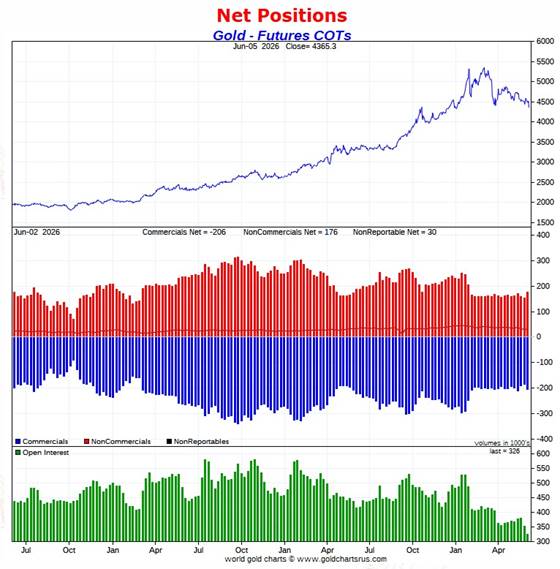
This huge increase in the commercial net short position in gold came as a surprise, as the trading action, plus the fumes & vapours volume during the reporting week, indicated nothing of the kind.
But, like in silver, this COT Report is also 'yesterday's news' by a country mile or more -- and one has to suspect that after Friday's bear raid, we're at a new record low Big 8 short position in gold.
The Big 8 are now are short 53.6 percent of total open interest in gold in the COMEX futures market...up big from the 45.8% they were short in last week's report -- and also up big because of another huge drop [27,437 COMEX contracts] in total open interest during the reporting week, which obviously affects the percentage calculation. That decline was certainly related to the first two day of deliveries in the June contract.
However, unlike silver, the commercial net short position in gold is much larger than the Big 8 short position...because the rest of the collusive commercial traders, Ted Butler's raptors, are also net short gold. Adding them into the mix, which you have to do, puts the commercial net short position in gold at 63.3 percent of total open interest in the COMEX futures market...up from the 52.6% that they were short in last week's report -- with part of that big increase because of the big drop in open interest mentioned in the previous paragraph.
And if you subtract out the uneconomic and market-neutral spread trades, the commercial net short position in gold soars to well north of 70% of total open interest...which is grotesque beyond belief.
Despite this outlandish short position, the set-up in gold from a COMEX futures market perspective is back to monstrously bullish because of Friday's price action -- and because of that, we remain on the launchpad for a major rally in gold...but, like in silver, that will only transpire when allowed.
![]()
In the other metals, the Managed Money traders in palladium increased their net short position by a further 281 COMEX contracts -- and remain net short palladium by 3,491 COMEX contracts.
The commercial traders in the Swap Dealers category are net long palladium by 2,294 contracts -- but the commercial traders in the Producer/Merchant category are net short 999 COMEX contracts. The traders in the Other Reportables are net long 1,485 contracts in this metal at the moment -- and the Nonreportable/small trader categories are net long 711 COMEX contracts.
As I keep pointing out about these numbers, palladium is a very dinky market.
Total open interest is only 16,284 COMEX contracts...a decrease of a further 408 contracts this past reporting week...still about the lowest it's been since mid-2023. Open interest in platinum is also about the lowest since that time as well.
The world's banks are net short 9.3 percent of total open interest in palladium in the COMEX futures market as of the June Bank Participation Report that came yesterday...which is a decrease from the 12.1 percent that they were net short in May's Bank Participation Report.
This is a very strange and twisted market once you get a look into its internal structure -- and as I point out in every monthly Bank Participation Report, the only reason that there's a COMEX futures market in palladium is so the collusive commercial traders of whatever stripe can manage its price.
In platinum the Managed Money traders decreased their net long position by a further 1,008 COMEX contracts -- but remain net long platinum by 11,814 contracts. The traders in the Other Reportables and Nonreportable/ small trader category remain net long platinum by very respectable amounts as well.
The commercial traders in the Producer/Merchant category in platinum are net short 13,872 COMEX contracts. The Swap Dealers are net short platinum by 9,512 COMEX contracts. Their short positions only changed by a handful of contracts during the reporting week.
It's mostly the world's banks that are 'The Big Shorts' in platinum in the COMEX futures market, as per June's Bank Participation Report that came out yesterday -- but haven't done much of anything in platinum in the last five months, in aggregate.
In copper, the Managed Money traders increased their net long position by 5,247 COMEX contracts during the past reporting week -- and are now net long copper by 75,747 contracts...1.894 billion pounds of the stuff. The traders in the Other Reportables and Nonreportable categories are net long copper as well.
Copper, like palladium, continues to be a wildly bifurcated market in the commercial category. The Producer/Merchant category is net short 114,904 copper contracts/ 2.873 billion pounds -- while the Swap Dealers are net long 26,259 COMEX contracts/656 million pounds of the stuff.
Whether this dichotomy in copper means anything or not, will only be known in the fullness of time. Ted Butler said it didn't mean anything as far as he was concerned, as they're all commercial traders in the commercial category. But this bifurcation has been in place for as many years as I've been keeping records -- and that's a very long time....10+ years.
In this vital industrial commodity, the world's banks...both U.S. and foreign... are net short copper by 2.1% of total open interest in the June Bank Participation Report. Back in the October 2025 BPR, these same banks were net long 0.90% of the total open interest in copper in the COMEX futures market. So basically they're market neutral...but only numerically, as that dichotomy between the two groups of commercial traders is still there.
At the moment it's all the commodity trading houses such as Glencore and Trafigura et al., along with some hedge funds, that are mega net short copper in the Producer/Merchant category, as the Swap Dealers are net long, as pointed out above.
The next Bank Participation Report for the June trading period is due out on Friday, July 10.
![]()
Here’s Nick Laird’s “Days to Cover” chart, updated with the COT data for positions held at the close of COMEX trading on Tuesday, June 2. It shows the days of world production that it would take to cover the short positions of the Big 4 — and Big '5 through 8' traders in every physically traded commodity on the COMEX. This chart is a graphical representation of what's shown in the COT Report above. Click to enlarge.
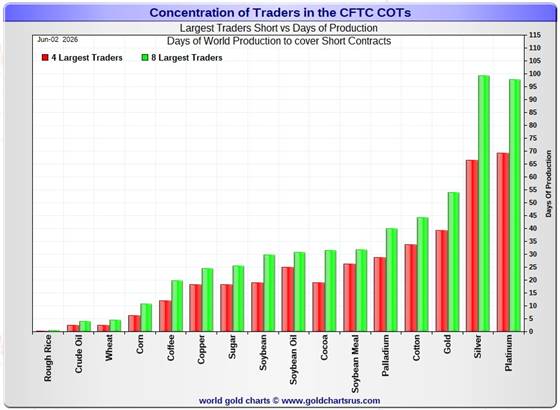
In this week's data, the Big 4 traders are short about 66 days of world silver production...up about 2 days from the prior COT report. The ‘5 through 8’ large traders are short an additional 33 days of world silver production...also up about 2 days from last week's report...for a total of 99 days that the Big 8 are short...and up 4 days from that last Friday's COT Report.
Those 99 days that the Big 8 traders are currently short, represents about 3.3 months of world silver production, or 239.290 million troy ounces/46,058 COMEX contracts. That's up from the 219.255 million troy ounces/43,851 contracts in last Friday's COT Report. Of course this all 'yesterday's news' as well.
In gold, the Big 4 are short about 39 days of world gold production...up 1 day from the prior report -- and the Big '5 through 8' are short an additional 15 days of world production...up about 3 days from last week, for a total of 54 days of world gold production held short by the Big 8 commercial traders -- and obviously up 4 days from last week.
In silver, I suspect that a goodly chunk of the gross short position in the Big 4 commercial category is mostly held by only two traders...both of them U.S. banks...Wells Fargo and BofA. In yesterday's Bank Participation Report, 5 U.S. bullion banks held a gross short position of 12,884 COMEX contracts...down a whole bunch from April -- and their lowest short position on record.
Although it shows as No. 2 on the above chart, silver is now back in No. 1 spot with the largest number of days of production held short...bumping platinum into No. 2 position by 1 day's worth. This chart is also a graphical representation of why I consider platinum to be 'da boyz' No. 2 problem child after silver -- and it's a big problem child.
I also note from this chart that, for the eighth week in a row, cotton has knocked palladium out of the number four spot -- and into fifth place.
The short position in SLV now sits at 28.48 million shares/troy ounces as of the latest short report that came out on Wednesday, May 27...for positions held at the close of trading on Friday, May 15. This represents a decrease of 12.32% from the prior report. This 28.48 million share number, which represents 5.28% of total SLV shares outstanding, is not as off-the-charts grotesque and obscene as it used to be -- but realistically should be something less than half that amount.
Don't forget that there's not a single solitary troy ounce of silver backing any of these shorted shares as the SLV prospectus requires.
The next short report...for positions held at the close of business on Friday, May 29...is due out on Tuesday, June 9. I'm sure that 'da boyz' were covering short their short positions in SLV hand over fist on Friday -- and it's just too bad that this data won't be in next week's report.
In the overall in yesterday's COT Report, the short positions of the Big 8 commercial traders in silver increased by a smallish amount. In gold, the Big 8 increased their short position by a noticeable amount. But after yesterday's price action, these number are meaninglessness.
As Ted Butler pointed out quite often over the years, the resolution of the Big 4/8 short positions will be the sole determinant of precious metal prices going forward...although that short position in gold held by his raptors continues to be a negative factor -- and it did increase by a noticeable amount during this past reporting week. However, under normal circumstances, it wouldn't be there at all.
And as he also pointed out over the years, there would come a time when what the numbers show in the COT Report won't matter, as events in the real world...whatever they may be...will overtake them. That hasn't happened yet...but someday it will.
All that we await now, is the denouement that follows. The big bear raids we've endured over the last many months, weeks and days...including the one yesterday...are all part and parcel of the process to keep their respective prices in line...plus allow the collusive commercial traders of whatever stripe to cover as many short positions as possible...until that moment arrives.
![]()
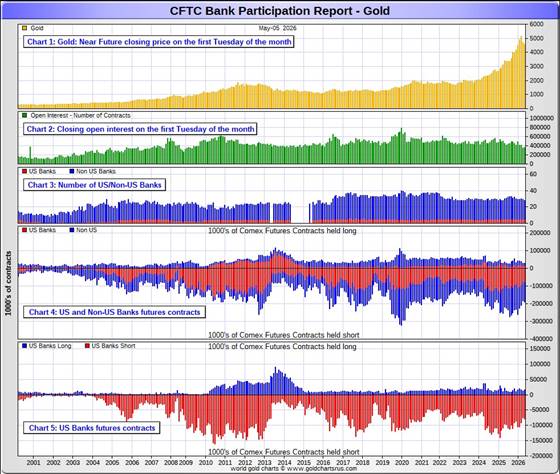
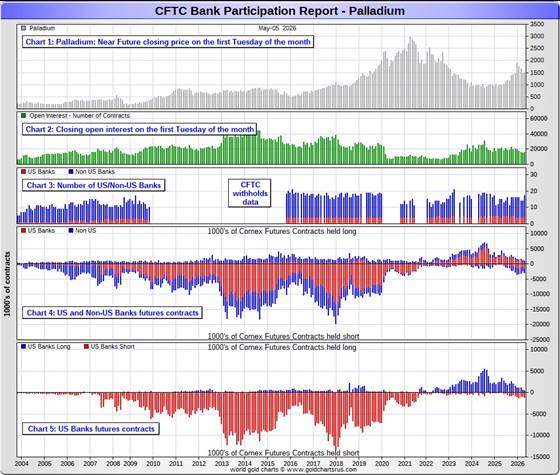
The June Bank Participation Report [BPR] data is extracted directly from yesterday's Commitment of Traders Report. It shows the number of futures contracts, both long and short, that are held by all the U.S. and non-U.S. banks as of Tuesday’s cut-off in all COMEX-traded products.
For this one day a month we get to see what the world’s banks have been up to in the precious metals. They’re usually up to quite a bit -- but didn't do much this past month, which was my speculation about it in The Wrap in yesterday's missive.
[The June Bank Participation Report covers the four-week time period from May 5...to June 2 inclusive]
In gold, 5 U.S. banks are net short 66,002 COMEX contracts, up an inconsequential 2,324 contracts from the 63,678 contracts that these same 5 U.S. banks were net short in the May BPR.
Also in gold, 23 non-U.S. banks are net short 92,014 COMEX contracts, down 3,957 contracts from the 95,971 contracts that these same 23 non-U.S. banks were net short in May's BPR. This is their lowest short position since January 2025.
At the low back in the August 2018 BPR...these non-U.S. banks held a net short position in gold of only 1,960 contacts -- so they've been back on the short side in a gargantuan way ever since. Only a handful of these banks hold meaningful short positions in gold. The short positions of the rest are of no consequence -- and never have been.
Although most of the largest U.S. and foreign bullion banks are in the Big 8 short category, some of the hedge fund/commodity trading houses are short large amounts of gold in that category as well. There's also the possibility that the BIS could be short gold in the COMEX futures market.
As of June's Bank Participation Report, 28 banks [both U.S. and foreign] were net short 48.5 percent of the entire open interest in gold in the COMEX futures market...up from the 43.4 percent that these same 28 banks were net short in the May BPR -- and up that amount because of the big drop in open interest during the reporting month, which obviously affects the percentage calculation.
And if you remember from the above COT Report, the commercial net short position in gold was 63.3 percent of total open interest -- and if you subtract out the 48.5 percent held short by the banks...only 63.3-48.5=14.8 percentage points of the commercial net short position is not held by the banks. How's that for a concentrated and manipulative short position?
Here’s Nick’s BPR chart for gold going back to 2000. Charts #4 and #5 are the key ones here. Note the blow-out in the short positions of the non-U.S. banks [the blue bars in chart #4] when Scotiabank’s COMEX short position was outed by the CFTC in October of 2012. Click to enlarge.
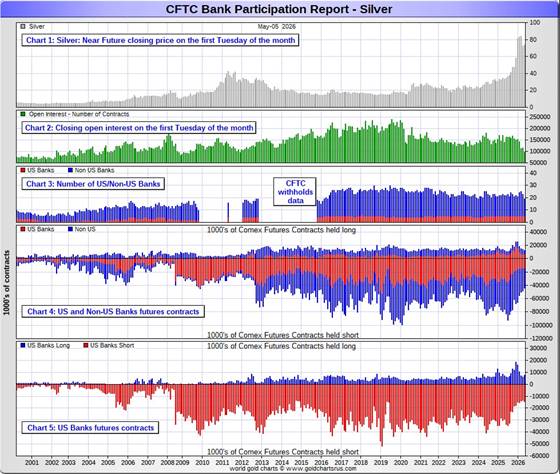
In silver, 5 U.S. banks are net short only 6,096 COMEX contracts...down 833 contracts from the 6,929 contracts they were net short in the May BPR -- and their lowest net short position since January.
But the number I really wanted to see was the change in their gross short position. In the December BPR it was 17,838 contracts, in January's it was 15,099 contracts, in February's it was 15,414, in March's, it was down to 14,048 contracts -- and in April it was 13,427 COMEX contracts. However, in May's report, that number jumped up to 14,558 contracts. But in yesterday's June BPR, that number was down to 12,884 contracts which, without doubt, is their lowest gross short position in silver, ever. It's even lower than that now.
The five U.S. banks that are net short silver would be Citigroup, Wells Fargo, Bank of America, Goldman Sachs -- and Morgan Stanley...with by far the lion's share held by no more than two of these banks...most likely BofA and Wells Fargo.
Also in silver, 16 non-U.S. banks are net short 26,775 COMEX contracts, up 2,255 contracts from the 24,520 contracts that 14 non-U.S. banks were net short in the May BPR. This remains very close to their smallest net short position since February 2024.
It's a given, based on silver deliveries in 2025 -- and so far in 2026...that HSBC, Barclays, Standard Chartered, BNP Paribas, Deutsche Bank and Macquarie Futures hold by far the lion's share of the short positions of these non-U.S. banks. Canada's Bank of Montreal is a card-carrying member of this group as well.
And, like in gold, the BIS could also be actively shorting silver. However, the remaining short positions in silver, divided up between the rest of the of the non-U.S. banks, are immaterial — and have always been so....the same as most of the 23 non-U.S. banks in gold as well.
As of June's Bank Participation Report, 21 banks [both U.S. and foreign] were net short 32.0 percent of the entire open interest in silver in the COMEX futures market — down a tad from the 32.5 percent that 19 banks were net short in the May BPR.
Here’s the BPR chart for silver. Note in Chart #4 the blow-out in the non-U.S. bank short position [blue bars] in October of 2012 when Scotiabank was brought in from the cold. Also note August 2008 when JPMorgan took over the silver short position of Bear Stearns—the red bars. It’s very noticeable in Chart #4—and really stands out like the proverbial sore thumb it is in chart #5. Click to enlarge.
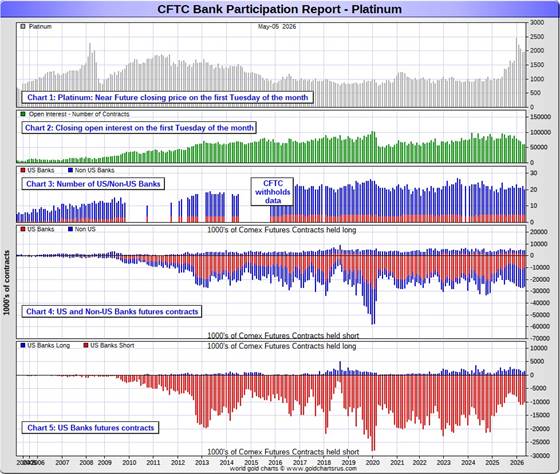
In platinum, 5 U.S. banks are net short 8,220 COMEX contracts in the June BPR, down a tiny 327 contracts from the 8,547 contracts that these same 5 U.S. banks were short in the May BPR. This is the second month in a row that these U.S. banks have reduced their short position in platinum...albeit not by much.
At the 'low' back in September of 2018, these U.S. banks were actually net long the platinum market by 2,573 contracts...so they still have more work to do to get back to market neutral...if they ever intend to.
Also in platinum, 15 non-U.S. banks increased their net short position by a further 1,325 contracts... from 13,022 contracts held by 15 banks in May's BPR...up to 14,347 contracts in the June BPR. This is 5.87x the amount they held short in the May/25 BPR, so they've been gone back on the short side in platinum by a huge amount since then.
Back in the December 2023 BPR, these non-U.S. banks were net short a microscopic 35 platinum contracts...so they have yeoman work to do if they ever want to get back to even close to that number. I doubt that they'll ever accomplish that -- and are permanently stuck with this short position.
As you know, platinum remains the big commercial shorts No. 2 problem child after silver -- and there's now a long-term structural deficit in it [and palladium] as well.
As of June's Bank Participation Report, 20 banks [both U.S. and foreign] were net short 34.4 percent of platinum's total open interest in the COMEX futures market, down from the 35.6 percent that those same 20 banks were net short in May's BPR -- and down because of the increase in total open interest.
Here's the Bank Participation Report chart for platinum. Click to enlarge.
In palladium, 4 U.S. banks are net short 378 COMEX contracts in the June BPR, a decrease of 361 contracts from May.
Also in palladium, 13 non-U.S. banks are net short by 1,136 COMEX contracts ... a decrease of 25 contracts from the 1,161 contracts that these same 13 non-U.S. banks were net short in the May BPR.
None of this mean anything considering how tiny these amounts are... especially when divided up between 17 banks.
And as I've been commenting on for almost forever, the COMEX futures market in palladium is a market in name only, because it's so illiquid and thinly-traded. Its total open interest in yesterday's COT Report was only 16,284 contracts...compared to 65,697 contracts of total open interest in platinum...102,809 contracts in silver -- and 326,052 COMEX contracts in gold.
Total open interest in palladium has increased quite a bit over the last ten or so years, because I remember when it was less than 9,000 contracts on average. So it's nowhere near as illiquid as it used to be -- and it's also been helped along by the fact that the bid/ask is now down to only 40 bucks. It used to be $150 at one point way back when.
As I say in this spot every month, the only reason that there's a futures market at all in palladium, is so that the Big 8 commercial traders can control its price. That's all there is, there ain't no more.
As of this Bank Participation Report, 17 banks [both U.S. and foreign] are net short 9.3 percent of total open interest in palladium in the COMEX futures market...down from the 12.1 percent of total open interest that these same 17 banks were net short in the May BPR.
For the last 5 years or so, the world's banks have not been involved in the palladium market in a material way...see its chart below. Even with all the world's banks back on the short side by a bit now...it's almost all hedge funds and commodity trading houses on the short side.
The Big 8 shorts, none of which are banks, are net short 43.2 percent of total open interest in palladium as of yesterday's COT Report...up a bit from the 41.1 percent of total open interest they were short a month ago.
Here’s the palladium BPR chart -- and it remains to be seen if they return as big short sellers again at some point like they've done in the past. Click to enlarge.
Excluding palladium, most likely no more than a dozen or so banks in total -- and mostly U.S. and U.K.-based...along with French bank BNP Paribas and Deutsche Bank...continue to hold meaningful short positions in the other three precious metals...although I won't let Canada's Bank of Montreal or Australia's Macquarie Futures off the hook just yet.
As I pointed out above, some of the world's commodity trading houses and hedge funds are also net short the four precious metals. They have the ability to affect prices if they choose to exercise it. But it's still the collusive Anglo/ American/Western bullion bank cartel in the commercial category that are at Ground Zero of the price management scheme in the COMEX futures market.
But, like Friday's COT Report, this Bank Participation Report falls into the 'yesterday's news' category as well.
And as has been the case for several decades now, the short positions held by the Big 4/8 traders is the only thing that matters...especially the short positions of the Big 4...or maybe only the Big 1 or 2 in silver. How this is ultimately resolved [as Ted kept pointing out] will be the sole determinant of precious metal prices going forward.
Considering the current state of affairs of the world as they stand today -- and the structural deficit in silver -- and now in platinum and palladium as well, the chance that these big bullion banks and commodity trading houses could get overrun at some point, is no longer zero -- and certainly within the realm of possibility if things go totally non-linear somewhere.
But...as Ted kept reminding us...if they do finally get overrun, it will be for the very first time. And it was patently obvious that the collusive commercial traders of whatever stripe had to step in multiple times over the last five months in order to prevent exactly that from happening. If they hadn't, Ted Butler's "Bonfire of the Silver Shorts" would have become a reality within days...if not hours.
The next Bank Participation Report for trading in June is due out on Friday, July 10.
![]()
CRITICAL READS
U.S. payrolls rose by 172,000 in May, much more than expected; unemployment at 4.3%
Job growth unexpectedly surged in May as the U.S. labor market continued a solid year of expansion, the Bureau of Labor Statistics reported Friday.
Non-farm payrolls jumped a seasonally adjusted 172,000 for the period, down slightly from the upwardly revised 179,000 in April and far above the Dow Jones consensus estimate for 80,000. The unemployment rate held steady at 4.3%, as expected.
“This is a labor market that is stronger than it was last year and is looking pretty darn solid, despite high energy prices and higher inflation generally,” said Gus Faucher, chief economist at PNC. “There’s no indication that the labor market needs support.”
Breadth of job gains improved in May, with multiple sectors seeing solid advances.
Leisure and hospitality led all sectors with 70,000 jobs, well above the 14,000 per month average over the past year and a possible reaction to hiring needed for the World Cup.
Local government added 55,000.
Health care, which has been the leading sector, contributed 35,000 new hires, about in line with its average. Social assistance added 12,000.
This CNBC news item was posted on their website at 8:31 a.m. on Friday morning EDT -- and comes to us courtesy of Swedish reader Patrik Ekdahl. Another link to it is here. Market maven Alyosha had something to say about this yesterday in his substack account headlined "downward mobility" -- and linked here. I thank Roy Stephens for that. The Zero Hedge spin on this... headlined "U.S. Jobs Soar By 172K in May, Smashing Estimates in 4 Sigma Beat; Unemployment Rate Remains at 4.3%"....is linked here.
![]()
The Mania and the Frog -- Doug Noland
Monetary disorder evolved to become deeply systemic. It was on full display this week, especially Friday. The mania and the frog in the pot syndrome. Instability has been percolating (fragilities building) for so long that we’re numb to it all. In the markets, it’s more than comfortably – it has become exuberantly, manically numb.
This is an acutely precarious market backdrop. As we’ve witnessed repeatedly, fledgling “risk off” market pullbacks foreshadow abrupt market reversals, short squeezes, the unwind of bearish hedges, “buy the dip,” FOMO, liquidity overabundance, and intensifying market melt-ups. Market dynamics have dramatically favored risk-taking and speculative leveraging. For a while, disregarding risk has been systematically rewarded.
All that said, we’ve quickly returned to an environment where risk should be taken seriously. Some of the same dynamics that fueled a historic market speculative blow-off could now trigger downside market instability, illiquidity, panic, and dislocation. In recent years, I’ve increasingly drawn parallels between the current Bubble backdrop and the “Roaring Twenties.” It’s worth noting that the 1929 crash lacked a clear catalyst. The fateful final bout of blow-off excess reversed abruptly, completely blindsiding everyone.
Doug's weekly market commentary is always worth reading -- and this iteration appeared on his website around 11:30 p.m. PDT on Friday night. Another link to it is here.
![]()
Two interesting and worthwhile video interviews
1. Will Israeli Officials Blow Up any U.S./Iran Peace? -- Professor Jeffrey Sachs
This 28-minute video interview with the professor was hosted by Judge Andrew Napolitano on Friday morning EDT -- and is certainly worth watching if you have the interest. I thank Guido Tricot for sending it our way -- and the one that follows. The link to this one is here.
2. INTEL Roundtable w/Larry Johnson & Ray McGovern : Weekly Wrap: 5 June
![]()
This informative 26-minute video interview with former CIA analysts McGovern and Johnson was also hosted by the Judge. It appeared on the youtube.com Internet site very late on Friday afternoon EDT -- and the link to it is here.
![]()
U.S. Military Shoots Down Inbound Iranian Attack Drones Over Hormuz, Bombs Coastal Sites
Summary:
- The U.S. reportedly military intercepted and shot down at least four Iranian one-way attack drones
- CENTCOM says coastal radar and missile sites bombed in retaliation.
- Iran Military Fires "Warning Missiles" at U.S. Destroyers in Gulf of Oman; U.S. CENTCOM Denies Report
- Iran foreign minister Warns American Bases Are Legitimate Targets, Cites 'No Tangible Progress' in Talks
This updated news item showed up on the Zero Hedge website at 9:20 p.m. EDT on Friday evening -- and another link to it is here.
![]()
Wars today are no longer real wars – they are coordinated, ongoing, planned conflicts
Perpetual war can only lead to perpetual fear, crisis, and chaos, which is why perpetual mass slavery is forever the end result. At this point, this should be obvious to even the most ignorant among us, but indifference and false "patriotism" stand in the way of intellectual common sense, so without a collective revolt of individuals, only a system of technocratic tyranny will remain. That is our fate if the general public continues to accept and support this organized criminal government clique.
Given the current "public" sentiment and the false belief that things will somehow get better if only we get the right "leaders" in office, this is exactly what the ruling class is counting on to be able to continue this transformation to centralized and digitized technocratic world governance. They can still be stopped, but doing so requires individuals across the country to ignore and never accept this AI, biometric and transhumanist pressure orchestrated by this fascist government/corporate mafia. Even I didn't think I would live to see in my life what has happened so far, and the utterly ridiculous nature of these incredible and insane times. Everything is now on the table, without any rules or moral positions accepted by virtually the entire government, the media and the rest of the oligarchic monsters that have taken control of the minds and bodies of this population; a population that seems to have already accepted its fate of mass subjugation. "You shall own nothing and be happy " is the perfect description for what is to come, writes Gary D. Barnett.
Many, especially in the "alternative" circles, have talked about the prospect of World War III breaking out soon, but that war began in earnest in early 2020 with the false flag operation called the "covid pandemic," a fraudulent, fabricated hoax to test the obedience of the general population. Everything went according to plan, as virtually every country on Earth acted in full coordination at the same time. This should have been impossible, of course, but it says a lot about the conspiracy of the ruling class and the credibility of the ruled masses.
WWIII, as you can see, is a very different war than in the past, because it means that almost every country is at war internally; Essentially, this is the moment when virtually all governments are at war against their own people at the same time, under the guise of protecting the subjects from monsters from afar.
This very worthwhile -- and must read commentary showed up on the frontnieuws.com Internet site a week ago -- and for obvious length and content reasons, had to wait for my Saturday column. I thank Bert Uni for pointing it out -- and another link to it is here.
![]()
The Iran war is the start of WW3 -- Professor Richard Werner
In my opinion, WW3 started back in 2014 with the overthrow of the Ukrainian government by the Epstein Deep State. I posted a long video interview with the professor in last Saturday's column that was hosted by Tucker Carlson. Werner is back again in this 48-minute video with host Mario Nawfal that was posted on the youtube.com Internet site last Sunday and, like the previous article, had to wait for today's column for length and content reasons. I thank Judy Sturgis for sharing it with us -- and another link to it is here.
![]()
BRICS prepares gold-backed settlement token framework -- The Banker
BRICS countries have prepared a draft framework for a blockchain-based settlement token designed for cross-border transactions between central banks, according to officials involved in the discussions. If implemented, it could become the bloc's most significant financial integration initiative.
Discussions regarding the new digital settlement architecture are expected to gain momentum during India’s BRICS presidency in 2026.
That's all of this story that's posted in the clear at thebanker.com Internet site on Friday. The rest of it is behind their paywall -- and I found it on Sharps Pixley. Another link to it is here.
![]()
Perth Mint’s May gold sales hit over one-year low
Perth Mint’s gold product sales hit a more than one-year low in May, while silver sales declined 27% month-on-month, the refiner said on Friday.
Sales of gold coins and minted bars last month fell 58% from April to 19,430 ounces, and were down 31% on a year-on-year basis.
Silver sales fell to 363,976 ounces last month from 496,212 ounces in April, and were down about 27% on a year-on-year basis.
“Following an extraordinary start to the year, precious metals sales have eased as gold and silver prices softened from their recent highs and investors increasingly turned their attention to other asset classes,” said Neil Vance, general manager-minted products, Perth Mint.
This Reuters story from Friday was picked up by the mining.com Internet site -- and I found it on Sharps Pixley. Another link to it is here.
![]()
QUOTE of the DAY

![]()
The WRAP
"Understand this. Things are now in motion that cannot be undone." -- Gandalf the White
![]()
I don't know how it's possible, but today's pop 'blast from the past' is 48 years young. It was a single from their second album of the same name. The song reached No. 2 on the Billboard Hot 100 chart for two weeks in 1978. It was also a top 10 hit in Canada. Neither the song, nor the group should need any introduction -- and the link to it is here. Of course there's a bass cover to this -- and that's linked here.
Today's classical 'blast from the past' is the Overture from A Midsummer Night's Dream. The overture, in E major, Op. 21, was composed by Felix Mendelssohn when he was 17 years and 6 months young (it was finished on 6 August 1826).
Well, dear reader, I'm not sure what you were doing at that age...but it certainly wasn't this. Me neither. Here's the Frankfurt Radio Symphony Orchestra in a live recording from 01 November 2024. Maestro Sebastian Weigle conducts -- and the link is here.
![]()
Without doubt, the collusive commercial traders had the non-farm payroll number in hand before it was made public at 8:30 a.m. EDT. They were so enthusiastic in their efforts, that the engineered sell-offs in the precious metals -- and that short covering rally in the dollar index, all commenced 3-5 minutes before that number was even posted.
And they were utterly ruthless from that point onwards because...as I stated in The Wrap in Friday's column..."regardless of what [that report] shows, I'm sure that the precious metals will 'react' to it in whatever manner the Big 8 shorts decide." That's precisely what happened.
The first casualty, amongst many, was gold's 200-day moving average...which they blew through with ease -- and got silver within a dollar of its 200-day m.a. Both are rapidly approaching oversold on their respective RSI traces -- and barring big rallies in both on Monday, should be at or very close to those marks by the end of that trading session.
They now have the prices of both back to where they were in mid December ...taking all of this year's gains with them in the process.
The volumes in both were far heavier than we've seen in a long time...but barely 'average' in the grand scheme of things -- and as I pointed out earlier the CME Group didn't get around to posting their Preliminary Report at its usual time...around 12:30 a.m. in the morning EDT. I waited until 3 a.m. EDT...but still nothing, so I doubt they'll post it now -- and the final report will show up on Monday morning. Too bad, as I would have dearly loved to see what transpired on Friday. If I remember, I'll update the website version of today's missive with this data sometime before noon EDT on Monday.
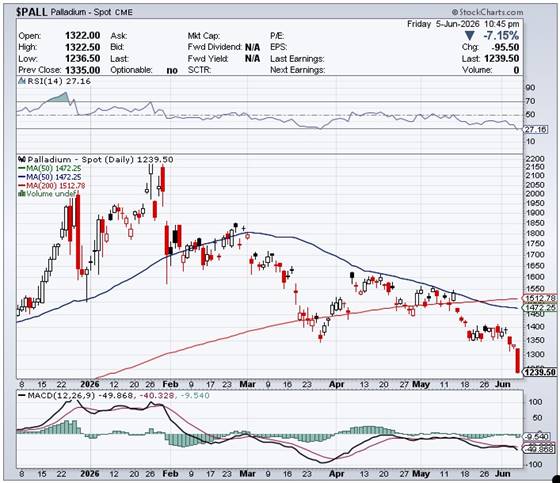
The next casualty was platinum, as 'da boyz' engineered it far below its 200-day moving average -- and back at a price not see since mid December of last year as well. Palladium was crushed even further below any moving averages that mattered -- and at a price not seen since the beginning of October last year.
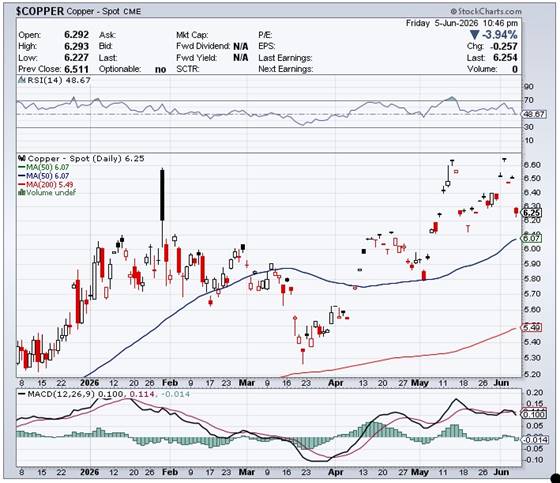
Those collusive commercial traders didn't spare copper, either...as it was clubbed by 25.7 cents -- and finished the Friday session at $6.25/pound.
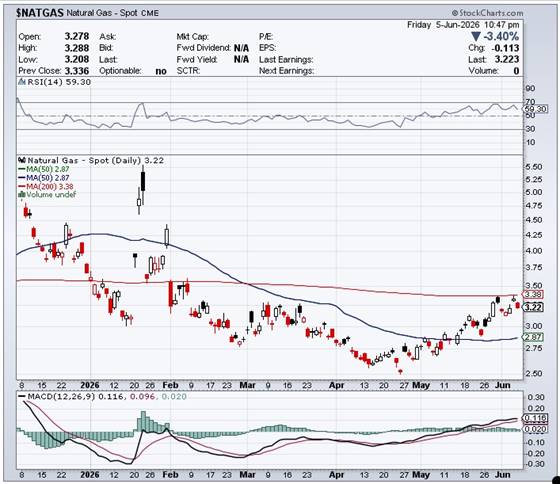
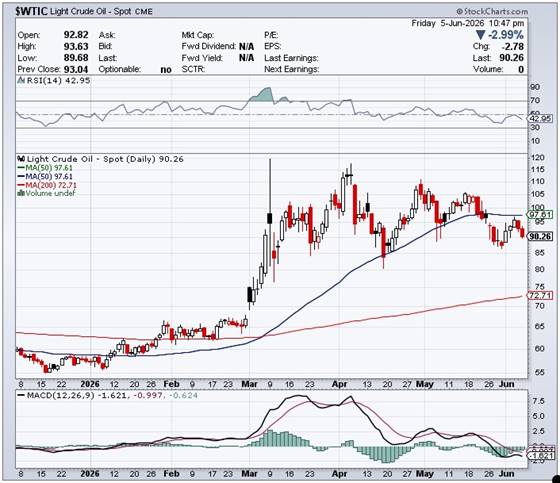
Natural gas [chart included] wasn't spared...as it was closed lower by 11.3 cents at $3.23/1,000 cubic feet. 'Da boyz' made a clean sweep of it, as WTIC was hit by $2.78...closing at $90.26/barrel.
Here are the 6-month charts for the Big 6+1 commodities for Friday -- thanks to stockcharts.com as always. Click to enlarge.
I was working on the Commitment of Traders Report data on Friday afternoon, when the phone rang -- and after I said hello, the voice said..."Ted Butler was right. One should never underestimate the treachery of the collusive Big 8 commercial shorts." It was reader John Glavin, who was as amazed by their treachery as I.
Using the non-farm payroll number -- and that rather anemic-looking short covering rally in the DXY as the fig leafs to hide behind, they took no prisoners. The sole purpose of their Friday bear raid was to cover as many of their short positions as they could -- and had zero to do with the jobs report.
They also wanted to ensure that there was no safe haven from a wobbly stock market...except for the dollar and treasuries...which didn't help the latter much, as yields rose anyway.
What went down yesterday should be obvious, as you've seen this movie before many times over the years -- and they've always ended the same way ...with sharply higher prices -- and new record highs further down the road. This will be the case again this time...but only when they allow it, as I keep pointing out ad nauseam.
Don't forget that from a COMEX futures market perspective, the set-up for major rallies in the four precious metals was already incandescent white-hot bullish -- and after Friday's engineered price declines, there's even more icing on that cake.
I would be happy to pay a fair amount of coin to get a peek at a COT Report as of the close of trading on Friday afternoon, just to find out how successful 'da boyz' were in shaking any more long contracts out of the Managed Money traders et al.
Even before the Friday trading session began, the short positions of the Big 8 commercial shorts was only a tiny chip shot away from their lowest short positions on record...and were picking up nickels in front of those proverbial steamrollers...as the Managed Money traders were showing ever-greater reluctance in reducing their long positions, or going further short.
But without doubt, the collusive commercial traders of whatever stripe were able to reduce their respective short positions in all four precious metals... most likely by decent amounts. The only question remaining is...were the Big 8 shorts able to get back to their respective record lows of April 7...or were they more successful than that? And because of their ferocity on Friday, I suspect the latter...but won't have proof until next Friday's COT Report.
There are still two more trading days between now and the COMEX close on Tuesday...the cut-off for that report -- and as you know, anything can happen between now and then.
Because this particular column, which includes the monthly Bank Participation Report, is my longest of the month, I just didn't have the time to call my broker and buy anything yesterday...but will do so on Monday, no matter what's happening in the precious metals space at that particular time. When there's blood like this running in the streets, I'm not prepared to look this gift horse in the mouth that the shorts have provided.
In that phone conversation I had with John Glavin that I mentioned a few paragraphs ago, he was also of the opinion that with the shorts on the offensive right up until the close of trading on Friday, there's a very strong possibility that 'da boyz' will push their advantage at the Globex open in New York on Sunday evening. That's a logic I can't argue with -- but as I pointed out to him, if that turned out to be the case...I was prepared to bet that it will be their last swing for the fences.
And like every other obstacle throw in the path of the repricing of the entire commodities complex in general -- and the precious metals in particular over the last several years...this too shall pass.
I'm still 'all in' and, as always, will remain so to whatever end.
I'm done for the day -- and the week -- and I'll see you here on Tuesday.
Ed
About the author

SUBSCRIBE: https://edsteergoldsilver.com/

Ed Steer’s Daily Analysis of the Gold and Silver Markets
After eight years of writing about the precious metals for Casey Research, the folks at Stansberry & Associates—who just recently purchased controlling interest in the company—decided that my ‘niche market’ column didn’t fit into their plans.
Since the time that Casey Research was kind enough to offer me a stand-alone column, it became their most highly-rated blog almost from the outset—and has remained that way up to this date...