
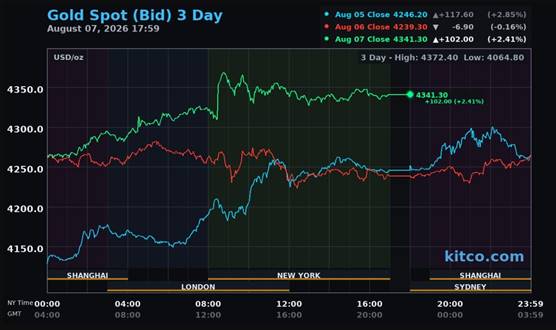
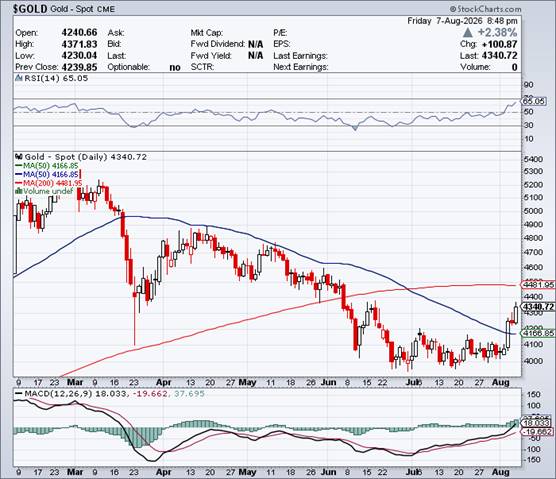
The gold price began to head higher the moment that the markets opened in Shanghai on their Friday morning -- and that state of affairs was allowed to last until it rolled over a bit starting at the noon silver fix in London. It then went vertical on the ugly non-farm payroll number at 8:30 a.m. EDT -- and only took 'da boyz' fifteen minutes to get that under control. It was then sold/ engineered quietly and a bit unevenly lower until exactly 1:00 p.m. in COMEX trading in New York -- and it then wandered quietly higher until the market closed at 5:00 p.m. EDT.
The low and high ticks in gold were recorded by the CME Group as $4,257.70 and $4,399.50 in the October contract -- and $4,288.00 and $4,432.30 in December...an intraday move of $144.30 in the latter month. The August/ October price spread differential in gold at the close in New York yesterday was $26.40...October/December was $32.60...December/February27 was $35.60 -- and February/April27 was $33.80 an ounce.
Gold was closed in New York on Friday afternoon at $4,341.30 spot...up $101.40 on the day -- and $29.10 off its Kitco-recorded high tick. Net volume in October and December combined was around 197,500 contracts -- and there were around 16,800 contracts worth of roll-over/switch volume on top of that.
I saw that 422 gold, plus 461 silver contracts were traded in August yesterday and, as is always the case, it remains to be seen just how much of these amounts show up in tonight's Daily Delivery and Preliminary Reports further down in today's column. So far this month, as I pointed out in this spot yesterday, it's been a crushing disappointment...as no contracts are being added.
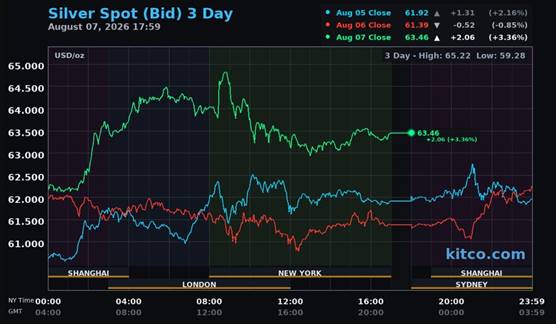
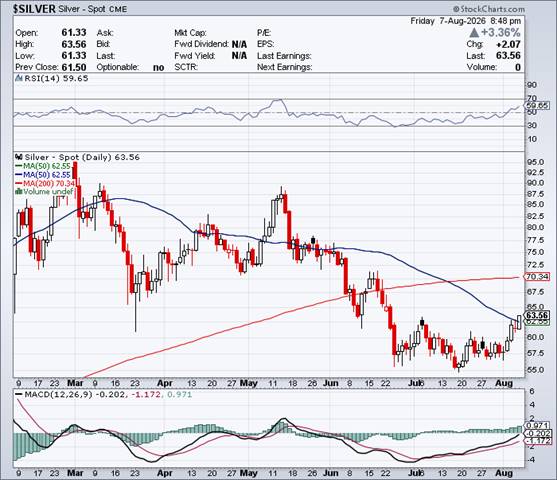
Silver's two step higher rally in the Far East and early Globex trading in London got stepped on at precisely 9:00 a.m. BST -- and it was then sold/ engineered lower until that non-farm payroll number hit the street -- and from that point onwards, the collusive commercial traders of whatever stripe, managed its price path in an identical fashion as gold's until the market closed at 5:00 p.m. EDT.
The low and high ticks in silver were reported as $61.42 and $65.48 in the September contract...an intraday move of $4.06 the ounce. The September/ December price spread differential in silver at the close in New York was 72.3 cents -- and December/March27 was also 72.3 cents an ounce. The price spread differentials in silver have certainly jumped higher in the last few days -- and are up a bit in gold as well.
Silver was closed on Friday afternoon in New York at $63.46 spot...up $2.06 on the day...but a hefty $1.52 off its Kitco-recorded high tick. Net volume was a bit on the lighter side at 44,000 contracts -- and there were around 22,500 contracts worth of roll-over/switch volume in this precious metal...almost all into December, with most of the rest into March27.

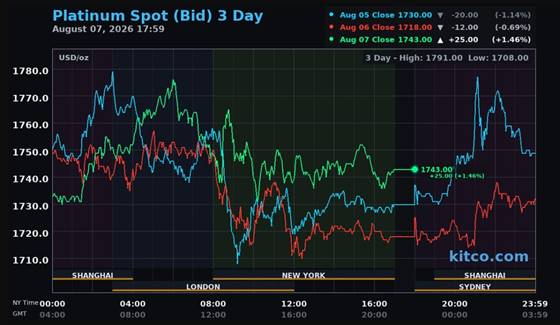
Platinum's big rally in Globex trading overseas was capped right at 12 o'clock noon in Zurich -- and it was then sold/engineered very unevenly lower until at or minutes after the 10 a.m. EDT afternoon gold fix in London. It then chopped a bit wildly, quietly and broadly higher until trading ended at 5:00 p.m. EDT. Platinum was only allowed to close up only 25 bucks from Thursday, at $1,743 spot -- and 35 dollars off its Kitco-recorded high tick.
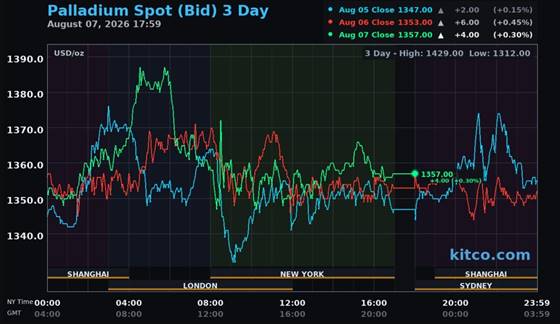
Palladium's rally had a double top set in it...the first time around 10:30 a.m. CEST -- and the second time around 11:40 a.m. CEST in Zurich. It was then engineered lower until the 8:20 a.m. COMEX open in New York -- and its price spike on the non-farm payroll number was summarily dealt with. It then also chopped lower until at or minutes after the 10 a.m. EDT afternoon gold fix in London. Its choppy rally from that juncture ran into 'something' about 3:15 p.m. in the very thinly-traded after-hours market -- and it was then sold sharply lower until shortly before the market closed at 5:00 p.m. EDT. Palladium was closed at $1,357 spot...up only 4 bucks on the day -- and 32 dollars off its Kitco-recorded high tick.
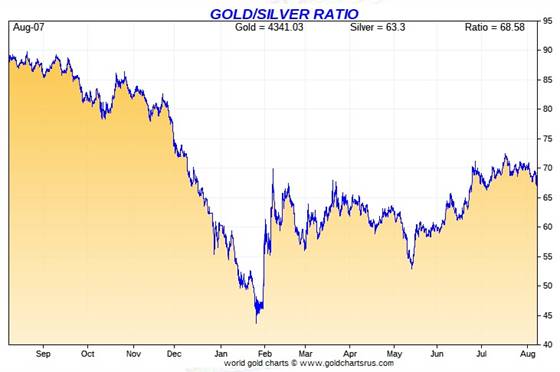
Based on the kitco.com spot closing prices in silver and gold posted above... the gold/silver ratio worked out to 68.4 to 1 on Friday...compared to 69.1 to 1 on Thursday.
Here's the 1-year Gold/Silver Ratio chart from Nick Laird -- and updated with this past week's data. Click to enlarge.
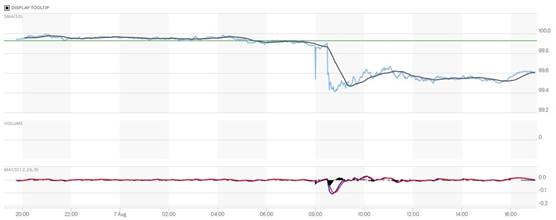
The dollar index closed very late on Thursday afternoon in New York at 99.93 -- and then opened higher by 1 basis point once trading commenced at 7:45 p.m. EDT on Thursday evening...which was 7:45 a.m. China Standard Time on their Friday morning. It then had a very broad and extremely quiet up/down move that lasted until the non-farm payroll number hit the tape in New York at 8:30 a.m. EDT. The PPT had its precipitous decline halted about twenty minutes later -- and its ensuing 'rally' topped out around 11:05 a.m. It then had a broad and very quiet down/up move until the market closed at 5:00 p.m. EDT.
The dollar index finished the Friday trading session in New York at 99.54...down 39 basis points from its close on Thursday.
Here's the DXY chart for Friday...thanks to marketwatch.com as usual. Click to enlarge.

Here's the 6-month U.S. dollar index chart...courtesy of stockcharts.com as usual. The delta between its close...99.60...and the close on DXY chart above, was 6 basis points above that. Click to enlarge.
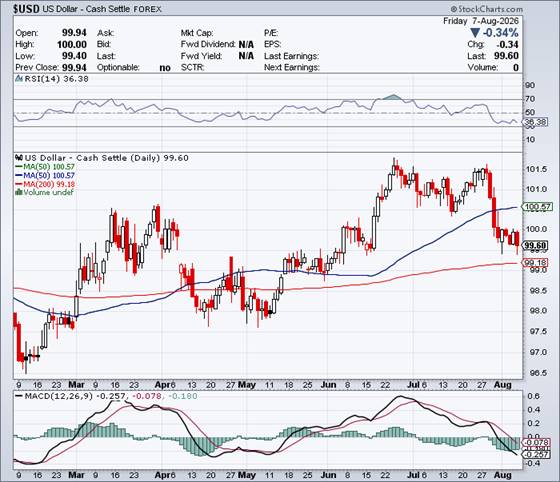
One can only dream at what the dollar index would have closed at if the PPT hadn't been there to rescue it. Of course they were also there to crush the rallies in all four precious metals that broke out simultaneously.
U.S. 10-year Treasury: 4.6600%...down 0.0100/(-0.21%)...as of the 1:59:53 p.m. CDT close
The yield on the ten-year cratered at 8:30 a.m. EDT...but the crawled quietly higher until around 11:12 a.m. EDT. It was then forced to trade very quietly sideways from that point until the market closed.
For the week, the yield on the ten-year declined by 8.50 basis points...but only came about because of the massive intervention by the Fed.
Here's the 5-year 10-year U.S. Treasury chart from the yahoo.com Internet site -- which puts the current yield into a somewhat longer-term perspective. Click to enlarge.
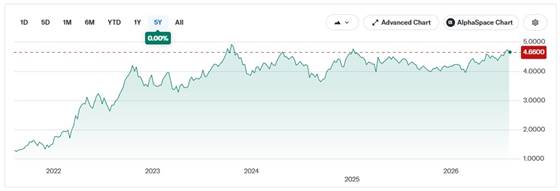
It still hasn't been allowed to take out its 4.92% high of October 15, 2023 -- and it's more than obvious that if the Fed wasn't all over it like white on rice, its yield would be comfortably above that mark by now.

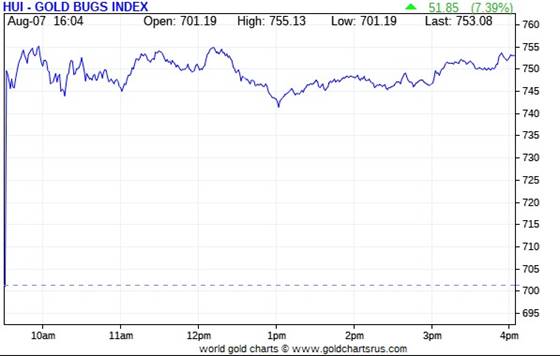
Not surprisingly, the gold shares gapped higher at the 9:30 opens of the equity markets in New York on Friday morning...hitting their respective highs at the 10 a.m. EDT afternoon gold fix in London. They they then wandered a bit lower until minutes after 1 p.m. -- and then crawled quietly higher until the markets closed at 4:00 p.m. The HUI closed up an impressive 7.39 percent.
The price path of the silver stocks was very similar. Their highs were in by 9:55 a.m. -- and after their down/up dip centered around exactly 1 p.m. EDT, they wandered quietly higher until around 3:20 p.m...then traded sideways until the markets closed. Despite the fact that silver outperformed gold by a wide margin once again, Nick Laird's Silver Sentiment Index closed higher by only 6.62 percent. Click to enlarge.
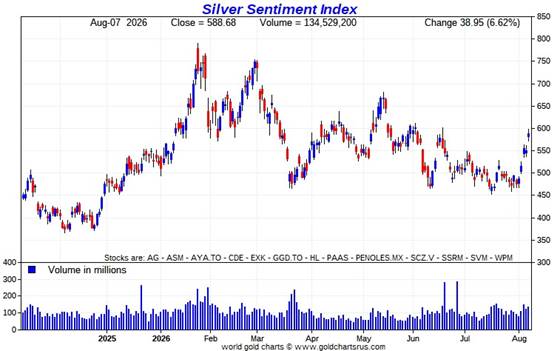
The two biggest stars were Coeur Mining...Thursday's dog...up 11.12 percent ...followed by SSR Mining, as it close higher by 10.46 percent. Peñoles was the biggest 'underperformer'...as it closed up only 3.85 percent.
There was this news from Wheaton Precious Metals on Thursday.
Silver finished higher by 3.35% on Friday -- Nick's Silver Sentiment Index finished the day up 6.62% -- and Sprott's PSLV finished the day higher by 3.22%
Gold closed higher by 2.39%...the HUI closed up 7.39% -- and Sprott's PHYS closed higher by 2.08%
Even though silver outperformed gold by a wide margin again on Friday...the HUI outperformed the Silver Sentiment Index on both a relative and absolute basis.
The Shanghai/U.S. price premium in silver was 12.30 percent on their Friday.
The reddit.com/Wallstreetsilver website, now under 'new' and somewhat improved management, is linked here. The link to two other silver forums are here -- and here.

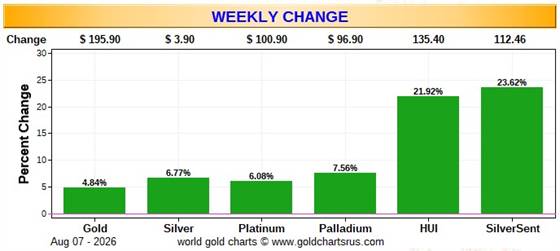
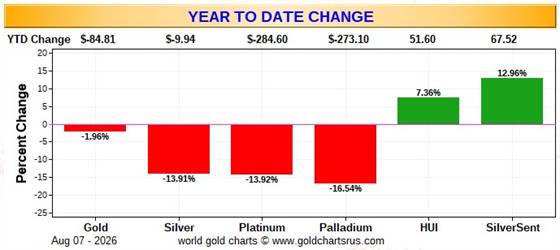
Here are two of the usual three charts that appear in this spot in every weekend missive. They show the changes in gold, silver, platinum and palladium in both percent and dollar and cents terms, as of their Friday closes in New York — along with the changes in the HUI and the Silver Sentiment Index.
Here's the weekly chart...which doubles as the month-to-date chart for this one week only. What a difference a week makes! -- and we can thank U.S. Treasury Secretary Scott Bessent for this...as it's wall-to-wall green...with the precious metal equities up big relative to their underlying metals. Click to enlarge.
The month-to-date chart will return to this spot in next week's column.
Here's the year-to-date chart -- and it's a great relief to see the precious metal equities up on the year, despite the fact that the metals themselves are still in the red. It's of great interest that the silver shares are 'outperforming' the metal itself by as much as they are over this time period. I'll be watching all three charts closely going forward to see what patterns emerge during the rest of 2026. Click to enlarge.
Despite the fact that silver has now broken the $120 barrier...albeit briefly -- and the silver well in London came close to running dry last October...the gold/silver ratio remains at a farcical 68.4 to 1 as of Friday's close. The 'normal' and historical ratio is around 15 to 1...which would put silver at $290 based on gold's closing price on Friday. And if priced at the ratio of 7:1 that it comes out of the ground at...compared to gold...that would put silver at around $620 an ounce. So a rather impressive triple-digit silver price is in our future...most likely somewhere between those two numbers.
As I say in this spot every Saturday...all that remains to be resolved is what that price will be -- and how soon 'da boyz' allow it to happen. Its first attempt to reach one of these values back at the end of January was obviously crushed ...as were all the rest since then. How its current rally ends, remains to be seen. But in the face of the continuing structural deficit in silver -- and all the other stuff going on in the world today, they can't keep it up forever.

The CME Daily Delivery Report for Day 7 of August deliveries showed that 116 gold -- and 450 silver contracts were posted for delivery within the COMEX-approved depositories on Tuesday.
In gold, the only short/issuer that mattered was French bank BNP Paribas, as it issued 115 contracts out of its client account. There were eight long/ stoppers in total -- and the three biggest were JPMorgan, Wells Fargo Securities -- and RBC [Royal Bank of Canada] Capital Markets...picking up 56, 25 and 13 contracts respectively...JPMorgan for their client account.
In silver, the sole short/issuer was French bank BNP Paribas out of its client account -- and by far the two largest long/stoppers of the five in total were Wells Fargo Securities and JPMorgan...picking up 274 and 145 contracts respectively...Wells Fargo for their house account, of course.
The link to yesterday's Issuers and Stoppers Report is here.
Month-to-date there have been 15,416 gold...plus 1,375 silver contracts issued/reissued and stopped so far in August.
On First Day Notice there were 15,653 gold contracts still open in August -- and that number in silver was 1,248 COMEX contracts. We're a third of the way through the August delivery month -- and deliveries have been underwhelming...as only a tiny handful of contracts have been added since then. This time last month, the contracts delivered in July had already vastly exceeded what was posted on First Notice Day for that month. But that's been far from the case in August -- and I'm rather taken aback by it...especially in gold.
The CME Preliminary Report for the Friday trading session, showed that gold open interest in August fell by 848 COMEX contracts, leaving 918 still around...minus the 116 contracts out for delivery on Tuesday as per the above Daily Delivery Report. Thursday's Daily Delivery Report showed that 1,000 gold contracts were actually posted for delivery on Monday...so that means that 1,000 -848=152 more gold contracts were added to the August delivery month.
Silver o.i. in August increased by 151 contracts, leaving 622 still open... minus the 450 contracts out for delivery on Tuesday as per the above Daily Delivery Report. Thursday's Daily Delivery Report showed that zero silver contracts were posted for delivery on Monday...so that obviously means that 151 more silver contracts were added to August deliveries.
Total gold open interest for the Friday trading session in last night's Preliminary Report rose by only a net 8,715 COMEX contracts...almost all in December...not a lot considering the price move. Total silver o.i. on Friday increased by only a net 1,699 COMEX contracts...not much, either.
[I checked the final change in total open interest for gold for Thursday in Friday's final report -- and it showed an inconsequential increase...from +19,545 COMEX contracts, up to +19,780 contracts. I was hoping/praying for a big decline...but, alas. However, that increase was all in December, with some in October...so someone went long big time in those months. The final change in total silver o.i. for Thursday showed almost no change...from +2,689 contracts, up to +2,695 COMEX contracts.]
Gold open interest in Septemberin Friday's Final Report for Thursday increased by 190 contract...leaving 5,267 COMEX contracts still open. Silver open interest in September in Friday's final report for the Thursday trading session rose by a hefty 1,792 contracts, leaving 81,996 contracts still open.
There were a further 90,598 troy ounces of gold added to GLD -- and there were another 17,262 troy ounces of gold added to GLDM. There was no reported change in SLV.
As I mentioned in this spot yesterday, I suspect that there's just no big silver available to be purchased at a price the authorized participants are prepared to pay -- so they are shorting SLV shares in lieu of depositing physical silver.
We get the next short report on Tuesday -- and I doubt it will show us much ...as the cut-off for the report was last Friday, July 31 -- and all the really big price action has happened since then.
The SLV borrow rate started the Friday session at 0.27 -- and ended it at 0.43%...with 10.0 million shares available to short. The GLD borrow rate started the day at 0.44% -- and also ended at 0.44%...with 6.6 million shares available.
In other gold and silver ETFs and mutual funds on Earth on Friday ...net of any changes in COMEX, GLD, GLDM and SLV activity, there were a net 154,158 troy ounces of gold added -- and 1,110,861 troy ounces of silver were added as well...almost all because of the 1,098,869 troy ounces added to iShares/SSLN.
U.S. Mint sales in July were pretty pathetic. They sold 7,000 troy ounces of gold eagles -- 8,000 one-ounce 24K gold buffaloes...but only 425,000 silver eagles.
There was very decent activity in gold over at the COMEX-approved depositories on the U.S. east coast on Thursday. There were 11,785 troy ounces received...all of which ended up at Loomis International -- and 158,041 troy ounces were shipped out.
The two 'out' amounts were the 114,148 troy ounces that left Manfra, Tordella & Brookes, Inc. -- and the 43,893 troy ounces that departed HSBC USA.
There was a bunch of paper activity. There were 80,882 troy ounces were adjusted out of existence in the Eligible category over at Asahi -- and 14,467.950 troy ounces/450 kilobars were transferred from the Registered category and back into Eligible over at JPMorgan.
The link to all of Thursday's COMEX gold action is here.
There wasn't much activity in silver. Nothing was reported received -- and only 304,166 troy ounces were shipped out. The two 'out' amounts were the 300,128 troy ounces that left Loomis International -- and the 4,038 troy ounces/four good delivery bars that departed Delaware. There was no paper activity, either -- and the link to this is here.
The Shanghai Futures Exchange updated their silver inventories as of the close of business on their Friday -- and it showed that a net 44,593 troy ounces/ 1.387 metric tonnes of silver were added... leaving their silver inventories at 40.550 million troy ounces/1,261.244 metric tonnes.
Although I don't have room for the charts in today's column, Nick Laird passed around the U.S. gold and silver import/export numbers for June -- and they are as follows:
They imported 13.225 tonnes/425,196 troy ounce of gold -- and exported 66.349 tonnes/2.133 million troy ounces. In silver, they imported 569.204 tonnes/ 18.300 million troy ounces -- and exported 201.33 tonnes/6.473 million troy ounces.
Nick also sent out the data showing that China added 19.9 tonnes/639,800 troy ounces of gold to their 'official' reserves in July...which now total 2,366 tonnes/76.07 million troy ounces. Most long-time market observers, including this writer, believe that their real reserves are 10x this amount.
I'll have the charts on all this starting on Tuesday of next week.

Here are the usual 20-year charts that show up in this space in every weekend column. They show the total amounts of physical gold and silver held in all known depositories, ETFs and mutual funds as of the close of business on Friday. Click to enlarge.
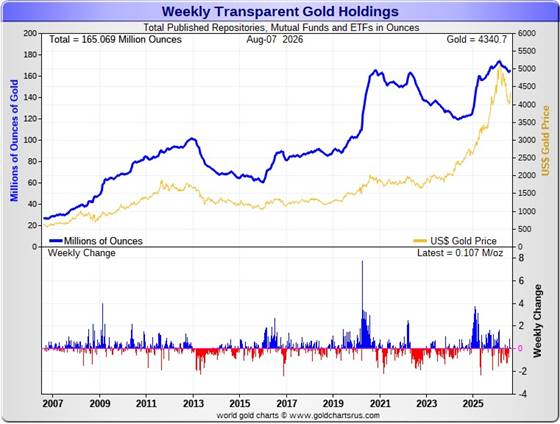
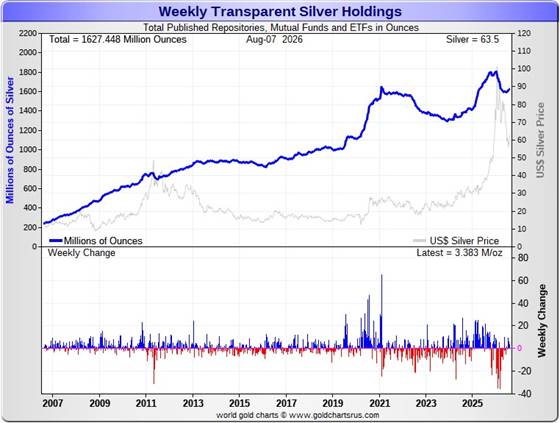
During the business week just past, there were a net 107,000 troy ounces of gold added -- and a net and further 3.383 million troy ounces of silver were added as well.
According to Nick Laird's data on his website, a net 1.027 million troy ounces of gold were added to all the world's known depositories, mutual funds and ETFs during the last four weeks. There have now been net gold deposits for the last three weeks in a row.
The largest 'in' amount were the 700,996 troy ounces added to Tether...along with the 583,457 troy ounces and 254,743 troy ounces added to SLV and five different iShares ETFs respectively.
The largest two 'out' amounts by far were the394,610 troy ounces withdrawn from the COMEX -- and the 130,115 troy ounces that left iShares/IAU.
The amount of gold in all the world's ETFs and mutual funds remains a bit below its old all-time high of late February of this year.
A surprising and net 20.195 million troy ounces of silver were added during that same 4-week time period.
The largest 'in' amounts were the 10.235 million troy ounces into SLV... followed by the 5.505 million troy ounces into the COMEX -- plus the net 1.750 million into WisdomTree.
The largest 'out' amount were the 967,000 troy ounces that left Sprott's Central Fund of Canada.
It should be noted that the amount of silver held in all these depositories, ETFs and mutual funds remains below its old all-time high inventory level of late January 2026...which is no surprise.
There have now been net additions to all these known silver ETFs and mutual funds for seven weeks out of the last eight which, considering the price action, is more than noteworthy.
Retail demand remains mostly comatose, but has picked up from what it's been for last few months. There are no 'out of stock' signs over at all the retail bullion stores that I follow. They have decent stocks in just about everything they normally carry. The buy/sell spreads at most bullion stores remain a bit north of 10 percent -- and in the case of anything less than 0.999+ pure, it's far more than that. This obviously means that they have lots of stock -- and are not at all enthusiastic about buying anything.
COMEX silver withdrawals were monstrous earlier in the year...135 million in Q1/2026...23 million oz. in April -- but only 12.6 million oz. in May -- and only 5.3 million oz. in June. In July, COMEX warehouse stocks actually rose by a net 9.5 million oz.
These amount don't include the 6.875 million oz. issued and stopped on the COMEX in the August delivery month. But this is not really physical silver demand per se...as all that's happening is that silver already sitting on the COMEX just changes ownership.
However, silver demand from the COMEX can only go on for so long, as a huge chunk of it is owned privately in the Eligible category -- and not for sale or delivery. Just how much silver is actually available for shipment on demand to the LBMA of elsewhere, is unknown...but it's most certainly finite.
We're deep into the sixth year of a structural deficit in silver according to the ongoing reports from The Silver Institute. However, subscriber John Macintosh thinks it's far more than they're reporting -- and threw another b.s. flag on their latest report in his newest essay headlined "The Silver Institute: A Wonderland of Compounded Errors" -- and linked here.
The vast majority of precious metals being held in these depositories are by those who won't be selling until the silver price is many multiples of what it is today...if ever.
Sprott's PSLV is the third largest depository of silver on Planet Earth with 215.4 million troy ounces...unchanged for the second week in a row -- and a great distance behind the COMEX, which has now been demoted to the second largest silver depository, where there are 334.3 million troy ounces being held...up a net and further 1.5 million troy ounces this past week...but minus the 103 million troy ounces being held in trust for SLV by JPMorgan that Ted Butler found out about many years ago.
That 103 million ounce amount brings JPMorgan's actual silver warehouse stocks down to around the 35 million troy ounce mark...quite a bit different than the 137.9 million they indicate they have -- unchanged for the last four weeks. They've parted with a lot of silver in the last nine or so months... around 76 million oz.
But that number doesn't include the silver that JPMorgan owns and has stored at the other COMEX-approved depositories. They've shipped out lots of that over the months and years...especially this year so far -- and a lot of it out of CNT.
PSLV remains a very long way behind SLV as well -- still the largest silver depository...with 487.8 million troy ounces as of Friday's close...up a net 1.1 million troy ounces this past week.
On a net basis since the latter part of December -- and despite the big spike in the silver price at the end of January, just about every depository or ETF had been hemorrhaging silver. However, that outflow declined precipitously during the first four months of the year -- and has now gone net positive in the last eight weeks.
The latest short report [for positions held at the close of business on Wednesday, July 15] showed that the short position in SLV rose by a tiny 1.17%...from the 30.77 million shares sold short in the prior report...up to 31.13 million shares in the latest short report that came out yesterday. This amount represents 5.81 percent of total SLV shares outstanding...still a bit obscene, but not nearly as bad as it was earlier in the year. Don't forget that there's no physical silver backing any of these shorted shares as the SLV prospectus requires.
BlackRock issued a warning more than ten years ago now to all those short SLV, that there might come a time when there wouldn't be enough metal for them to cover. That would only be true if JPMorgan decided not to supply it to whatever entity requires it. Those that remain short SLV shares are in equally dire straits as the Big 8 shorts in silver in the COMEX futures market -- and I suspect that they're the same entities.
The next short report...for positions held at the close of trading on Friday, July 31...will be posted on The Wall Street Journal's website on Tuesday, August 11.
Then there's that other little matter of the monster short position in silver held by Bank of America in the OTC market...with JPMorgan & Friends on the long side. Ted said it hadn't gone away. He wrote an article about this back in April 2021 headlined "A New Piece of the Puzzle" -- and linked here.
A while after that article came out, he also come to the conclusion that they're short around 25 million ounces of gold with these same parties as well. Once these short covering rallies in both silver and gold begin anew...we'll see if they need to get taken over, like Bear Stearns did back in 2008 -- and for the same reason. If that's the case, JPMorgan...their counterparty to these trades ...will pick them up for next to nothing as well.
However, the latest report from the OCC that came out at the end of June does cast some doubt on Ted's thesis -- although I'm not at all qualified to say that it's no longer valid. Maybe the next report at the end of September will shed more light on this.

The Commitment of Traders Report, for position held at the close of COMEX trading on Tuesday, showed a slight increase in the Commercial net short position in silver...but a much larger increase in gold.
In silver, the Commercial net short position rose by 1,613 COMEX contracts... 8.065 million troy ounces of paper silver.
They arrived at that number through the purchase of 611 long contracts...but also sold/added 2,224 short contracts -- and it's the difference between those two numbers that represents their change for the reporting week.
Under the hood in the Disaggregated COT Report, both the Managed Money and Nonreportable/small traders added to their net long positions...the former by 2,792 COMEX contracts -- and the latter by 1,550 contracts. This meant that the traders in the Other Reportables category had to have reduced their net long position, which they did to the tune of 2,729 COMEX contracts.
Doing the math: 2,792 plus 1,550 minus 2,729 equals 1,613 COMEX contracts...the change in the Commercial net short position.
The Commercial net short position in silver now stands at 40,422 COMEX contracts/202.110 million troy ounces...up those 1,613 contracts from last Friday's COT report.
The Big 4 collusive commercial traders increased their net short position by a tiny amount...them by 437 COMEX contracts, up to 31,919 COMEX contracts ...only about 2,100 contracts off their lowest short position ever.
The Big '5 through 8' increased their net short position for the sixth week in a row...them by 852 COMEX contracts...up to 15,792 contracts...and now about 3,100 contracts above their lowest short position I have records for.
The Big 8 commercial traders in total are net short 47,711 COMEX silver contracts...up 437+852=1,289 contracts on the week.
But since the Big 8 shorts accounted for only 1,289 contracts of the increase in the Commercial net short position -- and the Commercial short position rose by 1,613 COMEX contracts, that meant that Ted Butler's raptors, the 25 small commercial traders other than the Big 8, had to have been sellers as well during the reporting week -- and they were...decreasing their net long position by 1,613-1,289=324 COMEX contracts. They remain net long silver by 7,289 COMEX contracts.
The sale of these long contracts by Ted's raptors had the mathematical effect of increasing the Commercial net short position by those 324 contracts...which isn't an increase at all. When these small commercial traders are net long like they are now in silver, it's only what the Big 8 commercial shorts do that matters. It's been like that forever.
Here's the 3-year COT chart for silver thanks to Nick Laird -- and updated with the above data. Click to enlarge.
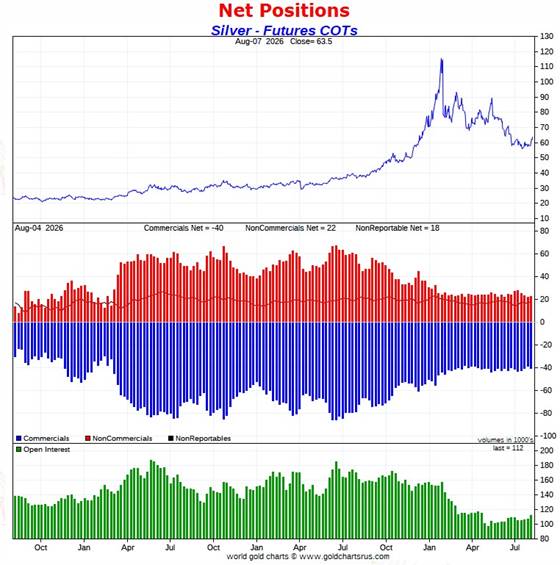
The small increase in the Commercial net short position in this reporting week.... 1,613 COMEX contracts...just reversed the 1,644 contracts that the Commercial net short position declined by during the prior week.
All in all this was another in a long series of 'nothingburger' COT Reports in silver...which is more or less what I was expecting to see, considering the price action during this past reporting week.
The Big 8 commercial traders are net short 42.6 percent of total open interest in silver in the COMEX futures market...down a bit from the 43.5 percent they were net short in last Friday's COT Report. Most of this decrease was the result of a five percent increase in total silver open interest during the week...which obviously affects the percentage calculation.
I have no idea how things will unfold from here...but it's obvious that the Managed Money traders, et al. have dug in their heels and are refusing to bow down to the wishes of the Big 8 shorts by selling longs, or going short by much more than the already have.
In the past, ten or so years ago, the Managed Money traders would be net short silver by a bit this far below its 200-day moving average...or no worse than market neutral. Not this time, as they are currently net long and strong 11,974 COMEX contracts. The other two categories remain mega net long as well -- and the Nonreportable/small traders are even more net long silver than the Managed Money traders.
Despite the fact that the Big 8 collusive commercial traders are not holding a record short position, the set-up from a COMEX futures market perspective remains wildly off-the-charts bullish nonetheless.
All that stands in the way of a rather spectacular 3-digit silver price...as it's always been...are the Big 8 collusive shorts -- and they were obviously out and about in force this week as well.
In gold, the commercial net short position increased by 14,182 COMEX contracts ...1.418 million troy ounces of paper gold.
They arrived at that number through the sale of 3,628 long contracts -- and also sold/added 10,554 short contracts. It's the sum of those two numbers that represents their change for the reporting week.
Under the hood in the Disaggregated COT Report, the Managed Money and the traders in the Other Reportables category added to their net long positions... the former by 10,971 COMEX contracts -- and the latter by 4,593 contracts. This meant that the Nonreportable/small traders had have been net sellers during the reporting week -- and they were...reducing their net long position by 1,382 contracts.
Doing the math: 10,971 plus 4,593 minus 1,382 equals 14,182 COMEX contracts...the change in the commercial net short position...which it must do.
The commercial net short position in gold now sits at 226,491 COMEX contracts...22.649 million troy ounces of paper gold...up those 14,182 contracts just mentioned in the previous paragraph.
The Big 4 commercial traders increased their net short position by 7,386 COMEX contracts, up to 140,074 contracts.
The Big '5 through 8' commercial traders increased their net short position, them by 4,679 contracts, up to 63,907 COMEX contracts.
The Big 8 commercial traders in total are net short 203,981 COMEX gold contracts...up 7,386+4,679=12,065 contracts from last Friday's COT Report -- and now a hefty 42,083 contracts above their record low of 161,898 contracts that they were short back on May 26.
That's despite the fact that the collusive commercial traders of whatever stripe have engineered gold lower by several hundred dollars since then...so, like in silver, they have less than nothing to show for their efforts.
But since the commercial net short position fell by 14,182 COMEX contracts -- and the Big 8 decreased their net short position by only 12,065 contracts... that meant that Ted's raptors, the 38 small commercial traders other than the Big 8, had to have been net sellers as well during the reporting week as well -- and they were. They increased their net short position by 14,182-12,065=2,117 COMEX contracts -- and are now net short gold by 22,510 COMEX contracts.
And like they currently are in silver, they would normally be net long gold by many thousands of contracts [if not tens of thousands of contracts] at this point in the price cycle -- and why they're not this time around, I have no idea...but suspect that they have been recruited into the trenches in the fight to prevent a massive rise in the gold price.
But if they weren't short this amount -- and net long those thousands [to tens of thousands] of contracts that they normally would be, it's a guarantee that gold would be many, many thousands of dollars higher in price than it is now.
I suspect that no more than two or three of these small commercial traders hold the vast majority of this short position...so it's the 'Big 10 or 11' -- and not just the 'Big 8' traders that are running the gold price management show.
Here's Nick's 3-year COT chart for gold -- and updated with the above data. Click to enlarge.
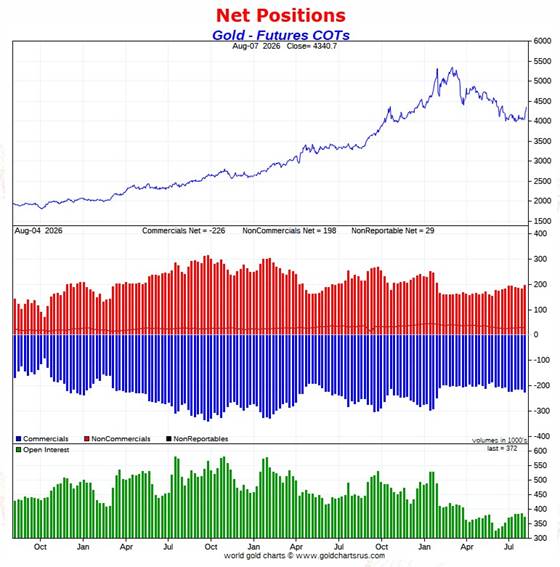
This week's increase in the Big 8 short position broke them above a trading range they've been in since late February. The Big 4 and Big 8 shorts haven't held this large of a short position since back on January 27...the day before the big engineered price decline in it and silver.
And this is despite the fact that gold is down about about $1,500 bucks from its high at the end of January. So, like they are in silver, the Big 8 shorts are worse off now, than they were back then.
The Big 8 are short 54.9 percent of total open interest in gold in the COMEX futures market...up big from the 49.9% they were short in last week's report. The weekly change in open interest in gold was also a factor in the above percentage calculation...as it decreased by 13,052 contracts during the reporting week...which obviously affects the percentage calculation to the upside.
However, unlike silver, the commercial net short position in gold is much larger than the Big 8 short position...because the rest of the collusive commercial traders, Ted Butler's raptors, are also net short gold. Adding them [38 traders] into the mix, which you have to do, puts the commercial net short position in gold at 61.0 percent of total open interest in the COMEX futures market...also up big from the 55.2% that they were short in last Friday's report.
Then, if you subtract out the uneconomic and market-neutral spread trades from total open interest, the commercial net short position in gold jumps up to around 65% of total open interest...which remains grotesque beyond belief.
But despite the fact that the collusive commercial traders are some distance off their all-time record low short position, it remain on the launchpad for a major rally as well...which, like it is in silver, is obviously underway.
Now that they're rallies have begun, we'll find out in short order if the collusive commercial traders put their collective heads back in the lion's mouth and go short in a major way once again. Based on what we've been witness to over the last few months -- and in yesterday's COT Report... it seems likely that they are...but more so in gold than in silver, at least for the moment.
In the other metals, the Managed Money traders in palladium decreased their net short position by a further 715 COMEX contracts. They remain net short palladium by 5,458 COMEX contracts...the only category, commercial or otherwise, that's net short palladium -- and for reasons that escape me.
The commercial traders in the Swap Dealers category are net long palladium by 3,716 contracts -- and the commercial traders in the Producer/Merchant category are now net long only 102 COMEX contracts. The traders in the Other Reportables are net long 1,123 contracts in this metal -- and the Nonreportable/small trader categories are net long 517 COMEX contracts.
As I keep mentioning about these numbers, palladium is a very dinky market. Total open interest is only 18,574 COMEX contracts...down 125 contracts this past reporting week...still about the lowest it's been since sometime in 2022. Open interest in platinum is also about the lowest since that time as well.
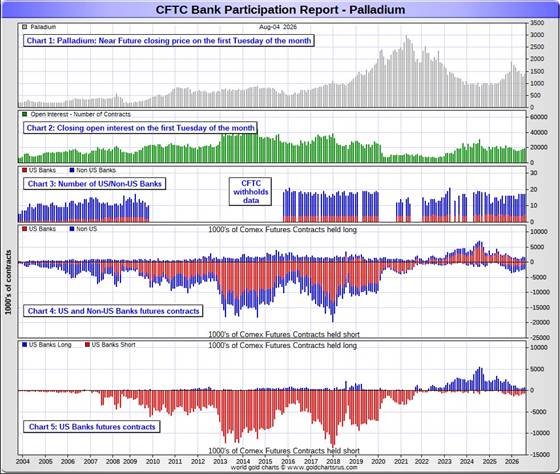
The world's banks are net short an inconsequential 4.0 percent of total open interest in palladium in the COMEX futures market as of yesterday's Bank Participation Report...which is an inconsequential increase from the 3.6 percent that they were net short in July's Bank Participation Report.
This is a very strange and twisted market once you get a look into its internal structure -- and as I point out in every monthly Bank Participation Report, the only reason that there's a COMEX futures market in palladium is so the collusive commercial traders of whatever stripe can manage its price.
In platinum the Managed Money traders increased their net long position by a further 4,434 COMEX contracts during the reporting week -- and are net long platinum by 10,960 contracts. It was their purchase of long contracts during the reporting week that caused its price to rise. The traders in the Other Reportables and Nonreportable/small trader category remain net long platinum by very respectable amounts as well. All of this, like it is in gold and silver, is a big "up yours" to the collusive commercial traders.
The commercial traders in the Producer/Merchant category in platinum are net short 11,155 COMEX contracts. The Swap Dealers are net short platinum by 7,287 COMEX contracts.
In August's Bank Participation Report that came out yesterday, the world's banks...19 of them in total...were net short 44.0 percent of total open interest in platinum in the COMEX futures market...up from the 38.2 percent they were short in July's.
In copper, the Managed Money traders increased their net long position by 10,750 COMEX contracts during the past reporting week -- and are now net long copper by 75,758 contracts...1.894 billion pounds of the stuff. The traders in the Other Reportables and Nonreportable categories are net long copper as well...although the Other Reportables not by much.
Copper, like palladium, continues to be a wildly bifurcated market. The Producer/ Merchant category is net short 92,844 copper contracts/ 2.321 billion pounds -- while the Swap Dealers are net long 6,675 COMEX contracts/ 167 million pounds of the stuff. So it's the commercial traders in the Producer/ Merchant category that are short against every other group of traders... including the commercials in the Swap Dealer category.
Whether this dichotomy in copper means anything or not, will only be known in the fullness of time. Ted Butler said it didn't mean anything as far as he was concerned, as they're all commercial traders in the commercial category. But this bifurcation has been in place for as many years as I've been keeping records -- and that's a very long time....10+ years.
In this vital industrial commodity, the world's banks...both U.S. and foreign... were net short copper by 7.6% of total open interest in the August Bank Participation Report...up from the 4.8% they were short in the July BPR. Back in the October 2025 BPR, these same banks were net long 0.90% of the total open interest in copper in the COMEX futures market. So they're close to market neutral...but only numerically, as that dichotomy between the two groups of commercial traders is still there.
It's also worth noting that 5 U.S. banks are net long copper by 5,140 COMEX contracts...while 17 non-U.S. banks are net short copper by 22,065 contracts.
At the moment it's all the commodity trading houses such as Glencore and Trafigura et al., along with some hedge funds, that are mega net short copper in the Producer/Merchant category, as the Swap Dealers are net long, as pointed out above.
The next Bank Participation Report for the August trading period is due out on Friday, September 4.

Here’s Nick Laird’s “Days to Cover” chart, updated with the COT data for positions held at the close of COMEX trading on Tuesday, August 4. It shows the days of world production that it would take to cover the short positions of the Big 4 — and Big '5 through 8' traders in every physically traded commodity on the COMEX. This chart is a graphical representation of what's shown in the COT Report above. Click to enlarge.
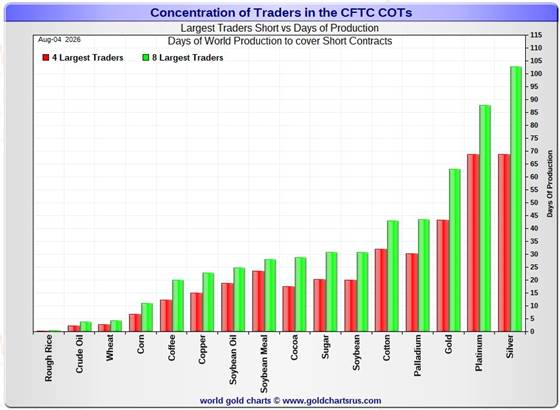
In this week's data, the Big 4 traders are short about 69 days of world silver production...up about 1 day from last Friday's COT report. The ‘5 through 8’ large traders are short an additional 34 days of world silver production...up 2 days from the last report...for a total of 103 days that the Big 8 are short -- and obviously up 3 days from last Friday's report.
Those 103 days that the Big 8 traders are currently short, represents about 3.4 months of world silver production, or 238.555 million troy ounces/47,711 COMEX contracts. That's up a bit from the 232.110 million troy ounces/46,422 contracts from last Friday's COT Report.
In gold, the Big 4 are short about 43 days of world gold production...up 2 days from last Friday -- and the Big '5 through 8' are short an additional 20 days of world production...also up 2 days from last Friday's COT Report...for a total of 63 days of world gold production held short by the Big 8 commercial traders -- and obviously up 4 days from last Friday's report.
In silver, I believe that a goodly chunk of the gross short position in the Big 4 commercial category is mostly held by only two traders...both of them U.S. banks... Wells Fargo and BofA I suspect. In June's Bank Participation Report, 5 U.S. bullion banks held a gross short position of 12,884 COMEX contracts... down a whole bunch from May. But July's BPR showed that these same five U.S. banks increased their gross short position back up to 16,128 contracts... an increase of 3,244 COMEX contracts. In the August Bank Participation Report that came out yesterday, the gross short position of the five U.S. banks was back down to 13,511 COMEX contracts.
This chart is also a graphical representation of why I consider platinum to be 'da boyz' No. 2 problem child after silver -- and it continues to be a big problem child.
The short position in SLV now sits at 31.13 million shares/troy ounces as of the latest short report that came out a week two weeks ago...for positions held at the close of trading on Wednesday, July 15. This represents an increase of 1.17% from the prior report -- and 5.81% of total SLV shares outstanding. This is not as off-the-charts grotesque and obscene as it once used to be -- but realistically should be something less than a third of that amount.
Don't forget that there's not a single solitary troy ounce of silver backing any of these shorted shares as the SLV prospectus requires.
The next short report...for positions held at the close of business on Friday, July 31 is due out next Tuesday, August 11.
In the overall in yesterday's COT Report, the short positions of the Big 8 commercial traders in silver was higher by a mostly inconsequential amount...for the ninth week in a row. But in gold it increased by quite a bit -- and is undoubtedly far higher now since the Tuesday cut-off. The same can be said of silver.
As Ted Butler pointed out quite often over the years, the resolution of the Big 4/8 short positions will be the sole determinant of precious metal prices going forward...although that short position in gold held by his raptors continues to be another negative factor -- and increased by a bit during this past reporting week. However, under normal circumstances, it wouldn't be there at all...it would be a huge long position.
And as he also pointed out over the years, there would come a time when what the numbers show in the COT Report won't matter, as events in the real world...whatever they may be...will overtake them. That hasn't happened yet...but that day is most certainly coming at some point.
All that we await, is the denouement that follows. The big bear raids we've endured over the last many months and weeks...are all part and parcel of the process to keep their respective prices in line until that moment arrives. And whether these budding rallies that began this week is the start of it or not, remains to be seen.

The July Bank Participation Report [BPR] data is extracted directly from yesterday's Commitment of Traders Report. It shows the number of futures contracts, both long and short, that are held by all the U.S. and non-U.S. banks as of Tuesday’s cut-off in all COMEX-traded products.
For this one day a month we get to see what the world’s banks have been up to in the precious metals. They’re usually up to quite a bit...but not in July...as I predicted in yesterday's column.
[The August Bank Participation Report covers the four-week time period from July 7 to August 4 inclusive]
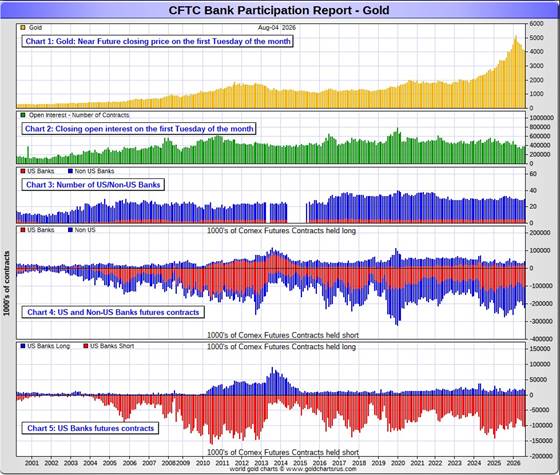
In gold, 5 U.S. banks are net short 86,236 COMEX contracts, up a further 3,838 contracts from the 82,398 contracts that these same 5 U.S. banks were net short in the July BPR. This is their largest short position since February's BPR for January.
Also in gold, 24 non-U.S. banks are net short 97,331 COMEX contracts, up a further 1,691 contracts from the 95,640 contracts that 23 non-U.S. banks were net short in July's BPR -- and also their largest net short position since January.
At the low back in the August 2018 BPR...these non-U.S. banks held a net short position in gold of only 1,960 contacts -- so they've been back on the short side in a gargantuan way ever since. Only a handful of these banks hold meaningful short positions in gold. The short positions of the rest are of no consequence -- and never have been.
Although almost all of the largest U.S. and foreign bullion banks are in the Big 10-11 short category in gold, some of the hedge fund/commodity trading houses are short large amounts of gold in that category as well. There's also the possibility that the BIS could be short gold in the COMEX futures market.
As of August's Bank Participation Report, 29 banks [both U.S. and foreign] were net short 49.4 percent of the entire open interest in gold in the COMEX futures market...up a bit from the 47.9 percent that 28 banks were net short in the July BPR.
And if you remember from the above COT Report, the commercial net short position in gold was 61.0 percent of total open interest -- and if you subtract out the 49.4 percent held short by the banks...only 61.0-49.4=11.6 percentage points of the commercial net short position in gold is not held by the banks. How's that for a concentrated and manipulative short position?
Here’s Nick’s BPR chart for gold going back to 2000. Charts #4 and #5 are the key ones here. Note the blow-out in the short positions of the non-U.S. banks [the blue bars in chart #4] when Scotiabank’s COMEX short position was outed by the CFTC in October of 2012. Click to enlarge.
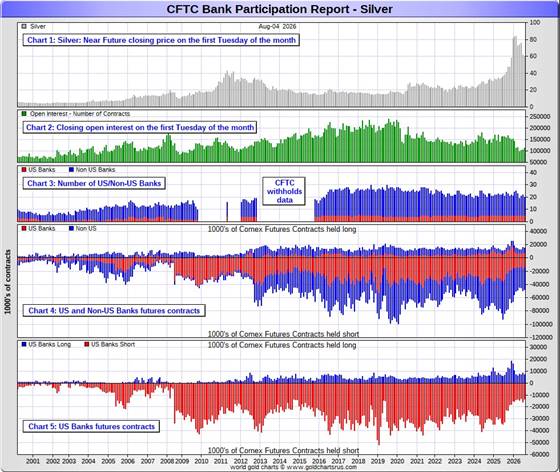
In silver, 5 U.S. banks are net short 6,357 COMEX contracts...down 1,244 contracts from the 7,601 contracts they were net short in the July BPR...still ultra low, but not a record low.
But the number I really wanted to see was the change in their gross short position. In the December BPR it was 17,838 contracts, but in the June BPR, that number was down to 12,884 contracts which was, without doubt, their lowest gross short position in silver, ever. But July's BPR showed that it had jumped back up to 16,128 COMEX contracts...which I wasn't happy to see. In yesterday's BPR, the gross short position held by these five banks was back down to 13,511 COMEX contracts.
These same five U.S. banks hold a gross long position of 7,154 COMEX contracts -- and it's a given that they're not divided up equally between them. I figure that the two U.S. banks that hold the biggest short position in silver, don't hold much of a long position in it.
The five U.S. banks that are net short silver would be Citigroup, Wells Fargo, Bank of America, Goldman Sachs -- and Morgan Stanley...with by far the lion's share held by no more than two of these banks...most likely BofA and Wells Fargo...although I have my suspicions about JPMorgan from time to time.
Also in silver, 15 non-U.S. banks are net short 26,473 COMEX contracts, up a net 452 contracts from the 26,021 contracts that 17 non-U.S. banks were net short in the July BPR.
It's a given, based on silver deliveries in 2025 -- and so far in 2026...that HSBC, Barclays, Standard Chartered, BNP Paribas, Deutsche Bank and Macquarie Futures hold by far the lion's share of the short positions of these non-U.S. banks. Canada's Bank of Montreal is a card-carrying member of this group as well...but they may have covered by now, as they haven't been an issuer or stopper for more than a month.
And, like in gold, the BIS could also be actively shorting silver. However, the remaining short positions in silver, divided up between the remaining 10 or so non-U.S. banks, are immaterial — and have always been so....the same as most of the 24 non-U.S. banks in gold as well.
As of August's Bank Participation Report, 20 banks [both U.S. and foreign] were net short 29.3 percent of the entire open interest in silver in the COMEX futures market — down from the 32.1 percent that 22 banks were net short in the July BPR -- and only down because of the increase in silver open interest during that month, which affects the percentage calculation.
Here’s the BPR chart for silver. Note in Chart #4 the blow-out in the non-U.S. bank short position [blue bars] in October of 2012 when Scotiabank was brought in from the cold. Also note August 2008 when JPMorgan took over the silver short position of Bear Stearns—the red bars. It’s very noticeable in Chart #4—and really stands out like the proverbial sore thumb it is in chart #5. Click to enlarge.
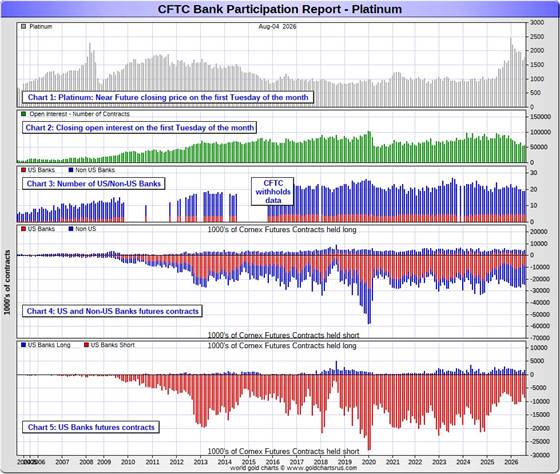
In platinum, 5 U.S. banks are net short 6,794 COMEX contracts in the August BPR, up a tiny 340 contracts from the 6,454 contracts that these same 5 U.S. banks were short in the July BPR.
At the 'low' back in September of 2018, these U.S. banks were actually net long the platinum market by 2,573 contracts...so they still have more work to do to get back to market neutral...if they ever intend to.
Also in platinum, 14 non-U.S. banks decreased their net short position by 577 contracts... from 14,067 contracts held by these same 14 banks in July's BPR...down to 13,490 contracts in yesterday's BPR. This is 5.52x the amount they held short in the May/25 BPR, so they've been gone back on the short side in platinum by a huge amount since then.
Back in the December 2023 BPR, these non-U.S. banks were net short a microscopic 35 platinum contracts...so they have yeoman work to do if they ever want to get back to even close to that number. I doubt that they'll ever accomplish that -- and are permanently stuck with this short position.
As you know, platinum remains the big commercial shorts No. 2 problem child after silver -- and there's now a long-term structural deficit in it [and palladium] as well.
As of August's Bank Participation Report, 19 banks [both U.S. and foreign] were net short 36.3 percent of platinum's total open interest in the COMEX futures market, down a bit from the 38.2 percent that 20 banks were net short in July's BPR -- and mostly down because of an increase in total open interest during the reporting month.
Here's the Bank Participation Report chart for platinum. Click to enlarge.
In palladium, 5 U.S. banks are now net long 71 COMEX contracts in the August BPR, a decrease of a further 138 contracts from July...when they were net short 67 contracts.
Also in palladium, 12 non-U.S. banks are net short by 817 COMEX contracts... an increase of 250 contracts from the 567 contracts that 13 non-U.S. banks were net short in the July BPR.
None of this mean anything considering how tiny these amounts are... especially when divided up between 17 banks.
And as I've been commenting on for almost forever, the COMEX futures market in palladium is a market in name only, because it's so illiquid and thinly-traded. Its total open interest in yesterday's COT Report was only 18,574 contracts...compared to 55,848 contracts of total open interest in platinum...111,999 contracts in silver -- and 371,551 COMEX contracts in gold.
Total open interest in palladium has increased quite a bit over the last ten or so years, because I remember when it was less than 9,000 contracts on average. So it's nowhere near as illiquid as it used to be -- and it's also been helped along by the fact that the bid/ask is now down to only 40 bucks. It used to be $150 at one point way back when.
As I say in this spot every month, the only reason that there's a futures market at all in palladium, is so that the Big 8 commercial traders can control its price. That's all there is, there ain't no more.
As of this Bank Participation Report, 17 banks [both U.S. and foreign] are net short 4.0 percent of total open interest in palladium in the COMEX futures market...up a meaningless amount from the 3.6 percent of total open interest that these same 17 banks were net short in the July BPR.
For the last 5 years or so, the world's banks have not been involved in the palladium market in a material way...see its chart below. With all the world's banks basically market neutral from a COMEX futures market perspective...it's only the Managed Money traders that are net short now.
The Big 8 shorts in palladium, none of which are banks, are net short 41.1 percent of total open interest in palladium as of yesterday's COT Report ...down a bit from the 40.0 percent of total open interest they were short a month ago.
Here’s the palladium BPR chart -- and it remains to be seen if 'da boyz' return as big short sellers again at some point like they've done in the past. Click to enlarge.
Excluding palladium, most likely no more than a dozen or so banks in total -- and mostly U.S. and U.K.-based...along with French bank BNP Paribas and Deutsche Bank...continue to hold meaningful short positions in the other three precious metals...although I won't let Canada's Bank of Montreal or Australia's Macquarie Futures off the hook just yet.
As I pointed out above, some of the world's commodity trading houses and hedge funds are also net short the four precious metals. They have the ability to affect prices if they choose to exercise it. But it's still the collusive Anglo/ American/Western bullion bank cartel in the commercial category that are at Ground Zero of the price management scheme in the COMEX futures market. They are -- and remain, the not-for-profit/short sellers of last resort...until further notice.
And as has been the case for several decades now, the short positions held by the Big 4/8 traders is the only thing that matters...especially the short positions of the Big 4...or maybe only the Big 1 or 2 in silver. How this is ultimately resolved [as Ted kept pointing out] will be the sole determinant of precious metal prices going forward.
Considering the current state of affairs of the world as they stand today -- and the structural deficit in silver -- and now in platinum and palladium as well, the chance that these big bullion banks and commodity trading houses could get overrun at some point, is no longer zero -- and certainly within the realm of possibility if things go totally non-linear somewhere.
But...as Ted kept reminding us...if they do finally get overrun, it will be for the very first time. And it was patently obvious that the collusive commercial traders of whatever stripe had to step in multiple times over the last six months...including multiple times this past week...in order to prevent exactly that from happening. If they hadn't, Ted Butler's "Bonfire of the Silver Shorts" would have become a reality within days...if not hours.
The next Bank Participation Report for trading in August is due out on Friday, September 4.

CRITICAL READS & VIDEOS
U.S. economy unexpectedly lost 23,000 jobs in July
The U.S. economy saw an unexpected declined in jobs during July while the unemployment rate edged lower, the Bureau of Labor Statistics reported Friday in a snapshot that showed a slowing employment picture.
Non-farm payrolls fell by a seasonally adjusted 23,000 for the month, compared with a downwardly revised 20,000 for June. The Dow Jones consensus forecast had been looking for a gain of 83,000.
At the same time, the unemployment rate slipped to 4.1% as the labor force participation rate fell further to 61.4%, its lowest in more than five years, another indication that fewer Americans were working or looking for jobs.
In addition to the weak numbers for June and July, the final count for May was revised down to 63,000, or 66,000 lower than the prior estimate. The revised numbers brought the 12-month average down to just 34,000.
“The July employment report solidified that the labor market is not out of the woods quite yet,” said Nicole Bachaud, a labor economist at ZipRecruiter.
This CNBC story was posted on their website at 8:31 a.m. on Friday morning EDT -- and was updated about seven hours later. It's the first of several that I received from Swedish reader Patrik Ekdahl. The link to this one is here. The Zero Hedge spin on this his headlined "July Jobs Shock: U.S. Lost 23K Workers, Below Lowest Estimate, As Unemployment Rate Drops to 4.1%" -- and linked here.
Consumer Credit Jumps More Than Expected In June As Credit Card Debt Spikes
One month after the May consumer credit posting a shocking decline - the first since late 2024 - driven by a plunge in revolving credit, things are mostly back to normal, with the Fed reporting in its latest G.19 report that in June, U.S. consumer credit posted a healthy $14.17BN bounce - a full reversal of the May drop of $1.1 billion - and above the $11.9 billion median estimate.
The rebound was driven by a sizable reversal in last month's drop in revolving credit (i.e., credit card debt), as consumer resumed buying on credit to the tune of $6.7BN...
... bringing the total amount of outstanding credit card debt to $1.351 trillion, just $1 billion away from the all time high set in October 2024.
Meanwhile, non-revolving credit rose by its slow and steady monthly pace of $7.4 billion, lifting the total amount of student and auto loans to a new record high of $3.816 trillion.
This brief, but multi-chart Zero Hedge article appeared on their Internet site at 3:32 p.m. on Friday afternoon EDT -- and another link to it is here.
Bessent's Gambit -- Doug Noland
I do not see compelling data that would warrant downgrading overheating risks. Instead, financial conditions remain exceptionally loose, and inflationary pressures are ever more deeply ingrained.
It was, however, a conveniently timed weak jobs report. Stocks added to strong weekly gains, with the VIX (equities volatility) Index closing the week at 14.9, the low back to the week of January 9th. The S&P500 Friday posted a record close.
Notably, 10-year Treasury bond yields dipped a measly three bps (30-yr 2.5bps) on the surprising job losses – closing the week at 4.65% (down 9bps for the week). The rates market ended the week pricing 28 bps of rate cuts this year, down from last Friday’s 37 bps.
What impact might Friday’s Non-Farm Payrolls have on a divided Warsh Fed? I doubt the hawks will be swayed, while the doves will be emboldened. The new chair’s job was not made any easier.
“So what IS the U.S. doing?” My read has the Trump administration recognizing acute underlying market fragility. Bessent is willing to take extraordinary measures to prevent potentially unmanageable market instability – egregiously speculative stock market near record highs notwithstanding. And this is what markets have expected – what’s built into elevated prices and historically depressed risk premiums. The “Trump put” in action – sophisticated, crafty, aggressive and proactive. Bessent this week went so far as to invoke Mario Draghi’s “whatever it takes” (from 2012 European bond crisis).
So, we can pretty much dismiss Kevin Warsh’s rhetoric on scaling back the Fed’s balance sheet and market interventions more generally (less than three months into his term!). I’ll assume the Fed Chair shares Bessent’s worry that intensifying currency instability might force Japan to liquidate Treasuries to fund yen support operations, selling that would push Treasury yields even higher while further pressuring vulnerable marketplace liquidity. Higher Treasury yields and waning liquidity would reverberate through fragile global bond markets, risking a disorderly unwind of “carry-” and “basis-trade” leverage around the world. That’s the nightmare scenario the administration is hellbent on avoiding, especially while at war and with midterms looming less than three months away.
Doug's weekly market commentary is definitely worth reading this week -- and the link to this one is here.
Three worthwhile and informative video interviews
1. All Out War w/Iran Getting Unavoidable -- Colonel Doug Macgregor
This 56-minute video interview with the colonel was hosted by Lt. Colonel Daniel Davis on Thursday -- and it's definitely worth your time if you have the interest. Believe it or not, but I found it all by myself! The link to it is here.
2. Saudi, Pakistan, Türkiye Just Signed a Joint Defense Pact -- Ambassador Chas Freeman
Another long video interview...this one for 52 minutes...with host Nima Alkhorshid, put in an appearance on the youtube.com Internet site early on Friday morning EDT. It's also worth watching if you have the interest. I thank Guido Tricot for sending it our way -- and the one that follows. The link to this one is here.
3. INTEL Roundtable: Weekly Wrap - 7 August w/Larry Johnson, Pepe Escobar, & Scott Ritter
This weekly wrap-up with these three gentleman showed up on the youtube.com Interne site late on Friday afternoon EDT. It was hosted by Judge Andrew Napolitano -- and this one runs for 38 minutes. I thank Guido for sharing it with us -- and the link to it is here.
The dollar’s global dominance is starting to slip. This was the tell.
President Donald Trump and Treasury Secretary Scott Bessent chalked up last week’s historic joint intervention to support the yen as a friendly gesture in support of an ally.
Wall Street analysts later explained that the real motivation was likely to protect the Treasury market, just as volatility was starting to tick higher.
Now, one prominent economist is warning that the specific methods used by the Treasury and Federal Reserve to help prop up the struggling yen send a troubling message about the status of the greenback.
But by selling euros instead of dollars to help support the Japanese currency — and by encouraging Japan to use a Fed facility that would allow Japanese authorities to support the yen without directly selling Treasurys — the U.S. is sending a troubling message, according to economist Barry Eichengreen.
For years, central bank reserve managers accumulated Treasurys and other dollar-denominated reserves because these instruments were deeply liquid.
The fact that Treasurys could be sold to support a domestic currency was part of the appeal.
But by signaling that it is no longer comfortable with U.S. allies selling Treasurys to support their own currencies, the Trump administration may have — perhaps inadvertently — dented the appeal of Treasurys as a reserve asset, Eichengreen wrote in a column in the Financial Times.
“The bottom line is that Washington, fearing the consequences for U.S. financial markets, is reluctant to see foreign central banks use their dollar reserves. This is telling us that the dollar is not the attractive reserve currency it once was,” he wrote.
Precisely, dear reader -- and I have more on this in The Wrap. This news item showed up on the marketwatch.com on Thursday afternoon EDT -- and I found it embedded in a GATA dispatch on Friday -- and another link to it is here.
China’s exports growth beats estimates in July, as A.I.-driven shipments surge
China’s exports rose more than expected in July, though growth eased from June’s blistering pace, with global demand for high-tech components helping absorb the country’s goods.
Exports grew 23.9% in U.S. dollar terms in July from a year earlier, official customs data showed Friday, topping Reuters-polled analysts’ forecast for a 22.2% growth. That slowed from June’s 27% surge, which was the fastest pace since October 2021.
Imports rose 27.5% last month, just shy of Reuters estimates of 27.9% in a Reuters poll, slowing from June’s 36% jump — the quickest in five years.
A worldwide build-out of AI infrastructure has helped support the world’s second-largest economy through a year of geopolitical shocks, keeping growth on track even as domestic consumption has been subdued.
China’s integrated circuit exports by value nearly doubled this year as of the end of July, from the same period last year, according to official data compiled by Wind Information. In July alone, chip exports surged 117% from a year earlier.
Exports of mechanical and electrical products accounted for more than 60% of China’s total shipments in the first seven months this year, according to China’s customs authority, driven by demand for electric vehicles, lithium battery and wind power generating equipment. Among the other fast-growing export categories were 3D printers and industrial robotics.
This CNBC story was posted on their website at 10:47 p.m. on Thursday night -- and was updated about three hours later. It comes courtesy of Swedish reader Patrik Ekdahl -- and another link to it is here.
China is moving some gold from London to new Hong Kong trading hub
China's central bank is stockpiling more gold in Hong Kong, according to people familiar with the matter, in a move that's likely to support the city's push to become a major bullion-trading hub.
The People's Bank of China has built up inventories in Hong Kong over the past few months, said the people, who asked not to be named discussing private matters.
The latest additions are accelerating a longer-term trend whereby the PBOC has been moving some of its gold reserves back home from London, they added.
That relocation of metal from London to Hong Kong is set to continue, the people said.
The rest of this Bloomberg story from Friday is hidden behind their paywall -- and I found it on the gata.org Internet site. Another link to it is here.
China's gold reserves rise by most since October 2023 as buying pace quickens
China's central bank stepped up its gold purchases for a fifth straight month in July, adding the most bullion to its reserves since October 2023, official data showed today.
The People's Bank of China extended its gold-buying run to a 21st consecutive month, with reserves rising to 76.08 million fine troy ounces at the end of July from 75.44 million a month earlier.
The 640,000-ounce increase, equivalent to nearly 20 metric tons, was the biggest monthly addition since October 2023, when holdings rose by 740,000 ounces.
The PBOC added 480,000 ounces in June, which was the biggest monthly gain since October 2023 at the time.
The pace of purchases has increased each month since March, when the central bank added 160,000 ounces.
Well, dear reader, I suspected that they would be buying that dip, since the western financial system had carved about $1,500 off it price. This Reuters story, co-filed from Beijing and Shanghai, put in an appearance on their website at 2:06 a.m. PDT on Friday morning -- and I found this in a GATA dispatch as well. The link to it is here.

QUOTE of the DAY

The WRAP
"Understand this. Things are now in motion that cannot be undone." -- Gandalf the White
Today's pop 'blast from the past' is one I've featured several time over the last eleven or so years I've been writing this rag -- and I'm in a nostalgic mood... so here it is again. Canadian singer/songwriter Joni Mitch composed it -- and it was a minor hit here, although I personally couldn't stand it. Then Crosby, Stills, Nash & Young made a hit out of it in the U.S. -- and here in Canada as well, early in 1970. Graham Nash was Joni's 'significant other' at the time, so now you know how that came about.
Later that same year it was rearranged and re-recorded by British band Matthews Southern Comfort -- and that version was huge hit in the U.K. and in Europe. Its November 1970 release in the U.S. fizzled...but its January 1971 release in Canada attracted the attention of American radio stations -- and U.S. listeners across the border in the U.S...gaining newfound interest.
The rest, as they say, is history -- and the link to it is here. Of course there's a bass over to this -- and infusion26 lays it down perfectly. The link to that is here.
Today's classical 'blast from the past' is Ludwig van Beethoven's Piano Concerto No. 5 in E♭ major, Op. 73, known as the Emperor Concerto in English-speaking countries. Composed in Vienna in 1809...while the Napoleonic Wars were raging all around the city...its public premiere was on 28 November 1811 in Leipzig, with Friedrich Schneider as the soloist and Johann Philipp Christian Schulz conducting the Gewandhaus Orchestra.
Beethoven's hearing loss did not prevent him from composing music, but it made playing at concerts increasingly difficult...which is why he wasn't the soloist, as he was a formidable concert pianist.
Here's Romanian-born concert pianist Alina Bercu at the keyboard... accompanied by the Orchestra of the University of Music FRANZ LISZT Weimar in a live performance on 16 November 2017. Maestro Nicolás Pasquet conducts -- and the link is here.
It was another big 'up' day in both gold and silver...but it was more than obvious that the collusive commercial traders of whatever stripe were on the lookout for too much "irrational exuberance" -- and showed no qualms about stepping in when they deemed it necessary.
Both silver and gold were closed well off their respective high ticks -- and in the case of silver, they stopped it pennies before it hit $66 'bid' in the spot market. Both still have quite some distance to go before they touch the overbought mark on their respective RSI traces. Silver is now back above its 50-day moving average for the first time since mid May.
Net volume was on the lighter side in silver from an historical basis in both -- but a very long way above the fumes & vapours we've grown accustomed to over the last few months. Net gold volume was a bit heavier -- and compounded by the fact that October is back as a scheduled delivery month after a 60+ year absence. Traders are still doing most of their business in December...but for the purposes of this column, I'm using the combined volumes of both October and December as my 'net' number...which certainly muddies the water.
Total gold open interest in last night's preliminary report only rose by around 8,700 contracts -- and in silver, by only 1,700 contracts. These were very small amounts considering the size of the price moves in both. Whether this means anything won't be know until next Friday's COT Report -- and there are still two more trading days left in the reporting week before the cut-off for it.
For whatever reason, 'da boyz' have kept both platinum and palladium on very short price leashes since they broke above their respective 50-day moving averages this past Tuesday. In the case of palladium, it was barely allowed to close in positive territory for the second day in a row.
Copper had its second 'down' day, as it shed a hefty 12.5 cents -- and finished the Friday trading session at $6.56/pound...but still comfortably above any moving averages that matter.
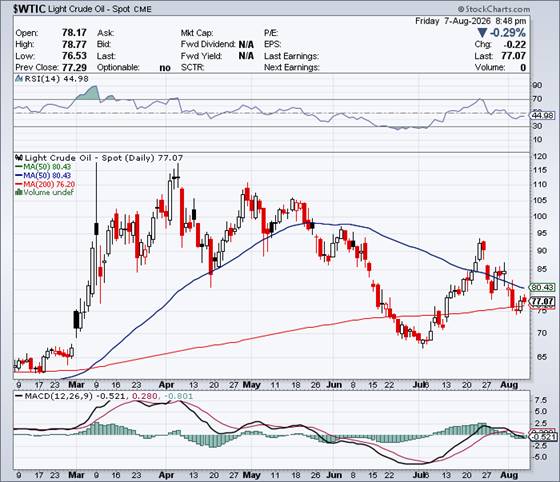
Natural gas [chart included] finally managed a small gain...up 3 cents at $2.67/1,000 cubic feet. WTIC closed lower by 22 cents -- and finished Friday at $77.07/barrel. It remains above its 200-day moving average by a bit...but still below its 50-day...if that means anything in this obviously managed market.
Here are the 6-month charts for the Big 6+1 commodities as of their closes on Friday...thanks to stockcharts.com as always. Click to enlarge.
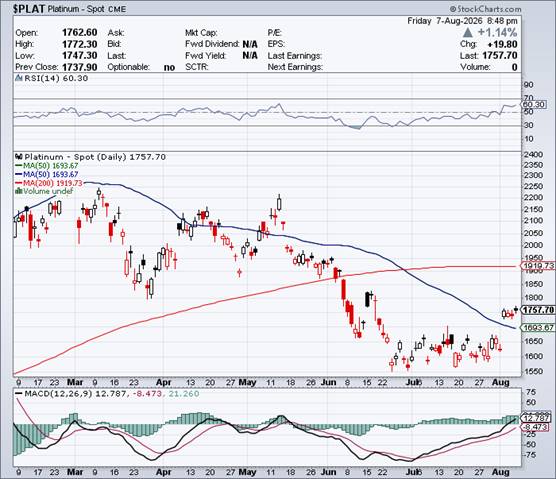
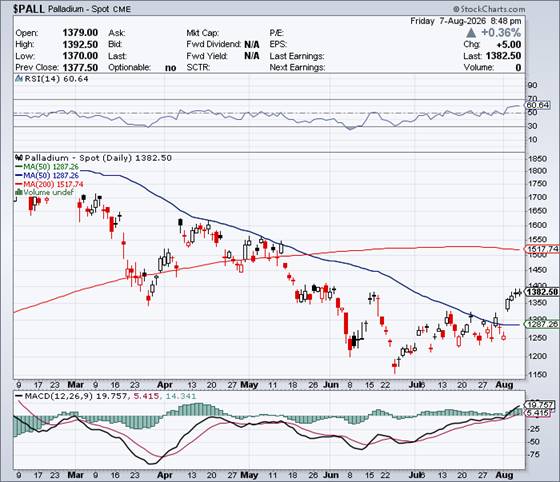
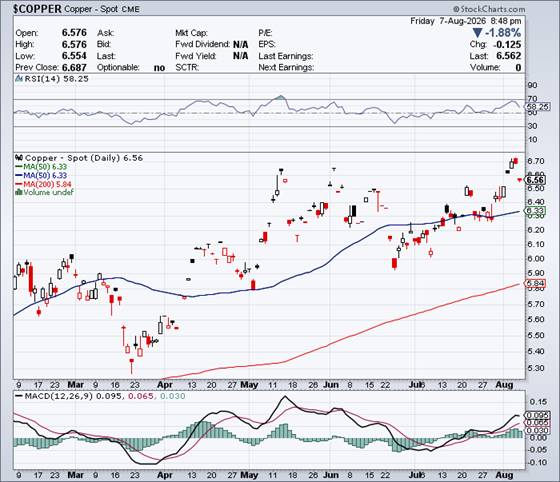
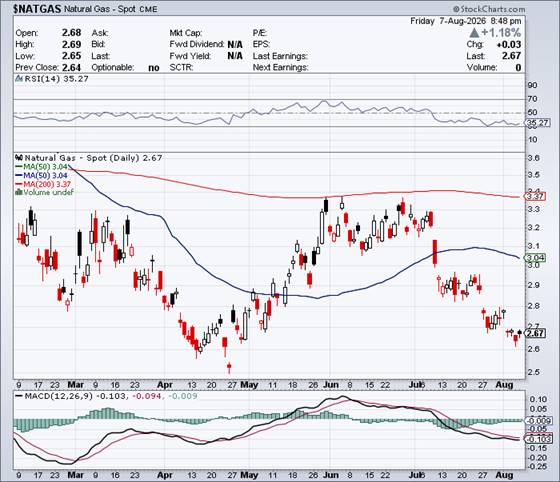
In this spot in Friday's column, I had an 'X' post, the contents of which I've been thinking about almost every waking hour since then. In part, it stated the following...
"The FT said that Washington is reluctant to see foreign central banks use their dollar reserves, and reserve diversification is apt to gather steam. They are terrified for their own markets...essentially, if Treasuries can't be sold in a crisis without worsening the crisis, they are no longer fit for purpose as FX reserves. I mean, Japan needed dollars, couldn't sell its Treasuries without breaking the market they underwrite, so the Fed built a repo pipe around the problem and Washington reassured Brussels its euro sales were only re-allocation. Every reserve manager had to watch a G7 creditor [nation] ask for permission to use its own savings. Ridiculous. Btw, the asset that doesn't require permission is at $4,224 this evening. Act accordingly"
That "asset that doesn't require permission" closed higher by $117 on Friday at $4,341 spot.
Then there was this lengthy 'X' post that I also received on Thursday morning ...this one by SightBringer@_The_Prophet__ that Richard Saler sent our way -- and I just didn't have space for it in Friday's missive, so here it is now. The author is trying to explain the current 'Everything Bubble"/Financial Ponzi Scheme in as few words as possible.
"The United States has begun converting the financial system into a sovereign absorption mechanism. The debt no longer enters a neutral market and discovers a price. The market is redesigned so the debt remains absorbable. Bills feed money funds. Regulations steer banks and pensions. Collateral rules privilege Treasuries. Fed facilities protect dealers and funding markets. Foreign institutions receive liquidity backstops. Asset markets are defended because falling collateral would weaken the buyer base for sovereign liabilities. Every major part of finance is being arranged around one requirement: The federal balance sheet must always clear. That changes the meaning of markets. Price discovery survives at the edges. At the center, system survival outranks price.
A sufficiently violent rise in Treasury yields threatens mortgages, banks, deficits, equities, pensions, insurers, and the dollar funding system simultaneously. The government cannot permit that price to fully clear because the clearing price would damage the machinery required to finance the government.
The debtor has become responsible for maintaining the solvency of its creditors. That is the loop. Treasury issues liabilities. The financial system holds them as reserves, collateral, and capital. Those holdings support leverage across the economy. The government then protects the leveraged economy because its collapse would destroy demand for Treasury liabilities.
Debt supports the system. The system supports the debt. Neither can now be allowed to reprice independently. Bill issuance is the cleanest expression of this fusion because bills turn fiscal deficits into money-like instruments. The state spends into the economy, issues short claims against that spending, and supplies those claims to institutions that treat them as cash substitutes.
Fiscal expansion manufactures its own monetary medium. That is why the distinction between fiscal and monetary policy is collapsing. The Fed creates base money. Treasury creates yield-bearing near-money. Banks and money funds distribute both. Markets capitalize the resulting liquidity. The combined machine expands nominal claims faster than the real economy can always expand the goods, energy, housing, labor, and infrastructure beneath them.
The excess must resolve somewhere. Asset inflation. Consumer inflation. Currency dilution. Higher yields. Financial repression. Usually several at once. The real policy objective is not sound money. It is controlled degradation. The currency must weaken slowly enough that holders continue accepting it. Bond yields must remain high enough to preserve demand and low enough to preserve the debtor. Inflation must remain high enough to erode liabilities and low enough to avoid revolt. Asset prices must remain high enough to preserve collateral and low enough to avoid total political illegitimacy. The system must continuously dilute claims without revealing dilution as default. That is the operating corridor."
This is an updated Reader's Digest version of British economist Peter Warburton's classic essay from back in April 2001...twenty-five years ago... headlined "The Debasement of World Currency: It's Inflation, but not as we know it". His three famous paragraphs of note are contained under the sub-heading "Central Banks are engaged in a desperate battle on two fronts" -- and linked here.
The perfect metaphor for what we are facing today [or an analogy, if you prefer] is the 'self-licking ice cream cone'....which Wikipedia describes..."as a self-perpetuating system that has no purpose other than to sustain itself"... with the current 'Everything Bubble"/Ponzi Scheme being the mother of them all.
It's been said that nobody is there to ring the bell at the top of any market. However, not since Nixon "temporarily" suspended gold redemption for U.S. dollars back in August 1971, has there ever been a clearer sign that our current fiat currency system is doomed.
Going forward, no matter what moves the central banks of the world make... principally those of the Federal Reserve...will worsen their position. The German word for that in chess is Zugzwang -- and that's where they sit today. That exact same expression can be used to describe the predicament of the Big 8 shorts in silver, gold and platinum as well.
And ever since the Fed stepped in to rescue the Yen late last week...the precious metal complex has been in hard rally mode. China just announced they added another 20 tonnes of gold to their reserves in July -- and it's only a matter of time before the rush from paper assets to hard assets will be on in earnest on a global scale.
Never has a more iron-clad case been made to own the precious metals than the one investors face today. I'm ever so glad that I'm still "all in" -- and, as always, will remain so to whatever end.
I'm done for the day -- and the week -- and I'll see you here on Tuesday.
Ed
About the author

SUBSCRIBE: https://edsteergoldsilver.com/

Ed Steer’s Daily Analysis of the Gold and Silver Markets
After eight years of writing about the precious metals for Casey Research, the folks at Stansberry & Associates—who just recently purchased controlling interest in the company—decided that my ‘niche market’ column didn’t fit into their plans.
Since the time that Casey Research was kind enough to offer me a stand-alone column, it became their most highly-rated blog almost from the outset—and has remained that way up to this date...