
Excerpt from this week's: Technical Scoop: Weak Jobs, Gold Down, Economy Tippy
Gold and silver
Source: www.stockcharts.com
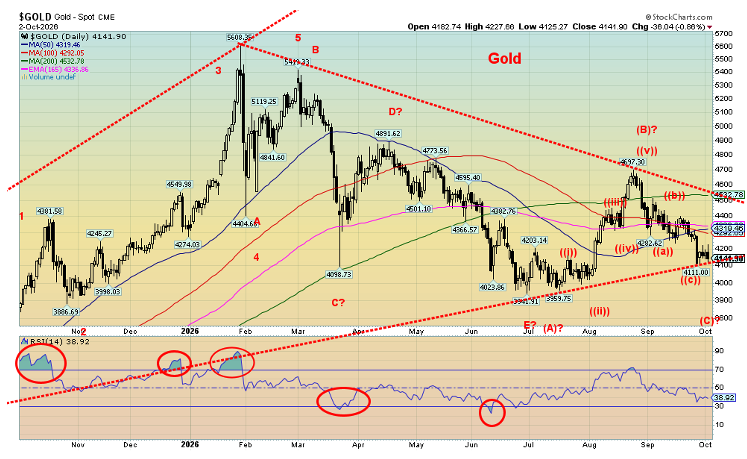
Gold and silver remain on their heels. As we noted under bonds, gold prices jumped following the release of the weaker than expected September job numbers. The rally didn’t last long. After rising $50 or so following the job numbers on Friday, gold closed down $36. That’s not a good sign. Gold is responding negatively to rising bond yields. And it may get worse as bond yields are on a continued trajectory to the upside. Will it spark a deeper gold sell-off? Quite possibly. It can’t be ruled out.
We always thought that the bear that followed the big gold run-up that topped in January 2026 would test lows. So far, so good. We are on the cusp of it, signaling to us that new lows are probable. On Friday, we closed at $4,145. Under $4,100, new lows below $3,942 are probable. Should this be a surprise? We know we are in a period that is not friendly to gold. It can last into December. The final low could come anytime from now until mid-December. Is it a panic? Probably not. It will be buying opportunity.
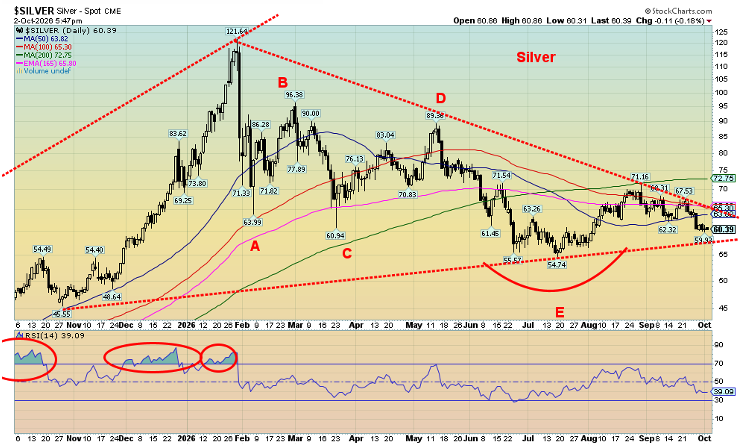
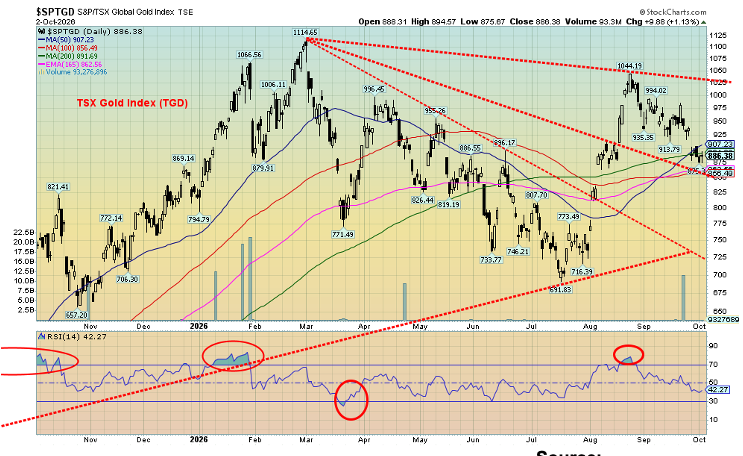
There were opportunities for gold to close higher this past week, with weaker than expected PCE prices and weaker than expected job numbers. Music for gold – not! Gold closed the week down 3.3%, silver was down 5.9%, and platinum was down 4.0%. Even the near precious metals didn’t respond as palladium fell 8.2% and copper fell 2.7%. Yes, copper fell, even as copper remains in a strong uptrend. The gold stocks fell too with the Gold Bugs Index (HUI) down 6.3% and the TSX Gold Index (TGD) down 5.3%. Downtrends dominate for daily and even some weekly.
Source: www.stockcharts.com
The result of all this is we’ll have to ride out what appears to be another thrust to the downside. How low could we go? Our worst-case scenario is down to $3,500. A swing down target is $3,200; however, we’d be quite surprised if we went that low. Silver? It breaks under $58. Under that level also signals new lows below $54.74. Major support is at $50. We’d be surprised if we fell that low. Ideally, either gold or silver makes new lows but the other one doesn’t. That divergence would signal a potential bottom. Also potentially positive is that the HUI and TGD are nowhere near their earlier lows. The odds of new lows for the HUI and the TGD are low. That’s another potential positive divergence.
The RSI for both gold and silver is under 40 but remains for the moment above 30 oversold levels. A decline under 30 would be welcome. It could even be expected. To be encouraging, the breakout levels are $4,500 gold and $65 silver. To be really sure, we’d prefer to see gold above $4,600 and silver above $73. For the TGD, a breakout is above 1,025, and for the HUI above 860 and initially above 800.
Despite the pain of the year-long correction for gold, silver, and the gold stocks, we remain positive. There is just too much debt and the U.S. is in a pickle with weakening bond auctions. Their deficits are too big. Wars continue. The geopolitics is fractured. In the U.S. politics is seriously fractured as we see continued attempts to fix the upcoming mid-terms in favour of the Republicans.
The U.S. is not the only one as Japan and the EU have significant debt problems as well. It’s one thing if Sudan goes under, but it’s another if France goes under. To gold that’s music. Gold is currency. And, oh yes, a strengthening US$ Index is not helping either. Higher interest rates are pulling the US$ Index higher. Indeed, we can’t help but notice that the US$ Index’s RSI is now well above 70 and the currencies (Cdn$, euro, etc.) have RSIs under 30 (oversold). Does that mean we are about to turn? No as overbought and oversold are just a state but it doesn’t pinpoint a top or a bottom.
Source: www.stockcharts.com
It has been a frustrating year for gold bugs. They’ve been here before, notably during 2011–2015. So far, the current decline is a picnic compared to 2011–2015.
Read the FULL report here: Technical Scoop: Weak Jobs, Gold Down, Economy Tippy
Copyright David Chapman 2026
Disclaimer
David Chapman is not a registered advisory service and is not an exempt market dealer (EMD) nor a licensed financial advisor. He does not and cannot give individualised market advice. David Chapman has worked in the financial industry for over 40 years including large financial corporations, banks, and investment dealers. The information in this newsletter is intended only for informational and educational purposes. It should not be construed as an offer, a solicitation of an offer or sale of any security. Every effort is made to provide accurate and complete information. However, we cannot guarantee that there will be no errors. We make no claims, promises or guarantees about the accuracy, completeness, or adequacy of the contents of this commentary and expressly disclaim liability for errors and omissions in the contents of this commentary. David Chapman will always use his best efforts to ensure the accuracy and timeliness of all information. The reader assumes all risk when trading in securities and David Chapman advises consulting a licensed professional financial advisor or portfolio manager such as Enriched Investing Incorporated before proceeding with any trade or idea presented in this newsletter. David Chapman may own shares in companies mentioned in this newsletter. Before making an investment, prospective investors should review each security’s offering documents which summarize the objectives, fees, expenses and associated risks. Although Artificial Intelligence (AI) may be deployed from time to time, AI output is monitored and adjusted, if necessary, for accuracy. David Chapman shares his ideas and opinions for informational and educational purposes only and expects the reader to perform due diligence before considering a position in any security. That includes consulting with your own licensed professional financial advisor such as Enriched Investing Incorporated. Performance is not guaranteed, values change frequently, and past performance may not be repeated.
About the author


Website: https://www.enrichedinvesting.com
Disclaimer: David Chapman is not a registered advisory service and is not an exempt market dealer (EMD) nor a licensed financial advisor. We do not and cannot give individualised market advice. David Chapman has worked in the financial industry for over 40 years including large financial corporations, banks, and investment dealers. The information in this newsletter is intended only for informational and educational purposes. It should not be considered a solicitation of an offer or sale of any security. The reader assumes all risk when trading in securities and David Chapman advises consulting a licensed professional financial advisor before proceeding with any trade or idea presented in this newsletter. David Chapman may own shares in companies mentioned in this newsletter. We share our ideas and opinions for informational and educational purposes only and expect the reader to perform due diligence before considering a position in any security. That includes consulting with your own licensed professional financial advisor.