
Excerpt from this week's: Technical Scoop: Precious Bid, Hormuz Hope, Declined Energy
Gold and silver
Source: www.stockcharts.com
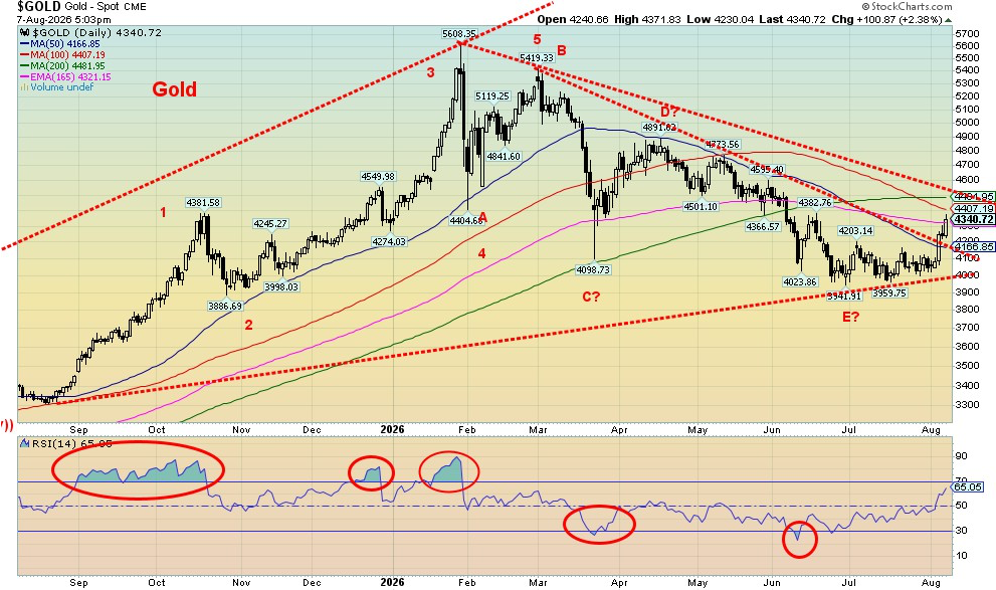
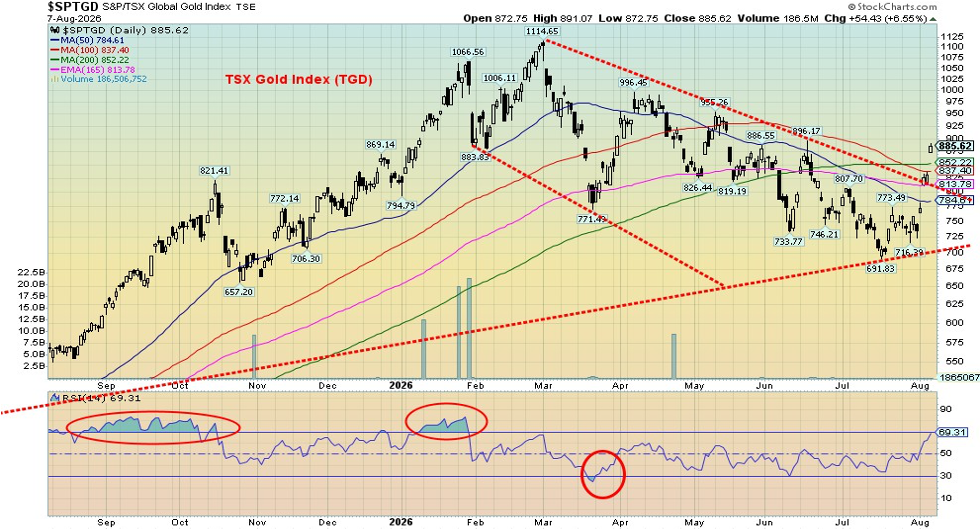
Is gold’s low in? Many are declaring so or at least would like to believe that is the case. We’re not quite with them. Yes, the breakout this past week looks good. Gold stocks appear to have broken a sharp downtrend line. Note the chart of the TSX Gold Index (TGD) on the next page. We’ve seen similar breakouts on others as well. It’s all very positive, but we can’t quite say the final low is in. We usually reserve that to making new highs. $5,600 remains a way away.
The five-wave descent which we have labeled ABCDE could just be an A wave of a higher degree. We could now be embarking on the B wave of a higher degree. We have entered a positive seasonal period which could last into September and even October. But the October/December period is often a weak period as we have noted in the past. Failure to make new highs on this run could result in another test of the lows and even new lows before we embark on a stronger up move. We are roughly four years from the important 2022 low but that tells us that we are only halfway through the current 7.8-year cycle. The question, of course, is will the second half-cycle see new highs or are we entering a more prolonged down cycle? The gold bulls believe it is the former and we will see new highs up to $6,000 or $7,000. Some are even calling for $10,000. All that may be true, but to date we see no evidence nor do we have confirmation of a low.
Source: www.stockcharts.com
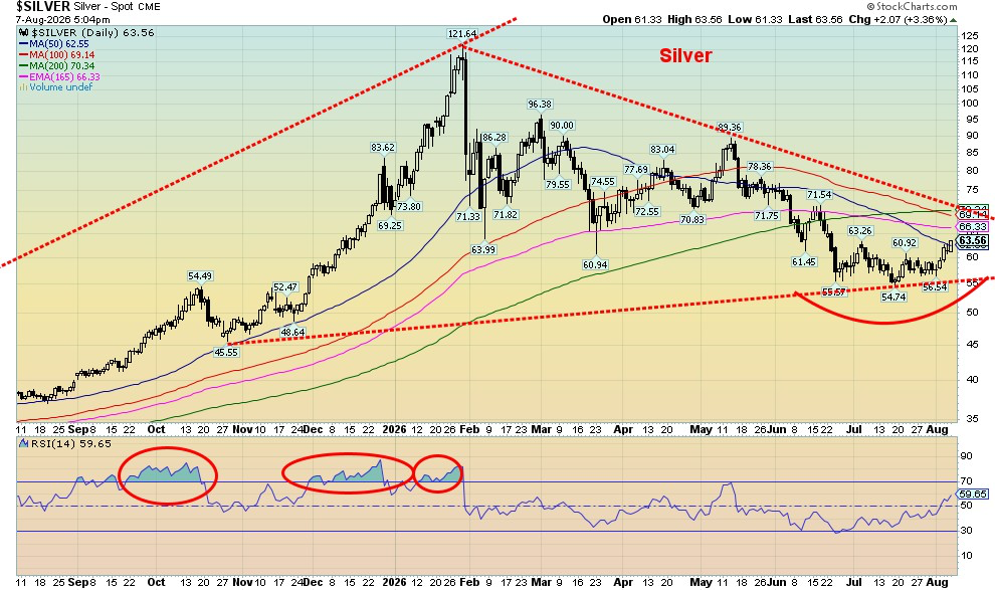
For starters, we need to break out over $4,400 to confirm the low at $3,941. But we need to break and close above $5,200 to even begin to think about a run to new highs. Once we see new highs above $5,600, then we can focus on possible higher targets. Silver is in the same position. The decline from the January high of $121.64 has unfolded as either an ABC or also an ABCDE – a corrective wave. We won’t break out until we are over $70. We need to regain above $106 to suggest new highs. As a result, we are cautious about silver until we see better action. The gold/silver ratio did improve and now sits at 68.37, well down from the 126 high of 2020 during the pandemic.
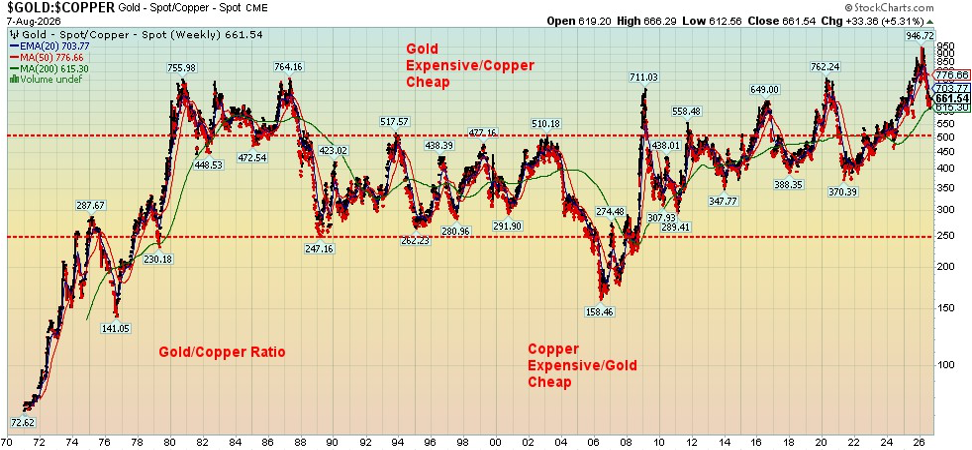
On the week, gold rose 7.3% and is now positive on the year again. Silver was up 9.9% but remains negative for 2026. The gold stocks were impressive, where the Gold Bugs Index (HUI) jumped 21.9% and the TSX Gold Index (TGD) was up 20.4%. Both are now positive on the year with the HUI up 7.4% and the TGD up 8.3%. Platinum rose 5.9% while palladium was up 8%. Copper made new all-time highs (barely), gaining 1%. Copper, we believe, is the leader. So, gold will move to catch up. That said, gold remains somewhat expensive vis-à-vis copper. The following chart of the Gold/Copper ratio still shows that gold remains expensive. Even if gold were to start to catch up to copper’s move, copper could still outperform.
The rally this past week is positive. We appear to be embarking on another up move. Our big question is, is this a move that takes us to new highs or merely a corrective wave to the January/July down move? We suspect it’s the latter. But eventually we should break out to new highs. However, that might not occur until 2027.
Source: www.stockcharts.com
Source: www.stockcharts.com
Read the FULL report here: Technical Scoop: Precious Bid, Hormuz Hope, Declined Energy
Copyright David Chapman 2026
Disclaimer
David Chapman is not a registered advisory service and is not an exempt market dealer (EMD) nor a licensed financial advisor. He does not and cannot give individualised market advice. David Chapman has worked in the financial industry for over 40 years including large financial corporations, banks, and investment dealers. The information in this newsletter is intended only for informational and educational purposes. It should not be construed as an offer, a solicitation of an offer or sale of any security. Every effort is made to provide accurate and completeinformation. However, we cannot guarantee that there will be no errors. We make no claims, promises or guarantees about the accuracy, completeness, or adequacy of the contents of this commentary and expressly disclaim liability for errors and omissions in the contents of this commentary. David Chapman will always use his best efforts to ensure the accuracy and timeliness of all information. The reader assumes all risk when trading in securities and David Chapman advises consulting a licensed professional financial advisor or portfolio manager such as Enriched Investing Incorporated before proceeding with any trade or idea presented in this newsletter. David Chapman may own shares in companies mentioned in this newsletter.Before making an investment, prospective investors should review each security’s offering documents which summarize the objectives, fees, expenses and associated risks. Although Artificial Intelligence (AI) may be deployed from time to time, AI output is monitored and adjusted, if necessary, for accuracy. David Chapman shares his ideas and opinions for informational and educational purposes only and expects the reader to perform due diligence before considering a position in any security. That includes consulting with your own licensed professional financial advisor such as Enriched Investing Incorporated. Performance is not guaranteed, values change frequently, and past performance may not be repeated.
About the author


Website: https://www.enrichedinvesting.com
Disclaimer: David Chapman is not a registered advisory service and is not an exempt market dealer (EMD) nor a licensed financial advisor. We do not and cannot give individualised market advice. David Chapman has worked in the financial industry for over 40 years including large financial corporations, banks, and investment dealers. The information in this newsletter is intended only for informational and educational purposes. It should not be considered a solicitation of an offer or sale of any security. The reader assumes all risk when trading in securities and David Chapman advises consulting a licensed professional financial advisor before proceeding with any trade or idea presented in this newsletter. David Chapman may own shares in companies mentioned in this newsletter. We share our ideas and opinions for informational and educational purposes only and expect the reader to perform due diligence before considering a position in any security. That includes consulting with your own licensed professional financial advisor.