
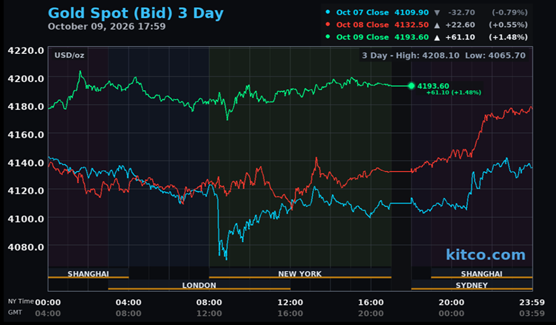
Gold's impressive rally that began right at 6:00 p.m. in New York on Thursday evening, ran into not-for-profit selling by the collusive commercial traders of whatever stripe at 1:37 p.m. China Standard Time on their Friday afternoon, shortly after it broke above $4,200 spot -- and was then sold/engineered lower until around 8:55 a.m. in COMEX trading in New York. Its ensuing rally attempt was capped at the 10 a.m. EDT afternoon gold fix in London -- and from that point it was forced to wander quietly sideways until the market closed at 5:00 p.m. EDT.
The low and high ticks in gold were recorded by the CME Group as $4,156.10 and $4,233.70 in the December contract...an intraday move of $77.60 the ounce. The October/December price spread differential in gold at the close in New York yesterday was $25.30...December/February was $35.20...February/ April was $34.50 -- and April/June27 was $36.30 an ounce.
Gold was closed in New York on Friday afternoon at $4,193.60 spot...up $61.10 on the day -- and $12.50 off its Kitco-recorded high tick. Net volume was super ultra light at around 116,000 contracts -- and there were just about 18,500 contracts worth of roll-over/switch volume on top of that.
I saw that 228 gold, plus only 11 silver contracts were traded in October yesterday and, as is always the case, it remains to be seen just how much of these amounts show up in tonight's Daily Delivery and Preliminary Reports further down in today's column.
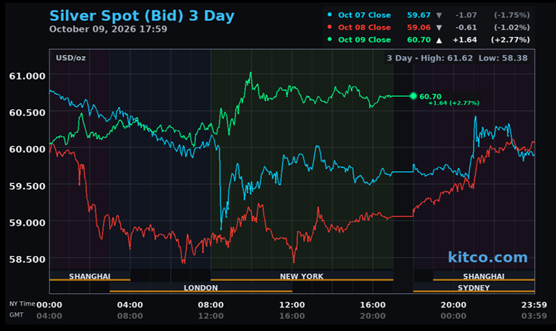
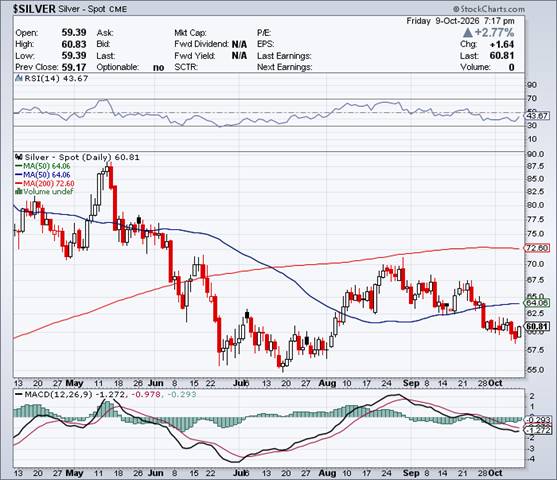
Silver's decent rally in Globex trading in New York on Thursday evening -- and in Globex trading in the Far East, also ran into 'da boyz' at 1:37 p.m. in Shanghai on their Friday afternoon. It was sold/engineered lower until at or a few minutes after the noon silver fix in London -- and its ensuing rally was also capped at the 10 a.m. EDT afternoon gold fix over there...which was minutes after it broke above $61 spot on the 'bid' side. It was sold/engineered a bit lower until around 10:45 a.m. EDT and, like gold, was forced to wander quietly sideways until the market closed at 5:00 p.m.
The low and high ticks in silver were reported as $59.45 and $61.46 in the December contract...an intraday move of $2.01 an ounce. The December/ March price spread differential in silver at the close in New York yesterday was 75.9 cents...March/May was 53.3 cents -- and May/July27 was 51.5 cents an ounce.
Silver was closed on Friday afternoon in New York at $60.70 spot...up $1.64 on the day -- and 35 cents off its Kitco-recorded high tick. Net volume was very much fumes & vapours at 26,500 contracts -- and there were a bit over 10,000 contracts worth of roll-over/switch volume in this precious metal...with very noticeable amounts into March, May and July of next year.

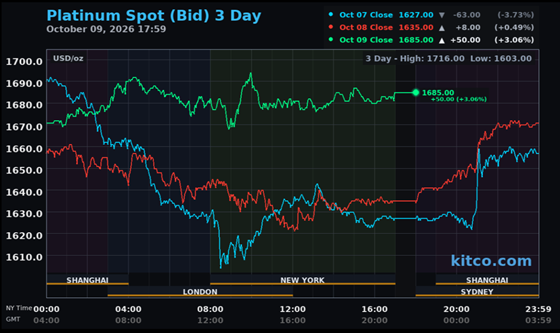
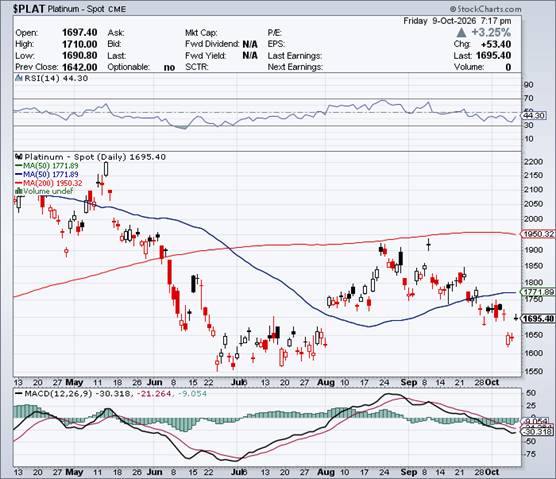
Platinum stair-stepped its way broadly higher -- and 'da boyz' didn't show up in it until 10:30 a.m. in Globex trading in Zurich. Then, like gold, it was engineered lower until around 8:55 a.m. in COMEX trading in New York, with its ensuing rally also capped at the 10 a.m. EDT afternoon gold fix in London. It was hammed lower until 10:30 a.m. -- and then crept quietly and unevenly higher under very close supervision until trading ended at 5:00 p.m. EDT. Platinum was closed at $1,685 spot...up 50 bucks from Thursday -- and 10 dollars off its Kitco-recorded high tick.
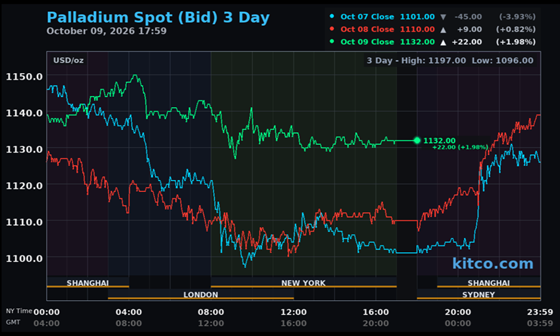
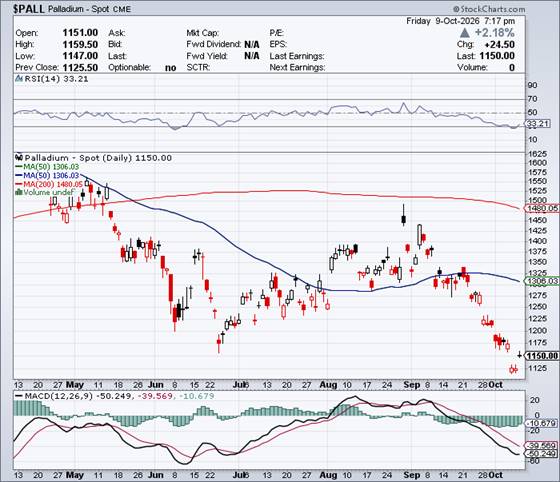
Palladium's broad rally in Globex trading overseas on Friday met the same fate as platinum's -- and at the same time in Zurich. Its New York low was set around 9:10 a.m. in COMEX trading in New York...with its ensuing rally also running into 'something' at the 10 a.m. EDT afternoon gold fix in London. It was then sold/ engineered lower until 12:30 p.m. -- and forced to chop quietly sideways until trading ended at 5:00 p.m. EDT. Platinum was closed at $1,132 spot...up 22 dollars from Thursday -- and 19 bucks off its Kitco-recorded high tick.
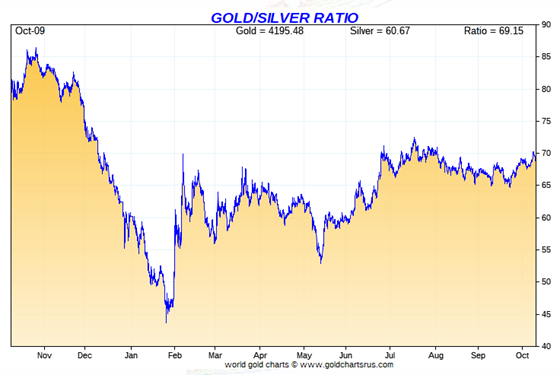
Based on the kitco.com spot closing prices in silver and gold posted above... the gold/silver ratio worked out to 69.1 to 1 on Friday...compared to 70.0 to 1 on Thursday.
Here's the 1-year Gold/Silver Ratio chart from Nick Laird -- and updated with this past week's data. Click to enlarge.
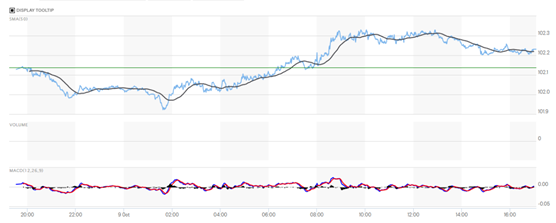
The dollar index closed very late on Thursday afternoon in New York at 102.14 -- and then opened lower by 1 basis point once trading began around 7:32 p.m. EDT on Thursday evening...which was 7:32 a.m. China Standard Time on their Friday morning. It took two broad steps lower from there until it appeared to get rescued at 1:35 p.m. in Shanghai...the Friday high ticks in gold, silver and platinum. It then wandered quietly higher until 8:55 a.m. in New York...the New York lows for gold and platinum. Palladium's low came 20 minutes after that. It then traded sideways until around 12:55 p.m. -- and then chopped quietly lower until around 2:52 p.m. EDT. It didn't do much of anything after that.
The dollar index finished the Friday trading session in New York at 102.23...up 9 basis points from its close on Thursday.
Here's the DXY chart for Friday...thanks to marketwatch.com as usual. Click to enlarge.

Here's the 6-month U.S. dollar index chart...courtesy of stockcharts.com as always. The delta between its close...102.23...and the close on DXY chart above, was zero basis points. Click to enlarge.
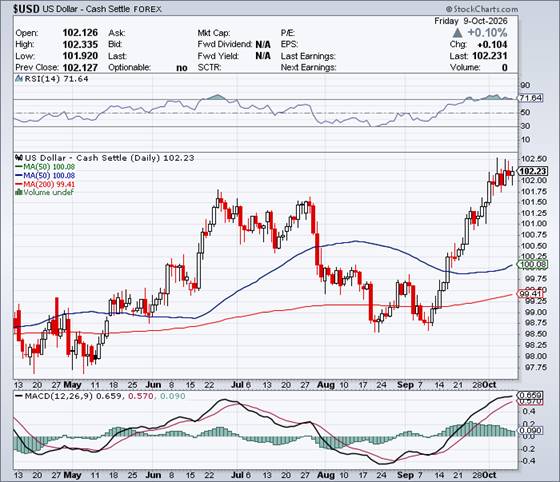

One has to wonder what precious metal prices would have closed at if the financial powers-that-be hadn't arrived on the scene at 1:37 p.m. in Shanghai to rescue the dollar index yet again. And on another note, this dollar index rally looks awful toppy.
U.S. 10-year Treasury: 5.24%...up 0.01/(+0.25%)...as of the 1:59:55 p.m. CDT close
The yield on the ten-year hit the 5.284% mark around 9:42 a.m. CDT/10:42 a.m. EDT -- and would have certainly continued higher if the Fed hadn't appeared on the scene.
For the week, the ten-year yield was closed within a tiny fraction of one percent of unchanged -- but only because of the ongoing interventions by the Fed, which are obviously getting more egregious by the day.
With its old high of 4.92% back on 15 October 2023 now in the history books ...here's a much broader look at the yield on the ten-year...for the last 40+ years. Click to enlarge.
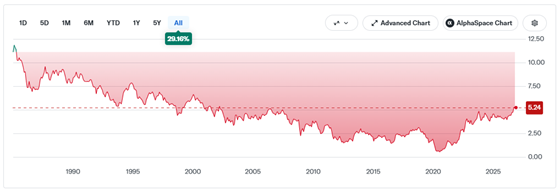
The yield on the ten-year hasn't been this high since March 2002...almost a quarter of a century ago.
The situation is now beyond critical for bond yields globally, with no hope going forward. Yield curve control is now the order of the day in the U.S. -- and we'll see how long Bessent & Co. can keep rates from rising further. See Doug Noland's commentary in the Critical Reads section.

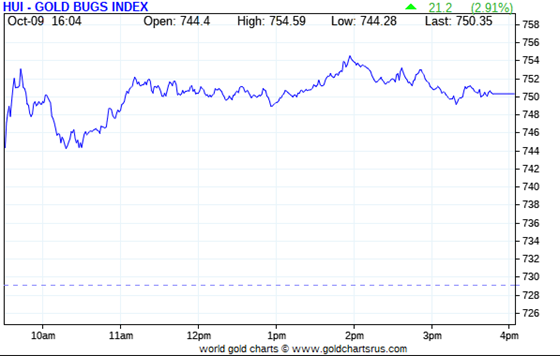
The gold stocks jumped higher at the 9:30 a.m. opens of the equity markets in New York on Friday morning -- and that all ended fifteen minutes later. From that juncture they wandered quietly and a bit unevenly sideways until the markets closed. The HUI finished the Friday session higher by 2.91 percent.

Although silver vastly outperformed gold yesterday, the gains in the silver equities weren't allowed to reflect that, as Nick Laird's Silver Sentiment Index closed up only 2.97 percent...barely edging out the performance of the gold stocks. Click to enlarge.
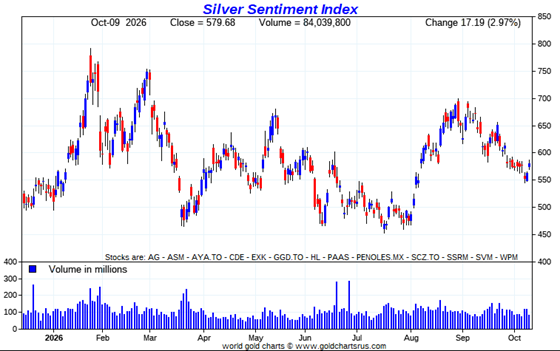

The absolute star yesterday was Santacruz Silver Mining, as it closed higher by 8.31 percent on no news that I could see. After them came SSR Mining... closing up 5.62 percent. The biggest underperformer was Endeavour Silver, as it closed higher by only 0.93 percent.
Silver closed higher by 2.77% on Friday -- and Nick's Silver Sentiment Index closed up only 2.97%. Sprott's PSLV finished the day up by 2.53%
Gold closed up 1.48% -- and the HUI closed higher by 2.91% -- and Sprott's PHYS closed up 1.60%
The Shanghai/U.S. price premium in silver on Friday was 12.83 percent.
The reddit.com/Wallstreetsilver website, now under 'new' and somewhat improved management, is linked here. The link to two other silver forums are here -- and here.

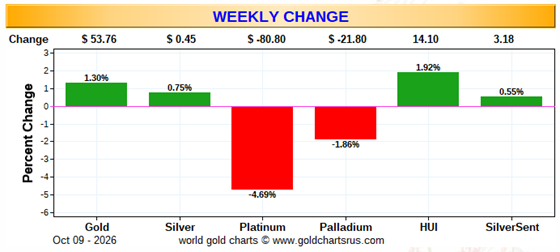
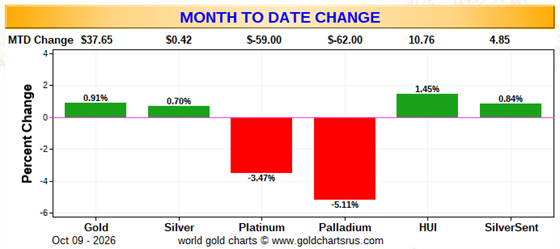
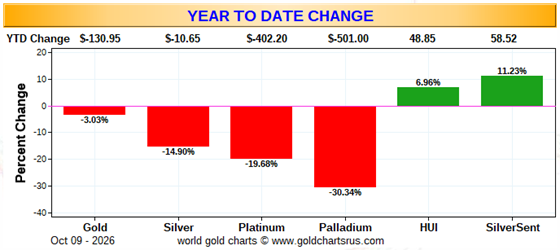
Here are the usual three charts that appear in this spot in every weekend missive. They show the changes in gold, silver, platinum and palladium in both percent and dollar and cents terms, as of their Friday closes in New York — along with the changes in the HUI and the Silver Sentiment Index.
Here's the weekly chart -- and I'm just happy that everything gold and silver-related are in the green this week...because last week's chart was wall-to-wall red. Click to enlarge.
Here's the month-to-date chart...which is only two trading days longer than then weekly chart -- and for that reason, doesn't look much different. Like the weekly chart, I'm not prepared to read anything into it because of the massive interventions by 'da boyz' with the black hats in both silver and gold -- and their associated equities. Click to enlarge.
Here's the year-to-date chart -- and it remains a lot different from the other two charts. 'Da boyz' continue to keep all four precious metals down on the year. But it remains of great interest that the precious metal shares are 'outperforming' the metals themselves by as much as they are over this time period...especially the silver stocks.
However -- and as I stated in this spot in last week's missive, I'm starting to wonder if all these gains in the precious metal equities YTD were because 'da boyz' were accumulating their stocks in order to manipulate them downwards when required. Click to enlarge.
Despite the fact that silver has now broken the $120 barrier...albeit briefly -- and the silver well in London came close to running dry a year ago now...the gold/silver ratio remains at a farcical 69.1 to 1 as of Friday's close. The 'normal' and historical ratio is around 15 to 1...which would put silver at around $280 based on gold's closing price on Friday. And if priced at the ratio of 7:1 that it comes out of the ground at...compared to gold...that would put silver at around $600 an ounce. So a rather impressive triple-digit silver price is in our future...most likely somewhere between those two numbers.
As I say in this spot every Saturday...all that remains to be resolved is what that price will be -- and how soon 'da boyz' allow it to happen. Its first attempt to reach one of these values back at the end of January was obviously crushed ...as were all the rest since then. How its current rally ends, remains to be seen. But in the face of its continuing structural deficit -- and all the other stuff going on in the world today, they can't keep it up forever. I have lots more about this in The Wrap.

The CME Daily Delivery Report for Day 9 of the October delivery month showed that 138 gold -- and only 1 silver contract were posted for delivery within the COMEX-approved depositories on Tuesday.
In gold, the two largest short/issuers of the five in total were Marex Capital Markets and Wells Fargo Securities...issuing 120 and 12 contracts respectively ...the latter from their house accounts. The two biggest long/stoppers were JPMorgan and ADM, picking up 112 and 18 contracts for their respective client accounts.
In silver, the sole short/issuer was Wells Fargo Securities out of its house account -- and JPMorgan stopped it for their client account.
In copper, a further 552 copper contracts/13.800 million pounds were issued and stopped.
The link to yesterday's Issuers and Stoppers Report is here.
Month-to-date there have already been 12,467 gold contracts issued and stopped -- and that number in silver is 3,126 COMEX contracts.
On First Notice Day for October, there were 12,328 gold contracts still open...plus 3,271 silver contracts...so those deliveries are done, or about done. Now it remains to be seen just how many more contracts will be added to each as the delivery month progresses.
The CME Preliminary Report for the Friday trading session, showed that gold open interest in October declined by 114 contracts, leaving 223 still around...minus the 138 contracts out for delivery on Tuesday as per the above Daily Delivery Report. Thursday's Daily Delivery Report showed that 255 gold contracts were actually posted for delivery on Monday...so that means that 255-114=141 more gold contracts were added to the October delivery month.
Silver o.i. in October fell by 353 contracts, leaving 370 still open...minus the 1 lone contract out for delivery on Tuesday as per the above Daily Delivery Report. Thursday's Daily Delivery Report showed that 358 silver contracts were actually posted for delivery on Monday...so that means that 358-353=5 more silver contracts were added to October deliveries.
Total gold open interest for the Friday trading session in last night's Preliminary Report fell by 496 COMEX contracts. Total silver o.i. declined by 836 contracts. I was expecting fairly substantial increases -- and I have more on this in The Wrap.
[I checked the final change in total open interest for gold on Thursday in Friday's final report from the CME Group -- and it fell by quite a bit...from +907 COMEX contracts, down to -2,794 contracts. The final change in total silver o.i. for Thursday barely moved...from +847 contracts, down to +844 COMEX contracts.]
Gold open interest in Novemberin Friday's Final Report for Thursday decreased by a further 82 COMEX contracts, leaving 4,015 contracts still open. But silver open interest in November in Friday's final report for the Thursday trading session rose by another huge amount...272 COMEX contracts, leaving 2,021 contracts still around. There have been a bit more that 1,100 silver contracts added to the November delivery month since First Notice Day back on Tuesday, September 29.

Despite gold's rally over the last two days, there was a second withdrawal from GLD over that same time period, as authorized participants removed a further 73,336 troy ounces of gold. There were also 7,912 troy ounces of gold withdrawn from GLDM. But there have now been two deposits into SLV over the last two days -- and on Friday, an a.p. added a further 722,395 troy ounces of silver.
The latest short report, for positions held at the close of business on Wednesday, September 30, showed up on The Wall Street Journal's website on Friday afternoon EDT -- and it showed a decline in the short position in SLV...from 30.12 million shares/troy ounces, down to 25.39 million shares/ troy ounces...a drop of 15.69%. This represents 4.65% of the total SLV shares outstanding...which remains a bit on the grotesque side.
Please remember that there isn't a single troy ounce of silver backing any of these shorted shares as the SLV prospectus requires -- and one can only fantasize about what the silver price might be if those entities that are short were required to buy the physical silver to back them...if that amount of silver is even available at its current price.
The short position in GLD also fell...from 12.20 million shares, down 896,000 shares...a drop of 26.57%. This amount represents 2.42% of the total GLD shares outstanding -- and is of no concern.
The SLV borrow rate showed no data points again on Friday. The GLD borrow rate opened at 0.26% -- and finished the day at 0.29%...with 8.3 million shares available.
In other gold and silver ETFs and mutual funds on Earth on Friday ...net of any changes in COMEX, GLD, GLDM and SLV activity, there were a net 31,154 troy ounces of gold taken out -- and a net 321,723 troy ounces of silver were withdrawn as well.

There was virtually no in/out activity in gold over at the COMEX-approved depositories on the U.S. east coast on Thursday. For the fifth day in a row there was nothing reported received -- and 2 kilobars/64.302 troy ounces departed Brink's, Inc. There was no paper activity, either -- and the link to this is here.
It was yet another very busy day in silver. There was one truckload/598,436 troy ounces received at CNT -- and there were 1,857,972 troy ounces shipped out. The largest 'out' amount were the 1,298,866 troy ounces that left JPMorgan. The next two biggest amounts were the 310,098 and 224,132 troy ounces that departed Brink's, Inc. and Asahi respectively. There was no paper activity in silver, either -- and the link to this is here.
The Shanghai Futures Exchange showed that a further 7.911 tonnes/ 254,346 troy ounces of silver were withdrawn on their Friday. This leaves their inventory level at 1,482.493 tonnes/47.664 million troy ounces.
Late last night, Nick Laird passed around the gold and silver withdrawals from the Shanghai Gold Exchange for September -- and the numbers showed that 92.083 tonnes/2.961 million troy ounces of gold were withdrawn ...along with 147.465 tonnes/4.741 million troy ounces of silver. I'll have the charts for you next week sometime.

Here are the 2-year weekly charts that show the total amounts of physical gold and silver held in all known depositories, ETFs and mutual funds as of the close of business on Friday. Click to enlarge.
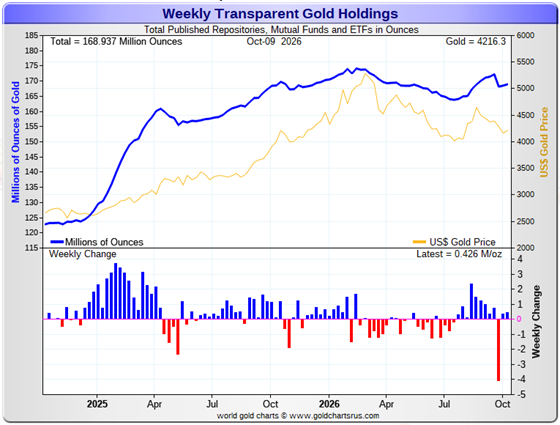
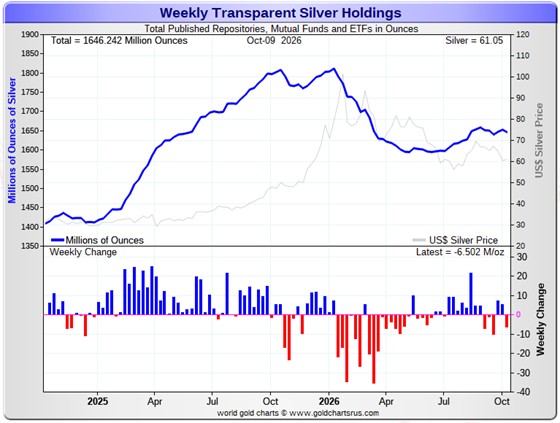
During the business week just past, there were a net 426,000 troy ounces of gold added -- but a net 6.502 million troy ounces of silver were withdrawn -- and almost all COMEX-related.
According to Nick Laird's data on his website, a net 2.741 million troy ounces of gold were removed from all the world's known depositories, mutual funds and ETFs during the last four weeks. The sole reason for the precipitous plunge was because of the 4.059 million troy ounces that went 'dark' at the COMEX that I reported on two weeks ago. That COMEX gold that went 'dark' is still there, but no longer being reported.
A net 2.369 million troy ounces of silver were also withdrawn during that same 4-week time period -- and that's all because of the huge net silver exports from the COMEX.
It should be noted that the amount of silver held in all these depositories, ETFs and mutual funds remains well below its old all-time high inventory level of late January 2026...which is no surprise.
The reason for the three prior 'down' weeks over the last six weeks on the silver chart above was because of big withdrawals from the COMEX and two of Sprott's ETFs.
Retail demand remains mostly comatose, but has picked up somewhat from what it's been for last few months.
As I keep pointing out, there are no 'out of stock' signs over at all the retail bullion stores that I follow. They have decent stocks in just about everything they normally carry. The buy/ sell spreads at most bullion stores remain a bit north of 10 percent -- and in the case of anything less than 0.999+ pure, it's far more than that. This obviously means that they have lots of stock -- and are not at all enthusiastic about buying anything. That was also reflected in the tiny sales amounts for September by the U.S. Mint that I reported on earlier this week.
COMEX silver withdrawals were monstrous earlier in the year...135 million in Q1/2026...23 million oz. in April -- but only 12.6 million oz. in May -- and only 5.3 million oz. in June. In July, COMEX warehouse stocks actually rose by a net 9.5 million oz. -- and in August, it was a net 5.0 million oz. added.
For the month of September, now in the history books, there were 19.457 million oz. of silver added to the COMEX -- and 23.502 million troy ounces were shipped out...a very busy month.
There has also been big demand for silver in the October delivery month so far...15.630 million troy ounces issued and stopped. But this is not really physical silver demand per se...as all that's happening is that silver already sitting on the COMEX has changed ownership.
However, that silver demand at the COMEX can only go on for so long, as a huge chunk of it is owned privately in the Eligible category -- and not for sale or delivery. Just how much silver is actually available for shipment on demand to the LBMA of elsewhere to meet any kind of emergency, is unknown...but it's most certainly finite.
We're supposedly deep into the sixth year of a structural deficit in silver according to the ongoing reports from The Silver Institute. However, subscriber John Macintosh thinks it's far more than they're reporting -- and threw another b.s. flag on their latest report in his latest essay headlined "The Silver Institute: A Wonderland of Compounded Errors" -- and linked here.
The vast majority of precious metals being held in these depositories are by those who won't be selling until the silver price is many multiples of what it is today...if ever.
Sprott's PSLV is the third largest depository of silver on Planet Earth with 207.2 million troy ounces...unchanged for the last four weeks -- and a great distance behind the COMEX, which has now been demoted to the second largest silver depository, where there are 331.8 million troy ounces being held...down a net 800,000 troy ounces this past week...but minus the 103 million troy ounces being held in trust for SLV by JPMorgan that Ted Butler found out about many years ago.
That 103 million ounce amount brings JPMorgan's actual silver warehouse stocks down to around the 24 million troy ounce mark...quite a bit different than the 132.7 million they indicate they have -- down 5.9 million troy ounces on the week -- and down 11.3 million ounces over the last five weeks. They've shipped out about 88 million troy ounces from their own depository so far this year.
But that number doesn't include the silver that JPMorgan owns and has stored at the other COMEX-approved depositories. They've shipped out lots of that over the months and years...especially this year so far -- and a lot of it out of CNT.
PSLV remains a very long way behind SLV as well -- still the largest silver depository...with 493.9 million troy ounces as of Friday's close...up about 500,000 troy ounces this past week.
The latest short report [for positions held at the close of business on Wednesday, September 30] showed that the short position in SLV fell by 15.69%...from the 30.12 million shares/troy ounces sold short in the prior report...down to 25.39 million shares/troy ounces in the latest short report that came out yesterday. This amount represents 4.65% of total SLV shares outstanding...still obscene, but not nearly as bad as it was earlier in the year. Don't forget that there's no physical silver backing any of these shorted shares as the SLV prospectus requires.
BlackRock issued a warning more than ten years ago now to all those short SLV, that there might come a time when there wouldn't be enough metal for them to cover. That would only be true if JPMorgan decided not to supply it to whatever entity requires it. Those that remain short SLV shares are in equally dire straits as the Big 8 shorts in silver in the COMEX futures market -- and I suspect that they're the same entities.
The next short report...for positions held at the close of trading on Thursday, October 15...will be posted on The Wall Street Journal's website on Monday, October 26.
Then there's that other little matter of the monster short position in silver held by Bank of America in the OTC market...with JPMorgan & Friends on the long side. Ted said it hadn't gone away. He wrote an article about this back in April 2021 headlined "A New Piece of the Puzzle" -- and linked here.
A while after that article came out, he also come to the conclusion that they're short around 25 million ounces of gold with these same parties as well. Once these short covering rallies in both silver and gold begin anew...we'll see if they need to get taken over, like Bear Stearns did back in 2008 -- and for the same reason. If that's the case, JPMorgan...their counterparty to these trades...will pick them up for next to nothing as well.
However, the Q1/2026 report from the OCC that came out at the end of June did cast some doubt on Ted's thesis -- although I'm not at all qualified to say that it's no longer valid. The latest OCC Report for Q2/2026 came out two weeks ago -- and didn't shed any new light on the BofA short situation in either precious metal.
What it showed was that the top four U.S. banks [by total derivatives] reduced their precious metals derivatives by $155.5 billion dollars/19.0% during Q2. JPMorgan reduced theirs by the most...$135.0 billion...where as Citigroup increased their precious metals derivatives position by an insignificant $5.1 billion.
The other two top banks by total derivatives...Goldman Sachs and Morgan Stanley ...hold vanishingly small derivatives positions in the precious metals -- and are NOT part of the Big 8 short cabal...except maybe in silver by a bit.
But the other two U.S. banks that are short massive amounts of precious metal derivatives...Bank of America and Wells Fargo Securities...don't hold total derivative positions large enough to be included in this report. But I'd bet my entire net worth that their p.m. short positions are grotesque -- and at least rival those of JPMorgan and Citibank.
Up until about ten or so years ago, this OCC derivatives report used to include the top dozen or so U.S. banks by total derivatives -- and BofA and Wells Fargo were visible. With only the top four U.S. banks now in plain sight...it's impossible to know what the short positions of these other two banks are -- but I'm sure that the list was shortened to hide them.

The Commitment of Traders Report, for positions held at close of COMEX trading on Tuesday, showed an increase in the Commercial net short position silver...but it was all because of Ted Butler's raptors selling long positions... which isn't an increase at all...more on that in a bit. There was a smallish decline in the commercial net short position in gold.
In silver, the Commercial net short position increased by 1,582 COMEX contracts...7.910 million troy ounces of paper silver.
They arrived at that number through the sale of 2,350 long contracts, but also bought back/covered 768 short contracts -- and it's the difference between those two numbers that represents their change for the reporting week.
Under the hood in the Disaggregated COT Report, the Managed Money traders decreased their net long position by a tiny 86 COMEX contracts -- and the Other Reportables and Nonreportable/small traders both increased their net long positions...the former by 1,156 contracts -- and the latter by 512 COMEX contracts.
Doing the math: 1,156 plus 512 minus 86 equals 1,582 COMEX contracts... the change in the Commercial net short position...which it must do.
The Commercial net short position in silver now sits at 41,592 COMEX contracts/207.960 million troy ounces of paper silver...up those 1,582 contracts from last Friday's COT Report.
The Big 4 collusive commercial traders increased their net short position, them by 474 COMEX contracts, up to 32,695 COMEX contracts...which is still only 2,875 contracts above their lowest short position on record.
The Big '5 through 8' decreased their net short position...them by 486 COMEX contracts...down to 14,929 contracts...and now only 2,233 contracts above their lowest short position I have records for.
The Big 8 commercial traders in total are net short 47,624 COMEX silver contracts...down 486-474=12 piddling COMEX contracts on the week. Nothing to see here folks, please move along.
The Big 8 short position fell by 12 contracts during the reporting week -- but the total Commercial short position actually rose by 1,582 COMEX contracts, which meant that Ted Butler's raptors, the 30 small commercial traders other than the Big 8, had to have been net sellers during the reporting week -- and they were...decreasing their net long position by 1,582+12=1,594 COMEX contracts. They remain net long silver by 6,032 COMEX contracts.
And as I explain every week in this spot, the sale of these long contracts by Ted's raptors has the mathematical effect of increasing the Commercial net short position by those 1,594 contracts...which isn't an increase at all. When these small commercial traders are net long like they are in silver, it's only what the Big 8 commercial shorts do that matters. It's been that way forever ...as the raptors very rarely go short silver...only a couple of times that I can remember in the last 20+ years.
But, having said all that, those 30 small commercial trader are netlong that amount...with the key word being net. It's guaranteed that a bunch of those 30 traders are also net short silver...but those that are net long, are net long 6,032 contracts more than those that are short. So some of that decrease of 1,594 contracts this past reporting week could have easily been the result of those traders that were short, going further short...rather than those that are long silver, selling long positions. However, considering what the Big 8 did during the reporting week, basically nothing -- and the size of that decrease, I suspect that it was mostly those net long that were selling.
Here's the 3-year COT chart for silver thanks to Nick Laird -- and updated with the above
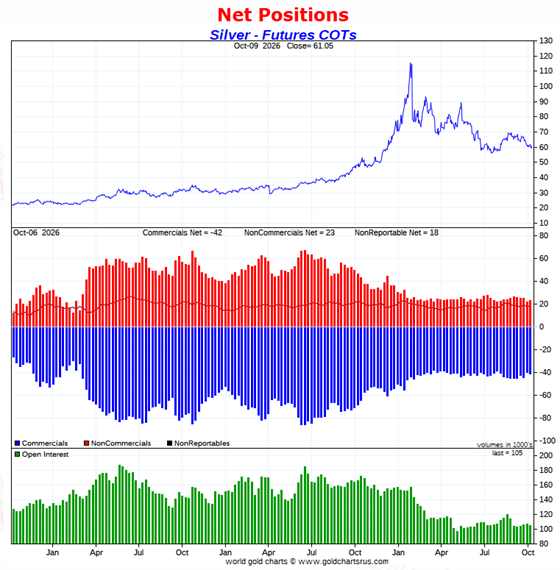
Although the headline number showed an increase of 1,582 COMEX contracts in the commercial net short position...it was all raptor selling that was responsible...which is only a mathematical increase. The Big 8 traders, the only ones that really matter, did nothing on a net basis during the reporting week...12 contracts worth. So the COT Report for silver was the big 'nothingburger' I expected.
As of this COT Report, the Big 8 are short 47,624 contracts, which is still a long way off of the 43,407 contracts they were short back on April 7. Of course I suspect that they were able to cover a decent chunk of that during their bear raids on Wednesday and Thursday.
The Big 8 commercial traders are net short 45.3 percent of total open interest in silver in the COMEX futures market...up a bit from the 44.5 percent they were net short in last Friday's COT Report. The sole reason for that increase was because of the 1,917 contract decline in total open interest, which obviously affects the percentage calculation.
And after those bear raids on Wednesday and Thursday, the set-up for a major rally in silver is back to being white-hot incandescent -- and whether the price action yesterday was the start of it or not...who knows.
All that stands in the way of a rather spectacular 3-digit silver price...as it's always been...are the Big 8 collusive commercial shorts. If they hadn't been at battle stations during this past reporting week...like they are every week now...we'd already be there.
In gold, the commercial net short position declined by 6,440 COMEX contracts...644,000 troy ounces of paper gold.
They arrived at that number through the sale of 3,029 long contracts, but also bought back/covered 9,469 short contracts -- and it's the difference between those two numbers that represents their change for the reporting week.
Under the hood in the Disaggregated COT Report, like they did in silver, the Managed Money traders also reduced their net long position, them by a very hefty 9,331 COMEX contracts. The traders in the Other Reportables and Nonreportable/small traders category both increased their net long positions ...the former by 1,034 COMEX contracts -- and the latter by 1,857 contracts.
Doing the math: 9,331 minus 1,034 minus 1,857 equals 6,440 COMEX contracts...the change in the commercial net short position.
The commercial net short position in gold now sits at 244,527 COMEX contracts/ 24.453 million troy ounces...down those 6,440 contracts in this reporting week. This is still a very big number.
The Big 4 commercial traders decreased their net short position by only 2,702 COMEX contracts, down to 150,125 contracts. This was disappointing. But the real disappointment, like it was last week, came in the next paragraph.
The Big '5 through 8' commercial traders also decreased their net short position...but only by a piddling 206 contracts, down to 70,111 COMEX contracts...still their largest short position since January 20...the week before 'da boyz' pulled the pin on gold's parabolic price rise.
The Big 8 commercial traders in total are net short 220,236 COMEX gold contracts...down only 2,702+206=2,908 contracts from last Friday's COT Report -- and remain net short a very hefty 58,338 contracts above their record low of 161,898 contracts that they were short back on May 26.
But since the commercial net short position fell by 6,440 COMEX contracts -- and the Big 8 decreased their net short position by only those 2,908 contracts ...that meant that Ted's raptors, the 36 small commercial traders other than the Big 8, had to have been net buyers during the reporting week -- and they were. They decreased their net short position by a further 6,440-2,908=3,532 COMEX contracts -- and are now net short gold by 'only' 24,291 COMEX contracts...which remains a grotesque amount.
And like they currently are in silver, these raptors would normally be net long gold by many thousands of contracts [if not tens of thousands of contracts] at this point in the price cycle -- and why they're not this time around, I have no idea...but suspect that they've been recruited into the trenches in the fight to prevent a massive rise in its price.
But if they weren't short this amount -- and net long those thousands [or tens of thousands] of contracts that they normally would be, it's a guarantee that gold would be many, many thousands of dollars higher in price than it is now.
I suspect that no more than two or three of these small commercial traders hold the vast majority of this short position...so it's the 'Big 10 or 11' -- and not just the 'Big 8' traders that are running the gold price management show.
Here's Nick's 3-year COT chart for gold -- and updated with the above data. Click to enlarge.
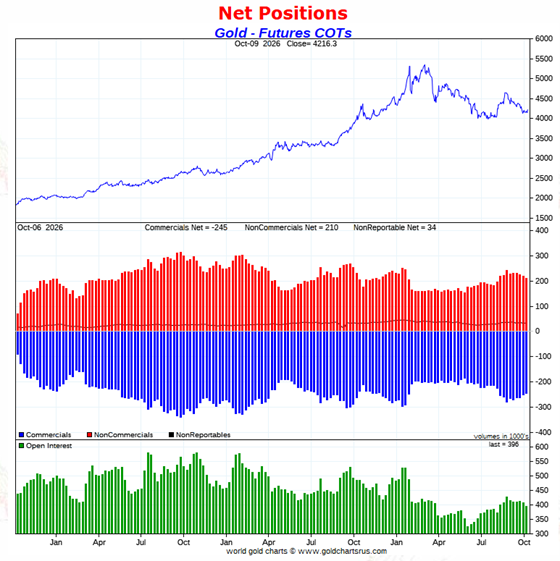
That 6,440 contract decrease in the commercial net short position in gold during the reporting week, pretty much falls into the 'nothingburger' category as well.
The standout in this report continues to be that despite this past week's improvement, the commercial traders in total are more net short gold now, than they were back the week before the crash at the end of January -- and that's despite the fact that gold is now $1,400+ cheaper than it was back then.
But as I've stated before -- and in The Wrap in last Saturday's column..."It's my opinion that the sole reason for [these extreme short positions] is that most of the new 'investors' that have plowed back onto the long side in the non-commercial and small trader categories since the crash at the end of January, are a different breed of cat and, for the most part, aren't weak hands."
The original weak hands all got flushed out in the first month or so after the tops in gold and silver were set...which has been the hallmark of all these 'wash, rinse & spin' cycles over the last 25-odd years. But this time, as they exited stage left, these news kids on the block immediately took their place. That's why the short positions of the commercial traders has remained extremely elevated since.
And as I also pointed out last Saturday, these new breeds of cats may in fact be 'friends' of the Big 8 shorts...specifically in place to cover the losses that the Big 8 are going to experience when both gold and silver are finally allowed to rip higher. It's the only thing that might save the too-big-to-fail bullion banks -- and the CME Group as well, perhaps.
The Big 8 are short 55.6 percent of total open interest in gold in the COMEX futures market...up a tiny amount from the 54.9% they were short in last week's report. That percentage increase only came about because of the 10,347 drop in total open interest, which obviously affects the percentage calculation.
However, unlike silver, the commercial net short position in gold is much larger than the Big 8 short position...because almost all of the rest of the collusive commercial traders, Ted Butler's raptors, are also net short gold. Adding them [36 traders] into the mix, which you have to do, puts the commercial net short position in gold at 61.7% of total open interest in the COMEX futures market ...exactly unchanged from last Friday's report.
Then, if you subtract out the uneconomic and market-neutral spread trades from total open interest, the commercial net short position in gold jumps up to a bit over 65% of total open interest...which remains grotesque beyond belief.
So, in the overall, this week's COT Report didn't move the needle on the short positions of the collusive commercial traders of whatever stripe in either silver or gold. And whether the bear raids by 'da boyz' on Wednesday and Thursday made much difference, may not be known even in next Friday's COT Report because of the ensuing price action on Friday.
However, having said that, all the COT data above on gold -- and especially in silver, is yesterday's news, as I stated it would be in Friday's column.
The set-ups for major rallies, silver in particular, are in place from a COMEX futures market perspective...but the collusive commercial traders of whatever stripe are showing few signs of loosening their grip on their respective prices.
In the other metals, the Managed Money traders in palladium increased their net short position by a whopping and further 1,423 COMEX contracts... the second biggest one-week move I can remember -- and are now net short palladium by 9,385 COMEX contracts. Why they're short this particular precious metal remains a mystery...but it was their adding of 3,100+ short contracts over the last two weeks that caused its price to crash to a new 1-year low.
The commercial traders in the Swap Dealers category are net long palladium by 5,606 contracts -- and the commercial traders in the Producer/Merchant category are now back on the net long side as well for the first time in months...but only by 182 COMEX contracts. The traders in the Other Reportables category are net long 2,368 contracts in this metal -- and the Nonreportable/ small trader categories are net long 1,229 COMEX contracts.
As I keep mentioning about these numbers, palladium is a very dinky market. Total open interest is only 21,060 COMEX contracts...up a further 2,458 contracts this past reporting week...still about the lowest it's been since sometime in 2022. Open interest in platinum is also about the lowest since that time as well.
The world's banks are net short an inconsequential 0.7 percent of total open interest in palladium in the COMEX futures market in the October Bank Participation Report, which came out yesterday...which is down big from the 7.5 percent that they were net short in September's Bank Participation Report.
This is a very strange and twisted market once you get a look into its internal structure -- and as I point out in every monthly Bank Participation Report, the only reason that there's a COMEX futures contract in palladium is so that its price can be managed.
In platinum the Managed Money traders didn't do much, increasing their net long position by a paltry 219 COMEX contracts during the reporting week -- and are net long platinum by 8,475 contracts. The traders in the Other Reportables and Nonreportable/ small trader category remain net long platinum by very respectable amounts as well. All of this, like it is in gold and silver, is a big "up yours" to the collusive commercial traders -- and why it's their No. 2 problem child after silver.
The commercial traders in the Producer/Merchant category in platinum are net short 9,484 COMEX contracts. The Swap Dealers are net short platinum by 8,302 COMEX contracts.
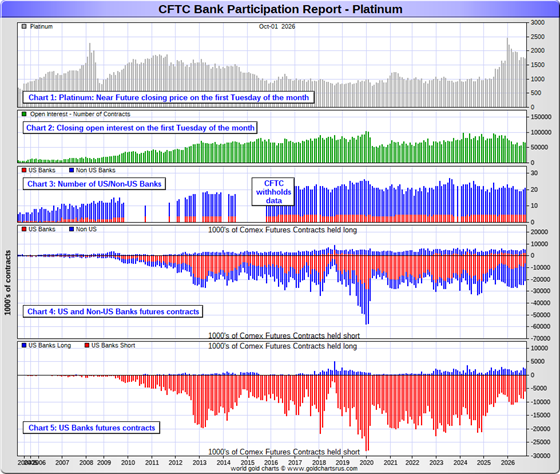
In October's Bank Participation Report, the world's banks...21 of them in total...were net short 19.0 percent of total open interest in platinum in the COMEX futures market...down a lot from the 28.1 percent they were short in September's.
In copper, the Managed Money traders decreased their net long position by a further and hefty 16,924 COMEX contracts during the past reporting week -- but remain net long copper by 61,134 contracts...1.528 billion pounds of the stuff. The traders in the Other Reportables and Nonreportable categories are net long copper by a bit as well.
Copper, like palladium, continues to be a wildly bifurcated market in the commercial category. The Producer/ Merchant category is net short a whopping 92,720 copper contracts/ 2.318 billion pounds -- while the Swap Dealers are net long 14,979 COMEX contracts/370 million pounds of the stuff. So it's the commercial traders in the Producer/Merchant category that remain short against every other group of traders...including the commercials in the Swap Dealer category.
Whether this dichotomy in copper means anything or not, will only be known in the fullness of time. Ted Butler said it didn't mean anything as far as he was concerned, as they're all commercial traders in the commercial category. But this bifurcation has been in place for as many years as I've been keeping records -- and that's a very long time....10+ years.
In this vital industrial commodity, the world's banks...both U.S. and foreign... are net short copper by 10.0% of total open interest in the October Bank Participation Report...up from the 8.4% they were short in the September BPR. As the copper price continues to rise...the banks continue to sell into its rally...either by selling long contracts, or going further short.
However, the very interesting thing about copper in the October BPR that came out yesterday, was that 5 U.S. banks are net long copper by 11,996 COMEX contracts...whereas 17 non-U.S. banks are net short copper by a very hefty 30,316 contracts.
At the moment it's mostly the commodity trading houses such as Glencore and Trafigura et al., along with some hedge funds, that are mega net short copper in the Producer/Merchant category, as the Swap Dealers are net long, as pointed out above.
The next Bank Participation Report for October's activity is scheduled to be out on Friday, November 6.

Here’s Nick Laird’s “Days to Cover” chart, updated with the COT data for positions held at the close of COMEX trading on Tuesday, October 6. It shows the days of world production that it would take to cover the short positions of the Big 4 — and Big '5 through 8' traders in every physically traded commodity on the COMEX. This chart is a graphical representation of what's shown in the COT Report above. Click to enlarge.
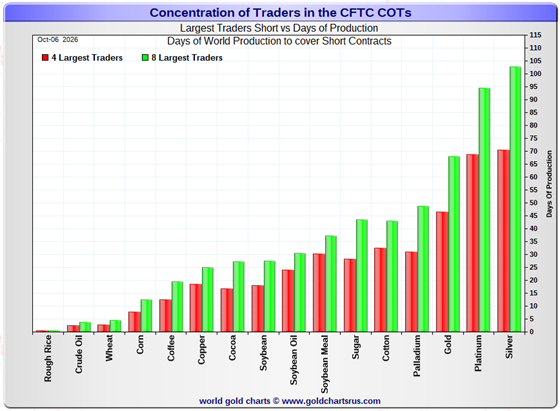
In this week's data, the Big 4 traders are short about 70 days of world silver production...up about 1 day from last Friday's COT report. The ‘5 through 8’ large traders are short an additional 33 days of world silver production...down about 1 day from the last report...for a total of 103 days that the Big 8 are short -- and obviously obviously unchanged from last Friday's report, which is no surprise since the short position of the Big 8 only changed by 12 contracts.
Those 103 days that the Big 8 traders are currently short, represents about 3.4 months of world silver production, or 238.120 million troy ounces/47,624 COMEX contracts. That's down from the 243.180 million troy ounces/48,636 contracts in last Friday's COT Report...a difference of 12 contracts/60,000 ounces on the week.
In gold, the Big 4 are short about 46 days of world gold production...down about 1 day from last Friday -- and the Big '5 through 8' are short an additional 22 days of world production...unchanged from last Friday's COT Report...for a total of 68 days of world gold production held short by the Big 8 commercial traders -- and obviously down 1 day from last Friday's report.
In silver, I believe that a goodly chunk of the gross short position in the Big 4 commercial category is mostly held by only two traders...both of them U.S. banks ...Wells Fargo and BofA I suspect.
In June's Bank Participation Report, 5 U.S. bullion banks held a gross short position of 12,884 COMEX silver contracts...down a whole bunch from May. But July's BPR showed that these same five U.S. banks increased their gross short position back up to 16,128 contracts...an increase of 3,244 COMEX contracts. In the August Bank Participation Report showed that the gross short position of the five U.S. banks was back down to 13,511 COMEX contracts... September's was back up to 15,819. October's, that came out yesterday, showed that the Big 5 U.S. bullion banks were gross short 15,472 COMEX contracts.
This chart is also a graphical representation of why I consider platinum to be 'da boyz' No. 2 problem child after silver -- and it continues to be a big problem child.
The short position in SLV now sits at 25.39 million shares/troy ounces as of the latest short report that came out yesterday afternoon...for positions held at the close of trading on Wednesday, September 30. This represents a decrease of 15.69% from the prior report -- and 4.65% of total SLV shares outstanding. This is not as off-the-charts grotesque and obscene as it once used to be -- but realistically should be around a fifth of that amount.
Please remember that there's not a single solitary troy ounce of silver backing any of these shorted shares as the SLV prospectus requires...which begs the question of what the silver price might be if those short SLV shares had to buy enough physical silver to back them.
The next short report...for positions held at the close of business on Thursday, October 15...is due out on Monday, October 26.
As Ted Butler pointed out quite often over the years, the resolution of the Big 4/8 short positions will be the sole determinant of precious metal prices going forward...although that short position in gold held by his raptors continues to be another huge negative factor...which decreased a bit further during this past reporting week. However, under normal circumstances, it wouldn't be there at all...it would be a big long position.
And as he also pointed out over the years, there would come a time when what the numbers show in the COT Report won't matter, as events in the real world...whatever they may be...will overtake them. That hasn't happened yet...but that day is most certainly coming at some point.
All that we await, is the denouement that follows. The big bear raids we've endured over the last many months, weeks and again this past week...are all part and parcel of the process to keep their respective prices in line until that moment arrives. And whether these budding rallies that began on Thursday, is the start of it or not, remains to be seen.

The October Bank Participation Report [BPR] data is extracted directly from the above Commitment of Traders Report. It shows the number of futures contracts, both long and short, that are held by all the U.S. and non-U.S. banks as of the Tuesday, October 6 cut-off in all COMEX-traded products.
For this one day a month we get to see what the world’s banks have been up to in the precious metals -- and they're usually up to quite a bit.
[The October Bank Participation Report covers the five-week time period from September 1 to October 6 inclusive]
In gold, 5 U.S. banks are net short 99,665 COMEX contracts, down 7,021 contracts from the 103,686 they were short in the September report. I was expecting far more.
Also in gold, 21 non-U.S. banks are net short 95,350 COMEX contracts, down 3,898 contracts from the 99,248 contracts that 22 non-U.S. banks were net short in September's BPR. I was expecting a lot more here too.
At the low back in the August 2018 BPR...these non-U.S. banks held a net short position in gold of only 1,960 contacts -- so they've been back on the short side in a gargantuan way ever since. Only a handful of these bullion banks hold meaningful short positions in gold. The short positions of the rest are of no consequence -- and never have been.
Although almost all of the largest U.S. and foreign bullion banks are in the Big 10-11 short category in gold, the odd hedge fund/commodity trading house are net short large amounts of gold in that category as well. There's also the possibility that the BIS could be short gold in the COMEX futures market.
As of October's Bank Participation Report, 26 banks [both U.S. and foreign] were net short 48.4 percent of the entire open interest in gold in the COMEX futures market...down a tad from the 48.9 percent that 27 banks were net short in the September BPR.
In yesterday's COT Report, the commercial net short position in gold was 61.7 percent of total open interest -- and if you subtract out the 48.4 percent held short by the banks...only 61.7-48.4=13.3 percentage points of the commercial net short position in gold is not held by the bullion banks. How's that for a concentrated and manipulative short position?
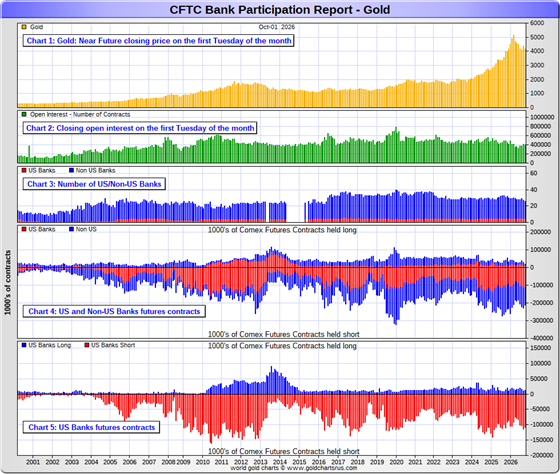
Here’s Nick’s BPR chart for gold going back to 2000. Charts #4 and #5 are the key ones here. Note the blow-out in the short positions of the non-U.S. banks [the blue bars in chart #4] when Scotiabank’s COMEX short position was outed by the CFTC in October of 2012.
The four charts in this Bank Participation Report are dated 01 October. But the data is for the October 6. Nick forgot to change the dates. Click to enlarge.
In silver, 5 U.S. banks are net short 8,417 COMEX contracts...up a further 1,175 contracts from the 7,242 contracts they were net short in the September BPR...a number that I was not at all happy to see, a I was expecting a decrease based on the price action last month. It's still ultra low, but 7,644 contracts above their record low of December of last year, when they were net short only 773 COMEX contracts.
But the number I really wanted to see was the change in their gross short position. In the June BPR, that number was down to 12,884 contracts which was, without doubt, their lowest gross short position in silver, ever. July's BPR showed that it had jumped back up to 16,128 COMEX contracts...which I wasn't happy to see. In August's BPR, the gross short position held by these five banks was back down to 13,511 COMEX contracts...but in September's, it was up to 15,819 contracts. October's was 15,472 COMEX contracts.
These same 5 U.S. banks hold a gross long position of 7,055 contracts... down from the 8,577 COMEX contracts they were gross long in the September BPR -- and it's a given that they're not divided up equally between them. I figure that the two U.S. banks that hold the biggest short positions in silver, don't hold much of a long position in it.
The five U.S. banks that are net short silver would be Citigroup, Wells Fargo, Bank of America, Goldman Sachs -- and Morgan Stanley...with by far the lion's share held by no more than two of these banks...most likely BofA and Wells Fargo...although I have my suspicions about JPMorgan from time to time.
Also in silver, 15 non-U.S. banks are net short 27,225 COMEX contracts, down 993 contracts from the 28,218 contracts that 16 non-U.S. banks were net short in the September BPR. I wasn't pleased with this number, either.
It's a given, based on silver deliveries in 2025 -- and so far in 2026...that HSBC, Barclays, Standard Chartered, BNP Paribas, Deutsche Bank and Macquarie Futures hold by far the lion's share of the short positions of these non-U.S. banks. Canada's Bank of Montreal is a card-carrying member of this group as well.
And, like in gold, the BIS could also be actively shorting silver. However, the remaining short positions in silver, divided up between the remaining 10 or so non-U.S. banks, are immaterial — and have always been so....the same as most of the 21 non-U.S. banks in gold as well.
As of October's Bank Participation Report, 20 banks [both U.S. and foreign] were net short 33.9 percent of the entire open interest in silver in the COMEX futures market — exactly unchanged from what 21 banks were net short in the September BPR.
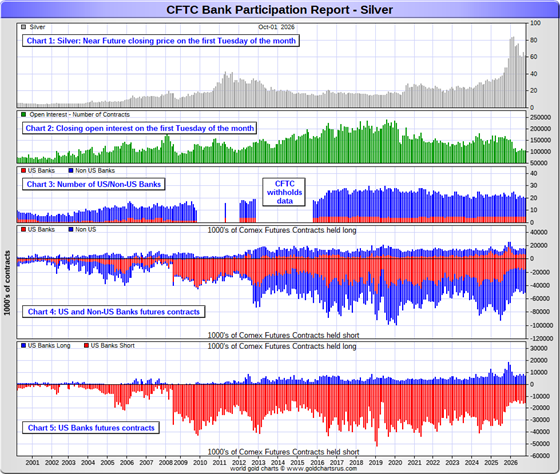
Here’s the BPR chart for silver. Note in Chart #4 the blow-out in the non-U.S. bank short position [blue bars] in October of 2012 when Scotiabank was brought in from the cold. Also note August 2008 when JPMorgan took over the silver short position of Bear Stearns—the red bars. It’s very noticeable in Chart #4—and really stands out like the proverbial sore thumb it is in chart #5. Click to enlarge.
In platinum, 5 U.S. banks are net short 3,467 COMEX contracts in the October BPR, down a very hefty 2,544 contracts from the 6,011 contracts that these same 5 U.S. banks were short in the September BPR.
At the 'low' back in September of 2018, these U.S. banks were actually net long the platinum market by 2,573 contracts...so they still have more work to do to get back to market neutral.
Also in platinum, 16 non-U.S. banks decreased their net short position by a tiny 648 contracts... from 13,129 contracts held by 15 non-U.S. banks in September's BPR...down to 12,481 contracts in October's BPR. This is 5.11x the amount they held short at their low in the May/25 BPR, so they've gone back on the short side in platinum by a huge amount since then -- and have barely budged since.
Back in the December 2023 BPR, these non-U.S. banks were net short a microscopic 35 platinum contracts...so they have yeoman work to do if they ever want to get back to even close to that number. I doubt that they'll ever accomplish that, without driving its price to the moon -- and are permanently stuck with this short position.
As you know, platinum remains the big commercial shorts No. 2 problem child after silver -- and there's now a long-term structural deficit in it [and palladium] as well.
As of October's Bank Participation Report, 21 banks [both U.S. and foreign] were net short 24.2 percent of platinum's total open interest in the COMEX futures market, down from the 28.1 percent that 20 banks were net short in September's BPR.
Here's the Bank Participation Report chart for platinum. Click to enlarge.
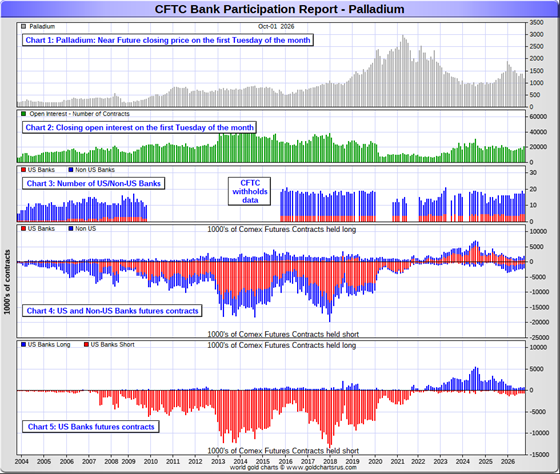
In palladium, 5 U.S. banks are now net long 97 COMEX contracts in the October BPR. In September's BPR, they were net short palladium by 58 contracts.
Also in palladium, 12 non-U.S. banks are net short only 245 COMEX contracts ...a decrease of 935 contracts from the 1,180 contracts that 14 non-U.S. banks were net short in the September BPR.
Of course, none of this mean anything considering how tiny these amounts are...especially when divided up between 17 banks.
And as I've been commenting on for almost forever, the COMEX futures market in palladium is a market in name only, because it's so illiquid and thinly-traded. Its total open interest in yesterday's COT Report was only 21,060 contracts...compared to 65,868 contracts of total open interest in platinum...105,130 contracts in silver -- and 396,109 COMEX contracts in gold.
Total open interest in palladium has increased quite a bit over the last ten or so years, because I remember when it was less than 9,000 contracts on average. So it's nowhere near as illiquid as it used to be -- and it's also been helped along by the fact that the bid/ask is now down to only 40 bucks. It used to be $150 at one point way back when.
As I say in this spot every month, the only reason that there's a futures market at all in palladium, is so that the Big 8 commercial traders can control its price. That's all there is, there ain't no more.
As of this Bank Participation Report, 17 banks [both U.S. and foreign] are net short 0.7 percent of total open interest in palladium in the COMEX futures market...down from the 7.5 percent of total open interest that 19 banks were net short in the September BPR. These are meaningless numbers.
For the last 6+ years, the world's banks have not been involved in the palladium market in a material way...see its chart below. With all the world's banks basically market neutral from a COMEX futures market perspective...it's only the Managed Money traders that are net short now....for whatever reason.
The Big 8 shorts in palladium, none of which are bullion banks, are net short 40.2 percent of total open interest in palladium as of yesterday's COT Report...down from the 44.2 percent of total open interest they were short a month ago.
Here’s the palladium BPR chart -- and it remains to be seen if 'da boyz' return as big short sellers again at some point like they've done in the past. Click to enlarge.
Excluding palladium for obvious reasons, most likely no more than a dozen or so banks in total -- and mostly U.S. and U.K.-based...along with French bank BNP Paribas and Deutsche Bank...continue to hold meaningful short positions in the other three precious metals...although I won't let Canada's Bank of Montreal or Australia's Macquarie Futures off the hook just yet.
As I pointed out above, some of the world's commodity trading houses and hedge funds are also net short the four precious metals. They have the ability to affect prices if they choose to exercise it. But it's still the collusive Anglo/ American/Western bullion bank cartel in the commercial category that are at Ground Zero of the price management scheme in the COMEX futures market. They are -- and remain, the not-for-profit/short sellers of last resort...until further notice.
And as has been the case for several decades now, the short positions held by the Big 4/8 traders is the only thing that matters...especially the short positions of the Big 4...or maybe only the Big 1 or 2 in silver. How this is ultimately resolved [as Ted kept pointing out] will be the sole determinant of precious metal prices going forward.
Considering the current state of affairs of the world as they stand today -- and the structural deficit in silver -- and now in platinum and palladium as well, the chance that these big bullion banks and commodity trading houses could get overrun at some point, is no longer zero -- and certainly within the realm of possibility if things go totally non-linear somewhere. The chances of that happening are multiplying with each passing day.
But...as Ted kept reminding us...if they do finally get overrun, it will be for the very first time. And it was patently obvious that the collusive commercial traders of whatever stripe had to step in multiple times this year so far... including this past week...in order to prevent exactly that from happening. If they hadn't, Ted Butler's "Bonfire of the Silver Shorts" would have become a reality within days...if not hours.
The next Bank Participation Report for trading in October is due out on Friday, November 6.

CRITICAL READS
Ray Dalio warns the stock market’s cushion against rising bond yields is shrinking
Billionaire investor Ray Dalio warned on Thursday that stocks face mounting pressure from rising bond yields and the prospect of weaker corporate cash flows, even as earnings continue to grow.
The Bridgewater Associates founder told CNBC equities have so far weathered the global bond sell-off because earnings growth has kept expected stock returns attractive, relative to bonds. But that advantage will narrow, he said, potentially leaving equities more vulnerable as financial conditions tighten.
“We’re in the part of the cycle where interest rates can rise without sending the equity market down because there’s enough earnings growth and there’s enough expected return,” Dalio told CNBC’s Sri Jegarajah at the Milken Institute Asia Summit in Singapore on Thursday.
“But when that cushion comes down, then you’re coming later into that cycle. So that’s where we are.”
His warning comes as U.S. Treasury yields hover near multi-decade highs. Investors are grappling with large government deficits, persistent inflation and rising borrowing tied to artificial intelligence investment.
This article was posted on the CNBC Internet site at 7:04 a.m. on Thursday morning EDT -- and comes to us courtesy of Swedish reader Patrik Ekdahl. Another link to it is here.
Americans’ debt problems are flashing a warning not seen since the Great Recession
The ability of U.S. families to stay current on their debts worsened over the past three years, hitting levels not seen since the aftermath of the global financial crisis, the Federal Reserve reported Friday.
In the central bank’s Survey of Consumer Finances, researchers found that while wealth disparities narrowed somewhat, the ability to meet debt payments deteriorated significantly.
“Families were more likely to be behind on their financial obligations than at any point since the 2010 survey,” stated the survey, a data-rich document the Fed releases every three years to chronicle the nation’s financial health.
The country in 2010 was just emerging from what became known as the Great Recession, a period that ran from December 2007 to June 2009. A collapse in the subprime mortgage market resulted in contagion across the largest financial institutions in the U.S. and the world, sending unemployment at one point to 10%.
According to the new findings, the portion of families behind on loan payments at the end of 2025 soared from about 12% in the prior survey to nearly 20%, a gain of some 67%. Those behind by two months or more also accelerated considerably, moving to more than 8% from 5% in 2022.
No surprises here -- and this will accelerate with higher interest rates. This CNBC story from 10:03 a.m. EST on Friday was updated about five hours later. I thank Swedish reader Patrik Ekdahl for this one as well -- and another link to it is here.
El-Erian and FT start to notice repeated market interventions by the U.S. Treasury
For much of the past year, both the real economy and financial markets have operated under the expanding shadow of US economic statecraft.
This has ranged from more aggressive industrial policy to tariff escalation and export restrictions as well as expanding moral suasion. As a result, resource allocation and price discovery in markets have increasingly drifted from commercial and economic logic, influenced more by geopolitics, national security and domestic political expediency.
One of the most striking features of this geoeconomic era is the U.S. Treasury department's growing willingness to intervene directly in financial market pricing. One such intervention, aimed at stabilising the Argentine peso, achieved its objective. A second, intended to suppress long-term Treasury yields and damp bond market volatility, has stumbled. The jury is out on a third initiative to bolster the Japanese yen.
Taken together, these three examples provide critical lessons on when unconventional direct market intervention can succeed — and importantly when the credibility of this tool can be eroded.
When asked in an Axios interview about the interventions, Bessent declared: "The house doesn't win every hand. The house plays percentages." This referenced his earlier claim -- "I am the house now" -- evoking the casino saying that the house always comes out ahead. Viewing sovereign market interventions through the lens of a casino operator risks misdiagnosing the factors at play. The power of policymaker interventions in pricing depends largely on market size and the state of the underlying fundamentals.
Market intervention is meant to be a "circuit breaker" to interrupt non-fundamental, self-reinforcing market dynamics or severe liquidity stress. When deployed sparingly during genuine dislocations, it carries immense signal value and potency. But when used repeatedly to try to counter underlying market fundamentals, achieve short-term political objectives, or manage prices in deep, liquid global asset classes, its effectiveness can diminish. Using it as a routine policy lever rather than an emergency safety valve risks turning a market stabiliser into a source of moral hazard and deeper volatility.
This commentary showed up on the ft.com Internet site on Thursday -- and is posted in the clear in this GATA dispatch from Friday. Another link to it is here.
Trillion-dollar hedge fund borrowing boom drives Wall Street prime brokerage profits
The rapid expansion of hedge fund borrowing has become a major source of revenue for Wall Street banks, as firms including Citadel, Millennium Management, and Point72 increasingly rely on lenders to finance their trading strategies, according to a report by the Financial Times.
Hedge fund borrowing from banks has tripled since 2020, helping turn prime brokerage into one of the fastest-growing areas of the banking industry. Revenues from equity and fixed-income prime brokerage are expected to reach $47.9bn this year, according to Coalition Greenwich.
The growth reflects a major shift in the financial system since the 2008 crisis. Regulations introduced after the financial crisis restricted banks from taking large speculative positions on their own balance sheets, pushing much of the risk-taking into hedge funds and specialist trading firms.
At the same time, market making has increasingly moved towards firms such as Jane Street and Citadel. While banks have ceded ground in some areas of trading, they have retained a critical role by providing the financing, securities lending and other services required by these increasingly powerful non-bank market participants.
The attraction for banks is the recurring nature of prime brokerage revenues. Servicing a major hedge fund or proprietary trading firm can generate as much as $200m a year after trading costs, according to banking executives.
Prime services are expected to account for about 38% of banks’ equities revenues this year, compared with 10% in 2005, according to Coalition Greenwich. The figures exclude the substantial derivatives business provided by banks to hedge funds and other trading firms.
This interesting commentary put in an appearance on the hedgeweek.com Internet site on Thursday morning -- and I found it in the Friday edition of the King Report. Another link to it is here.
Not Idiosyncratic, but Systemic -- Doug Noland
Twenty-five days until midterms. No reason to expect normal. The AI Bubble/ arms race survived another week. “Big Tech Rally Extends Into Fourth Week at AI Bubble Fears Fade.” Meanwhile… “AI Borrowing Spree Hammers Tech Debt in Rush to Reprice Risk.” Another Nasdaq100 record close. Lingering equity enthusiasm only underscores the importance of closely monitoring waning market confidence in AI-related debt.
Axios co-founder Mike Allen (October 3, 2026): “The Financial Times, probably your favorite paper, said ‘Bessent fails to break fever in U.S. bond market.’ What did you learn from that?”
Treasury Secretary Scott Bessent: “Well, I learned that the Financial Times is anti-American, anti-business. And they have a fever – they’re constantly trying to create a problem for the U.S. Let’s leave that disgraced publication in London aside…”
Allen: “So it’s fair to say it’s no longer your favorite paper?”
But I have a sneaking suspicion that Mr. Bessent never was without his Financial Times paper during peak mortgage financial Bubble excess. The FT’s Gillian Tett has a place in history for her phenomenal reporting on U.S. Credit derivatives, structured finance, and Wall Street excess. While the U.S. media was generally asleep at the wheel, the talented team at the Financial Times burnt the midnight oil reporting on developments leading up to the financial crisis. “Excellent journalists,” indeed. From the previous Bubble period, the names John Authers, Henny Sender, Paul Davies, Michael Mackenzie, Aline van Duyn, Saskia Scholtes, Krishna Guha, Francesco Guerrera, Brooke Masters and others remain worthy of recognition.
The FT was certainly not an enemy of the American people then - and it is not today. Our nation faces a terrible debt problem, while our Treasury Secretary keeps saying dumb things. The FT tradition of deep investigative journalism continues, as their journalists distinguish themselves in reporting on U.S. markets and finance, including recent focus on hedge fund leverage, the repo market, AI debt issues, debt sustainability, the Federal Reserve, US politics, the Iran War, and increasingly fraught geopolitics.
Just this week: “Hedge Funds as Systemic Risk,” “How a Trillion-Dollar Hedge Fund Borrowing Spree Became Wall Street’s Cash Cow,” “Investors Look to Shelter Portfolios From Rising AI Concentration Risks,” “OpenAI Annualised Revenues $20bn Less Than Previously Signalled,” “Insurance Claims to Test Altman and Amodei Liability for ‘Rogue’ AI,” “Wall Street Banks Launch Record $60bn Chip Deal for Broadcom and Anthropic,” “Crowding Out Pits Sovereigns Against AI,” “Surge in Borrowing Costs Hits Corporate America,” “How U.S. Mortgage Bonds Can Trigger a ‘Vicious Loop’ for Treasury Yields,” “Debt in the Spotlight as Paramount Closes $111bn Deal for Warner Bros,” and “Russia’s New Drive to Crush Ukraine” – just to name a few. The finest financial journalism, bar none.
But I digress. A little fact checking doesn’t hurt. Since inauguration day (1/20/25), U.S. 10-year yields have increased 61 bps. Canada yields are up 60 bps, Mexico 39 bps, Peru 42 bps, and Chile 36 bps. Yields over this period were down in Colombia (24bps), Brazil (39 bps), and Panama (113bps). Yields rose 19 bps in Switzerland, 40 bps in New Zealand, and a single basis point in China.
Sovereign debt problems are these days systemic rather than idiosyncratic. And, importantly, the U.S. is the epicenter of global government debt.
Moreover, the U.S. is at the epicenter of a historic international corporate debt boom. Perhaps most pressing, the U.S. is today the epicenter of the global AI Bubble and arms race. The world will surely yearn for the days of “idiosyncratic.”
It has become a deeply systemic issue: Deleveraging and the AI Bubble are irreconcilable. This is a serious dilemma for the S&P500 and equity index universe, for bond indices and ETFs, for Wall Street structured finance, for bank loan portfolios, and for the U.S. and global economies. Bond markets are sending a signal that deserves to be taken seriously.
This longish but very worthwhile commentary from Doug was posted on his Internet site around midnight on Friday -- and another link to it is here.
Five very worthwhile video interviews
1. Russia destroys Bridges and will take Kiev -- Colonel Douglas Macgregor
This 43-minute video interview with the colonel was hosted by Professor Glenn Diesen on Thursday sometime -- and it's definitely worth watching if you have the interest. I found it all by myself -- and the link to it is here.
2. Saudi Arabia Confirms Major Attack on Riyadh Airport -- Ambassador Chas Freeman
This 60-minute video interview with former U.S. Ambassador Freeman was hosted by Nima Alkhorshid on Friday morning EDT -- and is also definitely worth your time if you have the interest. This one comes courtesy of Guido Tricot -- and the link to it is here.
3. Riyadh's Airport Burns, Tankers Next -- Alastair Crooke
This excellent 65-minute video interview with former British diplomat and form MI6 officer Crooke was hosted by Lt. Colonel Daniel Davis It was posted on the youtube.com Internet site on Friday morning EDT -- and I thank Guido for this one as well. The link to it is here.
4. Russia Has Already Defeated NATO and Ukraine -- Scott Ritter
This very informative and interesting 36-minute video interview with former U.S. Marine intelligence officer and former U.N. weapons inspector was hosted by Judge Andrew Napolitano on Friday afternoon EDT. I thank Guido for this one as well -- and the link to it is here.
5. INTEL Roundtable : Weekly Wrap : 09 October
This interesting 29-minute video interview with former CIA intelligence officer Johnson -- and the above-mentioned Scott Ritter was hosted by the Judge very late on Friday afternoon -- and it comes to us courtesy of Guido as well. The link to this one is here.
Gold powerhouse Ghana seeks entry to Russia-China-backed BRICS bloc
Ghana has announced plans to formally apply for membership of BRICS, seeking India's backing as the West African gold powerhouse looks to deepen ties with an expanding bloc led by emerging-market powers including Russia and China.
Ghana's foreign affairs minister, Samuel Okudzeto Ablakwa, announced the decision Tuesday during a joint press briefing with visiting Indian External Affairs Minister S. Jaishankar.
He said Ghana had already sought India's support for its application, describing BRICS membership as a way to diversify the country's economic and diplomatic partnerships.
This news item showed up on the africa.businessinsider.com Internet site on Thursday -- and I found it in a GATA dispatch on Friday, but too late to make it into yesterday's column...so here it is now. Another link to it is here.
Oil is now driving gold higher -- Alasdair Macleod
There’s a growing correlation between oil and gold. Higher oil leads to higher bond yields, destabilising the dollar’s value. The debasement trade is back on.
“This is little doubt that the dollar’s purchasing power and credibility will be severely undermined, and that gold will therefore run higher with a significantly higher oil price. This change in sentiment could be sudden and dramatic.”
Paper bulls of gold and silver may be down in the dumps, but there’s a quiet evolution in progress. And this is now evident in the relationship between gold and oil over the last three months:
After oil’s peak last April, the price started a bottoming process in July, as did gold. Both then rose, not entirely synchronised, but roughly together with gold achieving its high point at end-August and oil three weeks later before both declined to recent lows in the last week.
This action questions the macro view which argues that higher oil prices lead to higher inflation and therefore interest rates, raising the cost of holding gold. But on examination this argument doesn’t hold water.
Why is this?
This very interesting commentary by Alasdair appeared on the goldmoney.com Internet site on Friday -- and is something that I found in a GATA dispatch. Another link to it is here.
Valcambi to open new gold plant in Hong Kong
Swiss precious metals refiner Valcambi has signed a letter of intent (LOI) with Hong Kong sole steelmaker, Shiu Wing Steel to establish a new precious metals refining company and vaulting facility in Hong Kong, Bloomberg reports.
The plant, located within Shiu Wing Steel’s existing site in northwest Hong Kong, marks Valcambi’s first refinery outside Switzerland.
Valcambi CEO Simone Knobloch says Asia remains a vital market for the industry.
“Asia is a key market for the precious metals industry and will continue to play an increasingly important role in its future,” Knobloch says.
The agreement comes as Hong Kong works to expand its bullion sector and position itself alongside Singapore as Asia’s premier gold trading center.
Hong Kong Secretary for Financial Services and the Treasury Bureau Christopher Hui pitched plans to expand the city’s gold footprint during the London Bullion Market Association’s conference in Sorrento, Italy, after touring Valcambi’s Swiss facility and those of refiners MKS PAMP and Argor-Heraeus.
This gold-related news item appeared on the mining.com.au Internet site on Friday -- and I found it on Sharps Pixley. Another link to it is here.

QUOTE of the DAY

The WRAP
"Understand this. Things are now in motion that cannot be undone." -- Gandalf the White
I was shocked to see that today's pop 'blast from the past' is 50 years old this year. It's an instantly recognizable classic...as is the band that performs it. But what is even more miraculous is how this song -- and the album from which it was plucked...came to being.
The genius behind it was Tom Scholz -- and this 5:44 minute video clip from WCVB TV in Boston only hints at the mastermind that created it. If you want the complete skinny on this smash hit...here's recording sound engineer and record producer Rick Beato laying it all out...instrument by instrument. This video has had almost 6 million views -- and is linked here.
The tune, with no frills, is linked here. Of course there's a bass cover to this -- and infusion26 lays it down just right -- and that's linked here.
Today's classical 'blast from the past' is somewhat more ancient. I've feature it before, but it's been a very long time...so time for a revisit. It's Edvard Grieg's Piano Concerto in A minor, Op. 16...which he composed in 1868 at the tender age of 24 years.
Grieg revised the work at least seven times, usually in subtle ways, but the revisions amounted to over 300 differences from the original orchestration. The final version of the concerto was completed only a few weeks before Grieg's death, and it is this version that has achieved worldwide popularity.
And it's as popular now as it was back then. Here's German-born child prodigy Alice Sara Ott and the Bavarian Radio Symphony Orchestra under the direction of Maestro Esa-Pekka Salonen. It's a live recording from 2015 -- and the link is here.
I made careful note of the fact that gold was hauled lower once it broke above $4,200 spot -- and silver once it breached $61 spot. Both were closed below that mark by the time trading had ended in New York on Friday.
As has been the case lately, the collusive commercial traders had a very easy time of it once again, as volumes in both these metals was exceedingly light...silver in particular. But despite Friday's gains, both these precious metals remain a long way below any moving averages that matter -- and a long way above being oversold on their respective RSI traces...if that means anything this time around.
The changes in total open interest in both gold and silver were inconsequential ...down 496 contracts in gold -- and 836 in silver. That's not a lot considering their big rallies. For that reason, it's possible that there could have been some short covering going on during those rallies -- and that fact is what was driving them.
Platinum's decent rally brought it a lot closer to its 50-day moving averages. But palladium's rally barely moved the needle on how far it is below its 50-day moving average. And, like silver and gold, both were closed well off their respective high ticks.
Don't forget that 'da boyz' are in total control of the rallies in the precious metals...just as they are during those downside 'wash, rinse & spin' cycles.
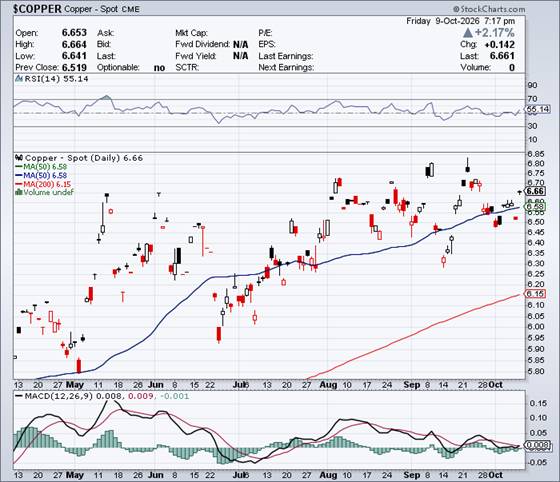
Copper ripped higher by 14.2 cents on Friday...closing back above its 50-day moving average by 8 cents at $6.661/pound.
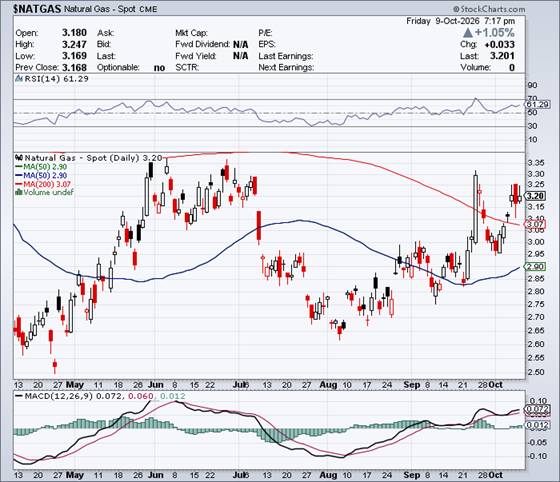
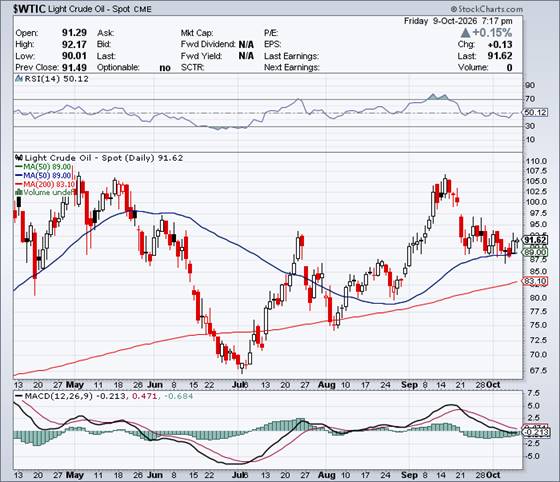
Natural gas [chart included] gained back part of Thursday's 'loss'...as it was allowed to close higher by 3.3 cents at $3.20/1,000 cubic feet -- and 4.7 cents off its intraday high tick. WTIC closed up 13 cents at $91.62/barrel.
Here are the 6-month charts for the Big 6+1 commodities for Friday and, once again, the silver candle doesn't show its entire intraday price move. Click to enlarge.
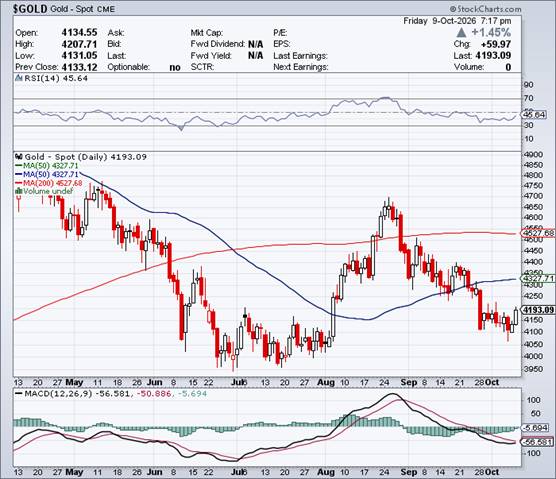
So...are we done to the downside for this iteration of the 'wash, rinse & spin' cycle?
The short answer is: I don't know -- and so is the long answer.
As I hinted at above the 6-month charts, in the past all four precious metals would have to be deep into oversold territory on their respective RSI traces before one could call the coast clear. So far, 'da boyz' have only managed that feat with palladium. They haven't even come close with the other three...even though they're far below any moving averages that matter -- and would normally be all washed out to the downside.
Of course -- and as I mentioned in this space in last Saturday's column -- and again in my discussion on Friday's Commitment of Traders Report further up...if the non-commercial and small traders categories are now stuffed to the gills on the long side with the 'friends' of the too-big-to-fail shorts, then they aren't going to be flushed out no matter what dirty tricks 'da boyz' pull.
I continue to watch all things silver very carefully. After three months on not much more than crickets at the COMEX warehouse stocks from June through August, things picked up substantially in September...19.457 million troy oz. in/23.502 million troy oz. out.
In October so far -- and ignoring the 'all zeros' in silver on October 1...there have been 5.478 million oz. shipped into the COMEX -- and 11.250 million oz. shipped out during the five business since then.
October silver deliveries continue to be very heavy for a non-scheduled delivery month...3,126 COMEX contracts/15.630 million oz...with 370 contracts of open interest still left to be delivered, plus however much more is added as the delivery month progresses.
Silver open interest in November continues to grow by leaps & bounds -- and is now up to 2,075 contracts after last night's Preliminary Report came out...more than double what it was a week ago. November isn't a scheduled delivery month for silver, either.
Now that China's back from their Golden Week holiday, I'll be watching what the SGE and SHFE are up to. As mentioned in this space yesterday, they've added about 54 million oz of silver to their combined inventories since late February. Even though this silver is not being consumed by industry, it's 'demand' nonetheless -- and just adds to the deficit. That much silver taken off the market represents 23 days of world mine production...nothing to be sneezed at.
Of course -- and in the news lately, has been that story about China importing record amounts of gold during the first eight months of this year -- and also the story about their central bank adding 23 tonnes of gold to their reserves in September alone. Their central bank gold purchases have been accelerating with each passing month during this calendar year.
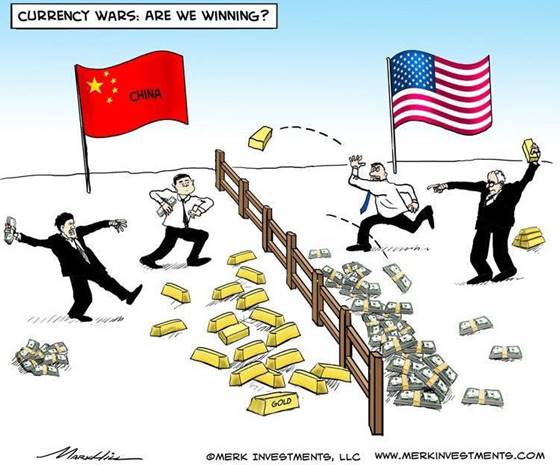
Then there's this quote from Martin Armstrong's "The Gold Paradox: The Geopolitics & Sovereign Debt Crossroads"...which I've updated with the current FRED data. "China knows well that war is brewing and the USA would suspend any debt payment to China if war broke out. As of mid 2026, China's U.S. treasury holdings fell to approximately $620 billion, a 15-year low -- about a 53% decline from its peak of $1.32 trillion in 2011. They have also been dumping Euro debt. With geopolitical risk rising, you do not buy the debt of your adversary."

Looking beyond the precious metals and into geopolitics, the situation for the Ukraine is now terminal -- and the U.S. and Europe are all out of aces. The threats against Russia coming from vassal Europe are becoming increasing shrill, unhinged and totally divorced from reality. A major false flag event of some type, in the hope that it will draw the U.S. back into the fight, is now a distinct possibility.
In West Asia, the next attack by the U.S. and/or Israel against Iran will unleash a firestorm of missiles and drones that will utterly devastate the region -- and exports of oil, gas, fertilizer and other critical commodities from that area, will come to a screeching hold...for years, if not a decade.
With all that going on, Planet Earth remains in the midst of the biggest 'everything financial bubble' the world has ever known -- and at the same time, the powers-that-be/Epstein class are moving heaven and earth to prevent their beloved fiat currency system from imploding...along with its associated financial system.
As I've been saying off and on for the last 20-odd years...'if the financial powers-that-be weren't propping up everything paper that wanted to crash and burn -- and suppressing the prices of everything that wanted to rally to the moon and the stars...the world's financial and monetary system would be a smouldering ruin within five business days." That statement is even more true today than it was back then.
With the mid-term elections in the U.S now just three weeks away...place your bets as to how this is all going to unfold in the interim...or shortly after.
I'm still 100% 'all in' in the precious metals -- and will remain so to whatever end.
I'm also done for the day -- and the week -- and I'll see you here on Tuesday.
Ed
About the author

SUBSCRIBE: https://edsteergoldsilver.com/

Ed Steer’s Daily Analysis of the Gold and Silver Markets
After eight years of writing about the precious metals for Casey Research, the folks at Stansberry & Associates—who just recently purchased controlling interest in the company—decided that my ‘niche market’ column didn’t fit into their plans.
Since the time that Casey Research was kind enough to offer me a stand-alone column, it became their most highly-rated blog almost from the outset—and has remained that way up to this date...