
[I was a trader in the grain pits on the floor of the CBOT for 40 years. I rarely traded silver, but its supply/demand fundamentals caught My eye a few years back -- and I've been following it closely ever since.] -- John Macintosh
Last year the USGS declared that silver was a critical mineral for the USA, and recently there has also been much talk about the creation of a strategic minerals reserve for national security known as the Vault Project, to encourage the production of critical minerals among friendly nations, including price support mechanisms.
So it came as a great surprise to me when I saw these two charts below.
The first chart is on a monthly basis, and the second on a yearly basis.
Since last October, the US has turned from being a perennial and ever increasing importer of silver since 1997 to a huge exporter. My thanks to Ed Steer of the Gold and Silver Digest for forwarding the charts. At the risk of spoiling his reputation, Ed courageously posted the entirety of my last diatribe, The Silver Institute Strikes Again, on his website, The Gold and Silver Digest, and from there it migrated to the X platform, where it collected quite a few eyeballs, and hopefully, a few raised eyebrows.
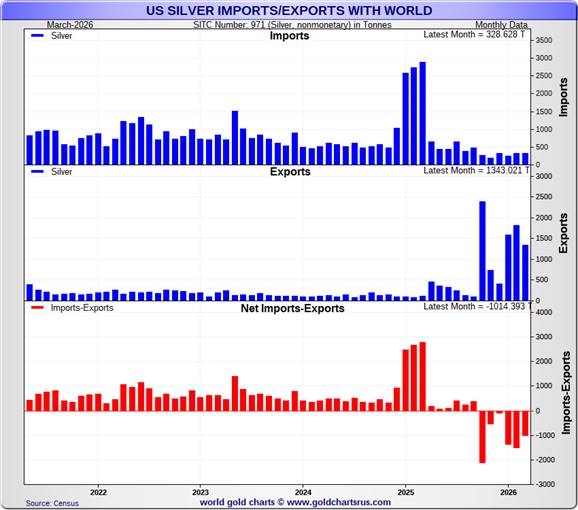
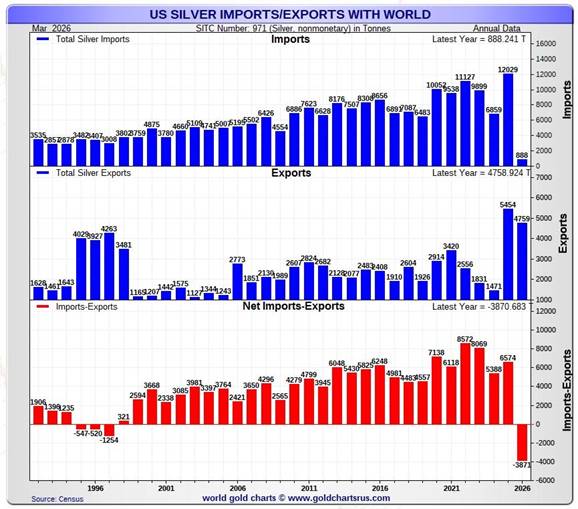
On average, over the last 5 years, the US was a net importer of 6,944 tons, or 19 million ounces per month. However, from last October through March, the US has become a net exporter of 6,500 tons, or 35 million ounces per month, an enormous and totally unprecedented swing of 54 million ounces per month.
For the first quarter of this year exports minus imports were 3,873 tons. That is the last red line on the second chart. The other lines are for the full year.
If net exports out of the US were to continue at this rate for the balance of this year, the US would be a net exporter of 500 million ounces. To put that into perspective, the amount of silver mined annually by the top 3 miners, Mexico, Peru and China, is 420 million ounces. The US mines 35 million ounces.
The only explanation that I have heard for this enormous trade flow reversal that makes any sense at all is that the US and China have made a deal for certain rare earths to be shipped to the US, and paid for, not in dollars, but in gold and silver. In 2024 the average quarterly US gold exports were $ 9.5 billion. Last quarter they were $ 37.5 billion.
Since the price of rare earths has risen many times more than the price of precious metals prices, it looks like the Chinese, with their almost complete monopoly of production and processing of rare earths, are the winners in this game.
In the latest data for March, the vast majority of US silver was exported to Hong Kong and the UK. In turn, UK exports show that almost all their imported silver is then sold on to Hong Kong, so It appears that all roads are leading to China.
In fact, recent Chinese import / export data is almost a mirror image of that of the US. In 2025 China exported 5,100 tons. But in the first quarter of this year the flow reversed, and China imported a record 1,626 tons. At this pace they would import 6,500 tons annually.
According to our old friends, the Silver Institute (neither you, dear reader, nor I, can believe that I have written over 30 lines without mentioning their name), current annual US industrial demand is 125 million ounces. That sounds like quite a lot, but not when you look at it from an historical perspective. In their annual survey of 2013, they estimated industrial demand for the year 2005 at 132 million ounces, and from 2003 to 2008 the average was 127 million ounces.
So how did we manage to shed 7 million ounces of demand in the 21 years from 2005 to 2026?
Last July the USGS published a report named Key Minerals in Data Centers.
Under the banner "key minerals used in each part of Data Centers and the percentage the US imports to meet consumption for that material," they said that the silver used in data center server boards and circuitry equaled 64% of US silver imports. They failed to give the exact timeline of their import data, but the average of the last 5 years is 9,890 tons: 64% of that is 6,330 tons, or 204 million ounces. (Had they used data from the 6 months prior to the report,
the number would be substantially higher.)
Data center construction is exploding all over the country, and capex growth in the industry is estimated to increase by 70% this year. At the rate they are being constructed, it is possible that current data center silver demand greatly exceeds 204 million ounces, as that number was published almost one year ago.
I would wager that back in 2005 data centers used next to zero silver, so none of the current demand would have existed then. If you add the data center's 204 million ounces to the Silver Institute's 2005 existing industrial base, today's demand would be 336 million ounces (132+204).
In other words, with no growth whatsoever in all other parts of industry for 21 straight years, US industrial silver demand would amount to 211 million ounces more than the 125 million ounces that the Silver Institute is carrying for 2026.
But back in 2005 there were no giant wind turbines full of silver brushes dotting the landscape. There were no 5G towers. Cars made in the US had far fewer silver hungry sensors than they do today. The Panasonic factory that makes Tesla batteries in Kansas didn't exist. According to the SEIA, US solar panel manufacturing has recently grown to become the third largest in the world. They claim that all levels of the supply chain are now manufactured domestically, which presumably includes silver. Tesla recently announced the construction of a giant solar panel factory near Houston which will dwarf all others. Tesla plans to produce 100 GW of solar panel capacity each year. Three years ago total US capacity was less than 30 GW, Again, they claim that the entire supply chain, from raw materials to finished products will be domestically sourced.
There are now 47 million more people in the US than there were in 2005. That is a lot more air conditioning units, fridges and other appliances which all use silver brazing and alloys.
In 2005 the military was making far fewer sophisticated munitions than they do today. The more sophisticated the weapons, the more silver they consume, since silver remains unmatched in reflectivity, conductivity and thermal management. As a non military example, it is claimed that the new fangled Joby vertical take-off car will contain 15 kilos of silver, 480 ounces.
With US munitions stockpiles at dangerously low levels, you can be sure that drone and missile manufacturing is currently running off the charts. We will never know, but I suspect that the US military’s consumption of silver is very significant, and growing exponentially with the rapid advances in drone and missile technology.
In short, I think we can safely say that the domestic demand for silver, excluding data centers must have grown significantly since 2005; after all, GDP is up over 50%. Had silver demand increased by only 20%, the above equation would become 158 + 204 = 362 million ounces, which is 235 million ounces above the Silver Institute's current industrial demand.
Incredibly in 2015, the Silver Institute revised the US industrial use downwards in spectacular fashion. They did the same thing to total world demand for silver in 2020 and 2021, when they dropped overall demand retroactively by over 20%.
In 2015 they crushed US industrial demand for the previous 10 years by an extraordinary amount. For the eight overlapping years covered by the two reports, they shed 345 million ounces of US industrial demand, which, on average is 43 million ounces per year, or a mind boggling 34%. This is the Silver Institute at their very finest. No changes in methodology, no explanation, just the usual journey down the well trodden path strewn knee deep in the remnants of silver demand, all the way to the woodshed where they keep the chainsaws, hatchets, razor blades and an assortment of medieval contraptions. This is where demand is hung, drawn and quartered, so that we can be presented with a benign Goldilocks balance sheet.
However, when exposed to a modicum of common sense, the actual data doesn't make any sense at all.
When you include their photography, coin manufacturing and jewelry demand, which totals 42 million ounces, current total demand for physical silver in the US rises to 404 million ounces.
US mine supply is estimated at 35 million ounces, and domestic recycling is put at 48 million ounces (a number that I consider to be far too high: more on that in yet another missive).
Together, mines and recycling supposedly add 83 million ounces to the supply.
So the current US deficit between supply and demand is in the order of 320 million ounces, without taking into account imports and exports. Some of the variables that I have mentioned would increase that deficit by a substantial margin.
Strange things are happening in the world of silver. The Hormuz blockade is restricting sulfur supplies, and the subsequent sulfuric acid ban by China has already caused a drop in copper production in Chile, and therefore in the silver production that is a byproduct of those mines. Many mines in remote places rely on diesel generators; soon they may be forced to cut back on their operations for lack of power. For two weeks, miners in Bolivia have been blockading roads around the capital. Cartel activity in many key mining districts of Mexico are impeding mining operations. And now it seems that the hunger for rare earths is causing a massive drain on US silver supplies.
I have no idea how long the US will continue to be a net silver exporter, or for how far this apparent barter deal may extend into the future. It appears to have already been in effect for 6 months so far. In gold it has been going on for 15 straight months. Maybe tomorrow everything reverts to normal, and we will wake up on a bed of sweet smelling violets in Hunky Dory land, but I think a Humpty Dumpty ending is more likely. With bits of Humpty Dumpty carried a couple of miles down the track by a freight train, reconstructive surgery may not be possible.
A structural domestic shortfall of over 300 million ounces, combined with a current net export rate of 500 million ounces, that draws US stocks down by the equivalent of the entire global mine output is not only totally unsustainable, it is simply beyond comprehension. What is more, all this is flying totally under the radar. The open interest in silver futures at the COMEX is flirting with 20 year lows. The complete disconnect between the availability of material resources and the high flying AI tech space that is so reliant on those same resources, is at an extreme.
Over many years of putting together commodity balance sheets I have never seen anything so completely out of whack. I once accused the USDA of compiling the national soybean supply and demand statistics by taking turns at the dartboard in a Washington DC pub on a Friday night. But for all their faults, they never once suggested that soybean exports were more than ten times greater than the size of the soybean crop, which is the equivalent of what the current US silver balance sheet implies, so I think I may owe my old nemesis an apology.
I am quite sure that whoever is behind the rare earths for silver deal is being comforted by the supposedly manageable deficits in the silver balance sheet provided by the only authority on the subject for the last 30 years, the Silver Institute, and there is no other voice to listen to, except some washed up yahoo jumping up and down on his soapbox, and getting trashed by multiple bots on the X platform.
If and when the US silver stockpiles hit critical levels, bringing them back up will not be easy.
For the past several months the price in Shanghai has averaged 12 to 13% above the COMEX price. Of all the many silver pricing mechanisms in the world, The COMEX is the cheapest, and the spoils rarely go to the lowest bidder, especially when it is uniformally known that the bidder cannot be trusted. Meanwhile it appears that more and more industrial users, like Samsung, are going directly to the mines for their supplies, and paying over the COMEX price to secure long term physical possession. Divorce proceedings between physical silver and the futures paper market have already begun, and things are likely to get really ugly.
A lack of strategic thinking over many years brought us the current rare earths fiasco. It would be the height of irony if that same shortsightedness simply caused one fiasco to bleed into another.
Since strategic thinking in the West always plays second fiddle to short term political expediency, I think it quite likely that we are indeed headed for a double whammy; a domestic deficit in rare earths that remains chronic, and a silver deficit that cannot be fixed in any normal fashion. Perhaps they will do another switcheroo; buy silver and pay for it in gold from Fort Knox.
Year after year the people in charge of our money jump from one quick fix to another, without resolving any underlying issues, and one day the system will simply overflow like a clogged toilet.
You can be sure that China saw this one coming from a mile off. When it comes to strategic minerals, I am told that they prefer homework to the dartboard, clogged toilets, and the Silver Institute.
John Macintosh
About the author