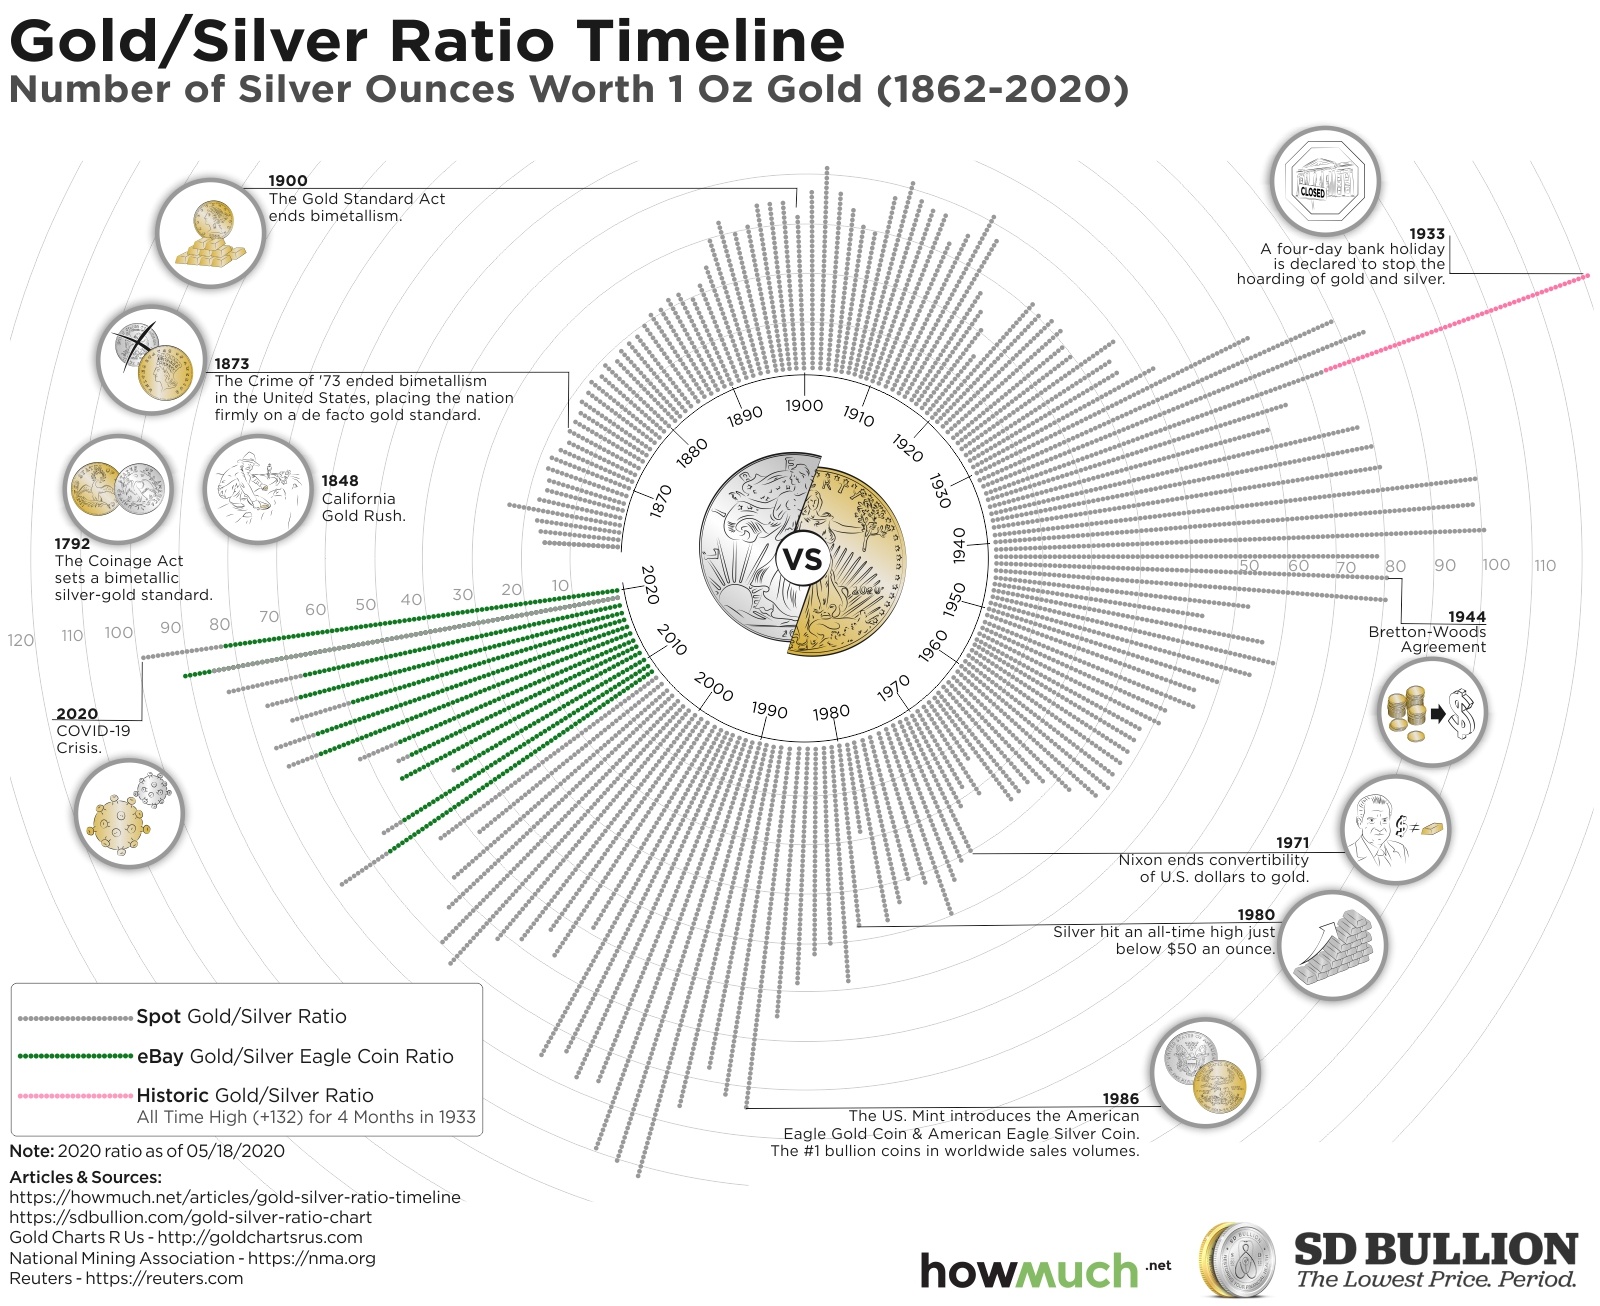
A lot of investors are looking at the stock market and wondering how it could possibly be so high right now. Unemployment is at levels last seen in the Great Depression. The U.S. is facing historic civic unrest and protests. There’s an uncertain national election in 6 months. And a feared second wave of the coronavirus is still on the horizon. All these events are making people rethink their position on precious metals, and our latest visualization can provide a needed long-term perspective on financial history.

- The gold/silver spot ratio reached a record high of 132.4 in 1933 during the Great Depression.
- The same ratio collapsed to as low as 17.9 before President Nixon took the U.S. off the gold standard in 1971.
- The introduction of the American Eagle Gold and Silver Coins allowed investors to buy the precious metals directly, keeping the gold/silver ratio at elevated levels.
- The gold/silver ratio is approaching an all-time record high in the COVID economy, most recently topping out 91.5.
Top 5 Highest Years for the Silver/Gold Spot Ratio
- 1941 - 101.4
- 1939 - 100
- 2020 - 99.3
- 1940 - 98.6
- 1990 - 93.2
Top 5 Lowest Years for Silver/Gold Spot Ratio
- 1967 - 15.4
- 1919 - 15.7
- 1862 - 16
- 1872 - 16.3
- 1874 - 16.6
The gold-to-silver spot ratio is a straightforward though relative measurement. It represents the number of silver ounces worth 1 ounce of gold. Since the prices of gold and silver can change, the spot ratio indicates the relative worth of these two metals. We grabbed the underlying data for our visualization from Gold Charts R Us in partnership with SD Bullion. Then, we combined the historical price information with a timeline of important events in the history of gold and silver from Reuters. The result is an intuitive snapshot of the history of gold and silver in U.S. history.
For the roughly 30 years after the American Civil War, gold and silver prices were stable relative to each other. By 1900 with the Gold Standard Act, the ratio had more than doubled from 16 to 34.5. The twentieth century then brought increasingly unstable gold/silver ratios, rising as high as 132.4 and forcing a 4-day banking holiday in 1933 during the Great Depression. Following World War II the ratio plummeted, eventually reaching a low of 17.9 in 1970. A year later, President Nixon ended the convertibility of U.S. dollars into gold.
Since Nixon ended the Gold Standard in 1971, the gold/silver spot ratio has been on an upward trajectory. In 1986, the U.S. Mint introduced the American Eagle Gold and Silver coins, allowing investors to buy the precious metals directly. Although it hasn’t reached its Great Depression record of 132.4, the most recent figure from May 2020 puts it at 91.5. This makes a lot of sense for a few different reasons. With unemployment rising to levels last seen in the Great Depression, and with the stock market defying gravity despite the unprecedented hit to the economy, gold and silver prices are responding to unclear economic realities like everything else. Investors might also be willing to place increasingly speculative bets, chasing yield out of boredom and as a substitute for the lack of sports. We don’t know what will happen to prices in the future, but there’s no doubt they will continue to change as the economy either hopefully improves or continues to deteriorate.
Do you think the U.S. should revert back to the gold standard? Let us know what you think in the comments.

