 The Captain’s weekly SP500 chart.
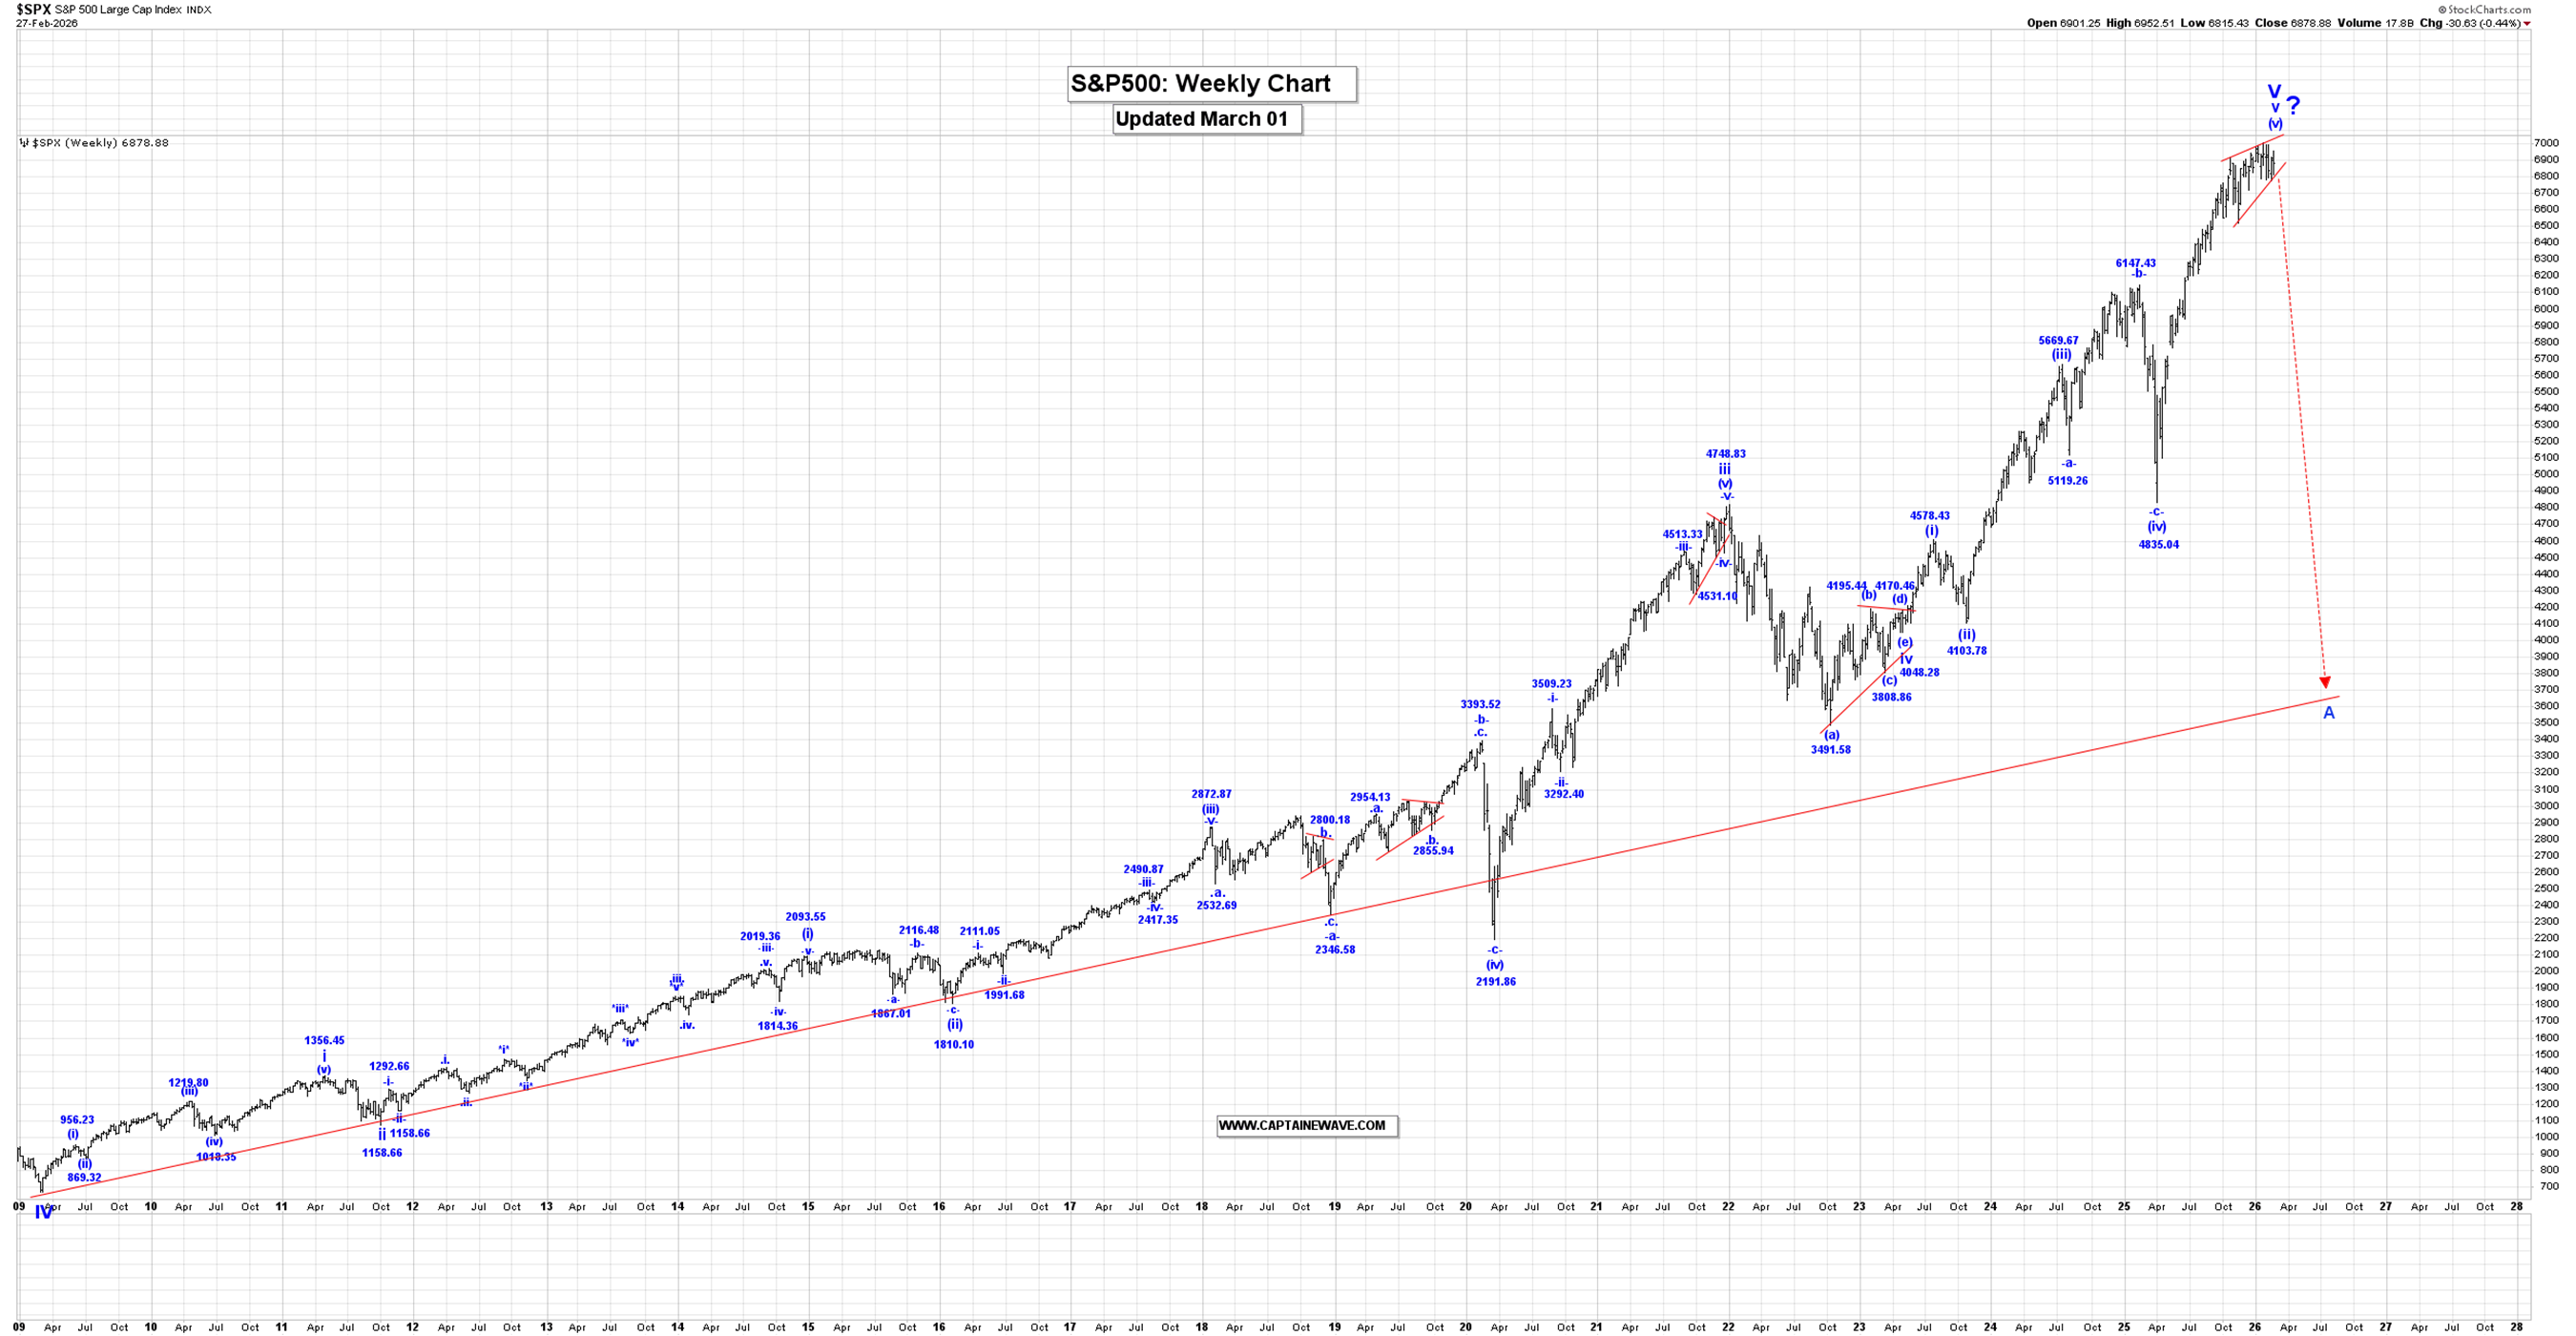
The SP500 was initially higher this past week, reaching a high of 6952.51, although after that high was made, we moved lower, reaching a low of 6815.43 and closing at 6878.88.
Analysis:
Within v of V, wave (iv) ended at 4835.04, and we are moving higher in wave (v), which has the following updated internal wave count:
.i. = 5381.55.
.ii. = 5104.34.
.iii. = 6427.02.
.iv. = 6214.43.
.v. = 6952.51, if complete, as a failure high.
We are waiting for confirmation that our wave $v$ of .v. ending diagonal triangle formation is complete at the 6952.51 high, as a failure high, as opposed to expanding and extending further before it ends.
A drop now below the 6775.50 low would suggest to us that this ending diagonal triangle is complete at the 6952.51 high and that we are heading sharply lower!
Active Positions: Flat the futures and long the SPXS leveraged bear ETF!
Crude Oil
 The Captain’s weekly oil chart.
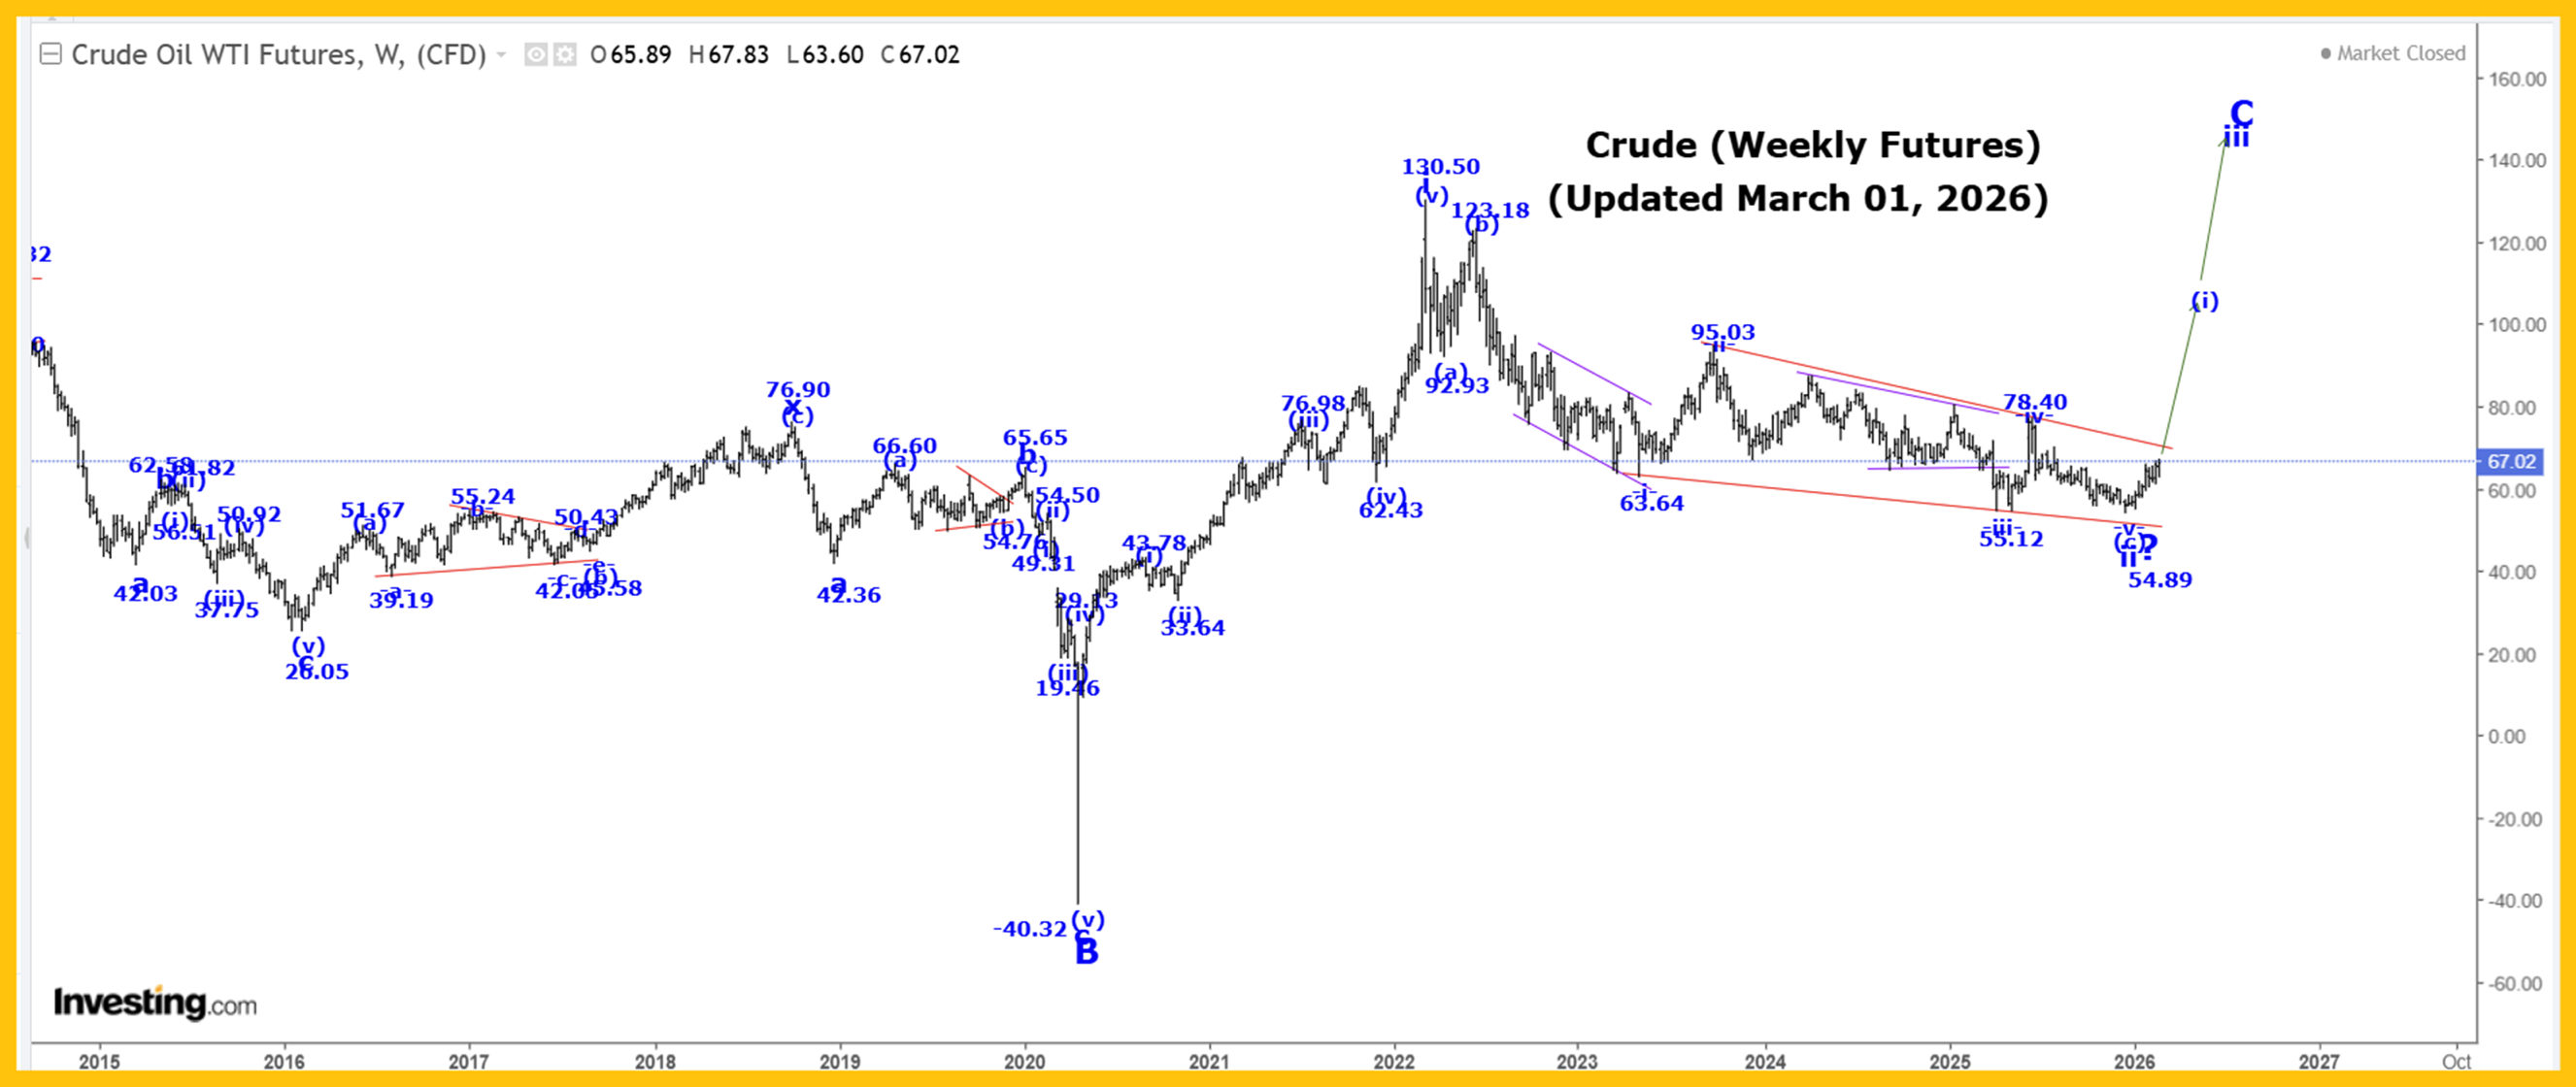
Crude was higher again this past week, reaching a high of 67.83 and closing at 67.08.
Analysis:
Our internal wave count for wave ii to looks like:
(a) = 92.93.
(b) = 123.18.
(c) diagonal triangle:
-i- = 63.64.
-ii- = 95.03.
-iii- = 55.12.
-iv- = 78.40.
-v- = 54.89, if complete.
We have completed the minimum requirement for an end of our wave -v- ending diagonal triangle formation, at the 54.89 low, although only a break of the upper red trendline connecting 95.03 and 78.40 will confirm this to be the case.
After wave ii ends, we expect a very sharp rally higher in wave iii, and we will provide our projected endpoint for its completion after wave ii ends.
In the long term, we are now rallying in wave C that has the following projections:
C = A = 153.77!
C = 1.618A = 244.78!
Suncor
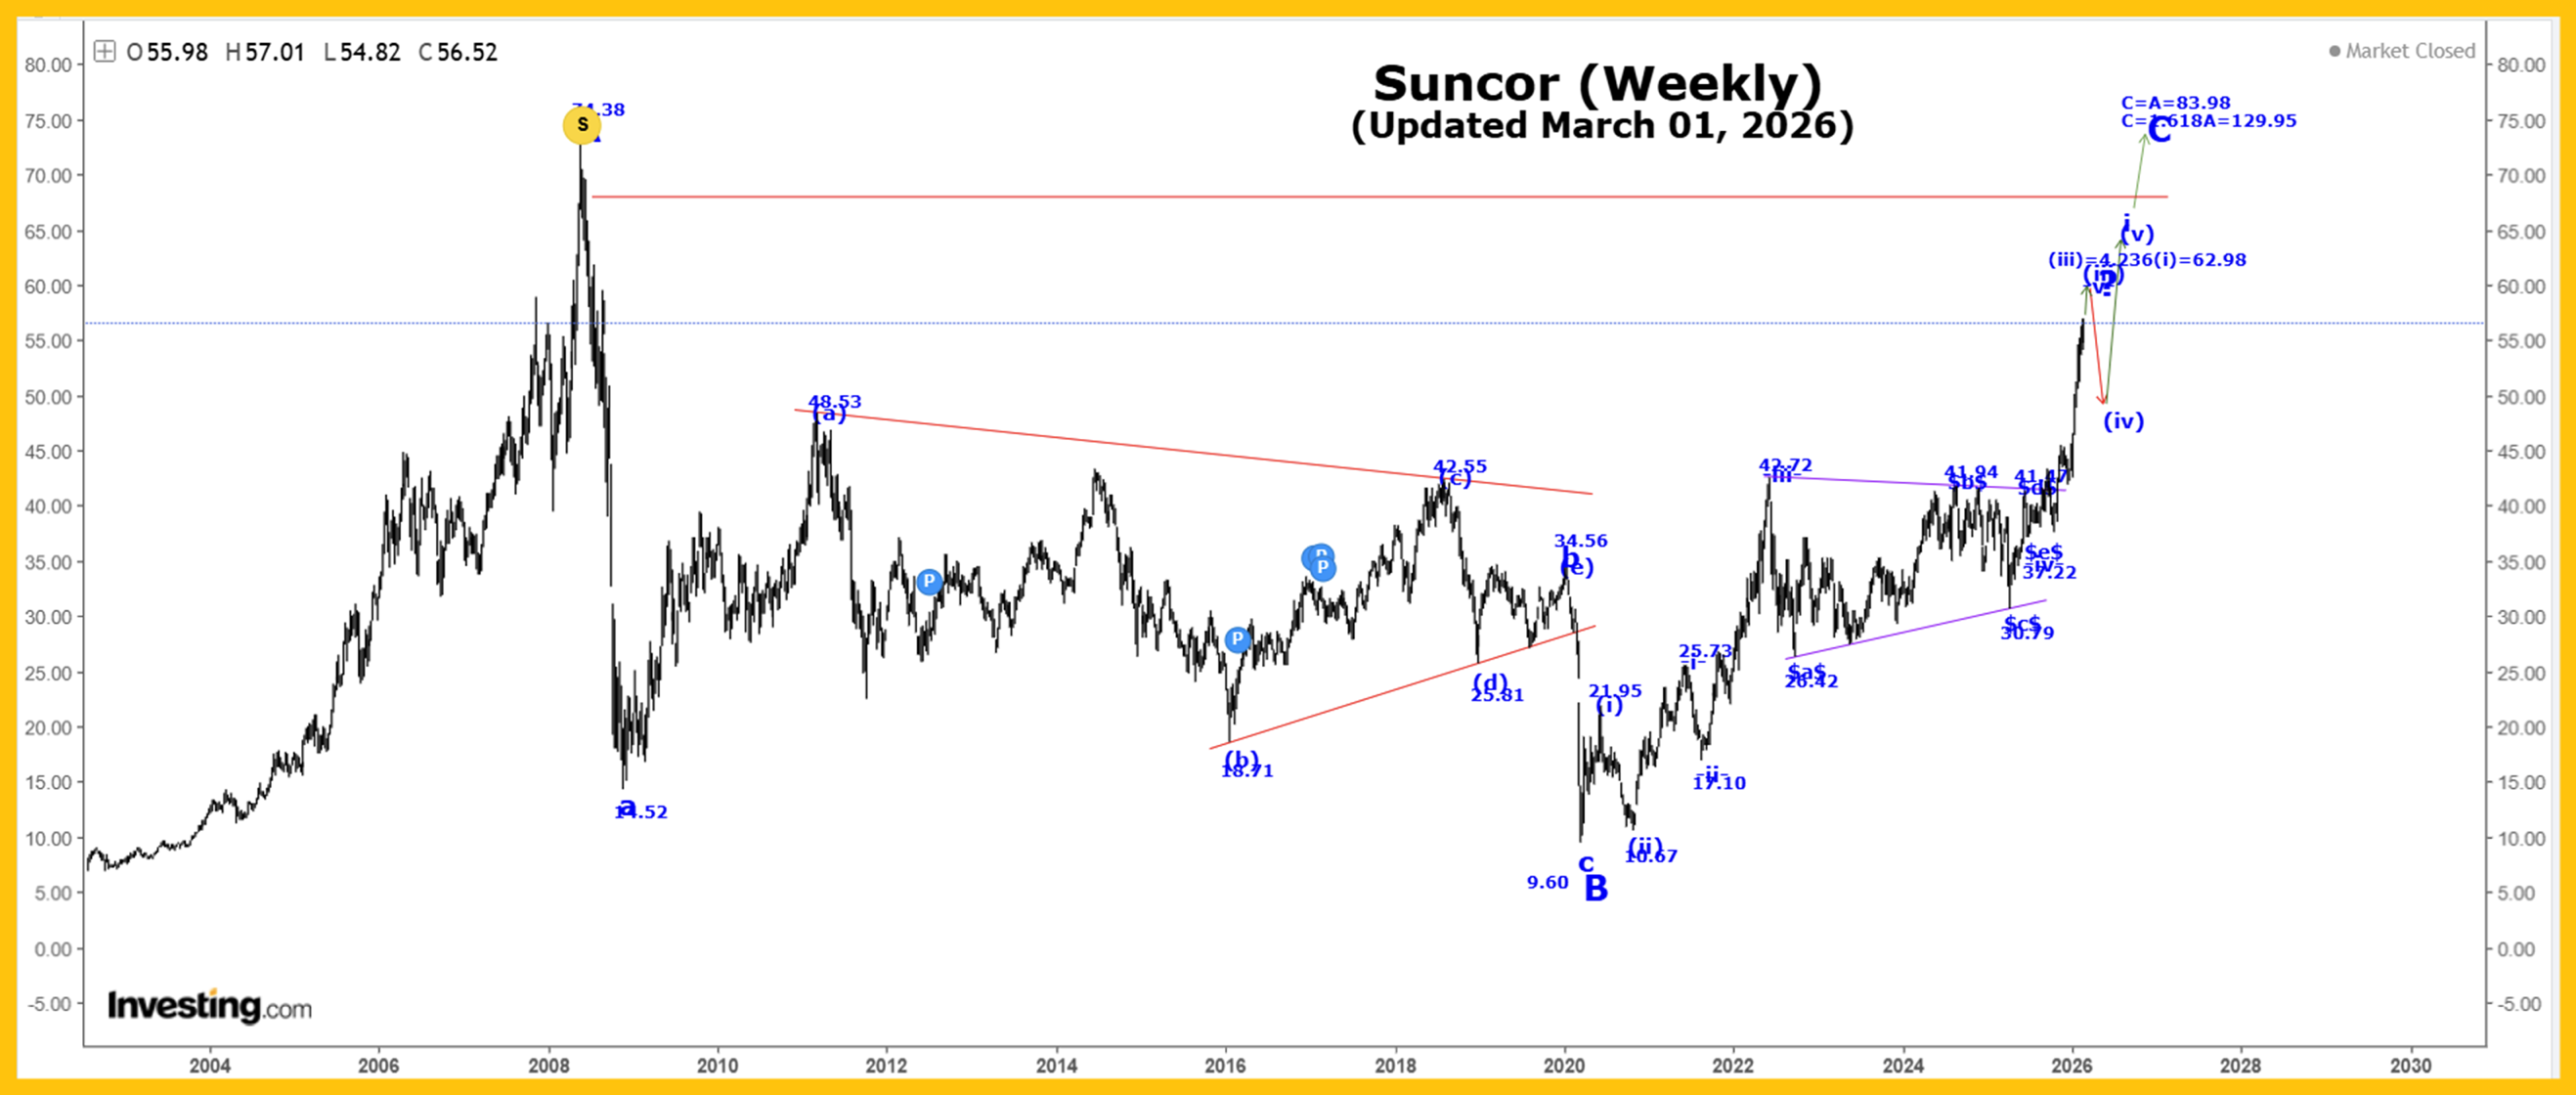
The Captain’s weekly Suncor chart.
Active Positions: Long oil futures, with put options as our stops. Long Suncor too!
Silver
 The Captain’s weekly silver chart.
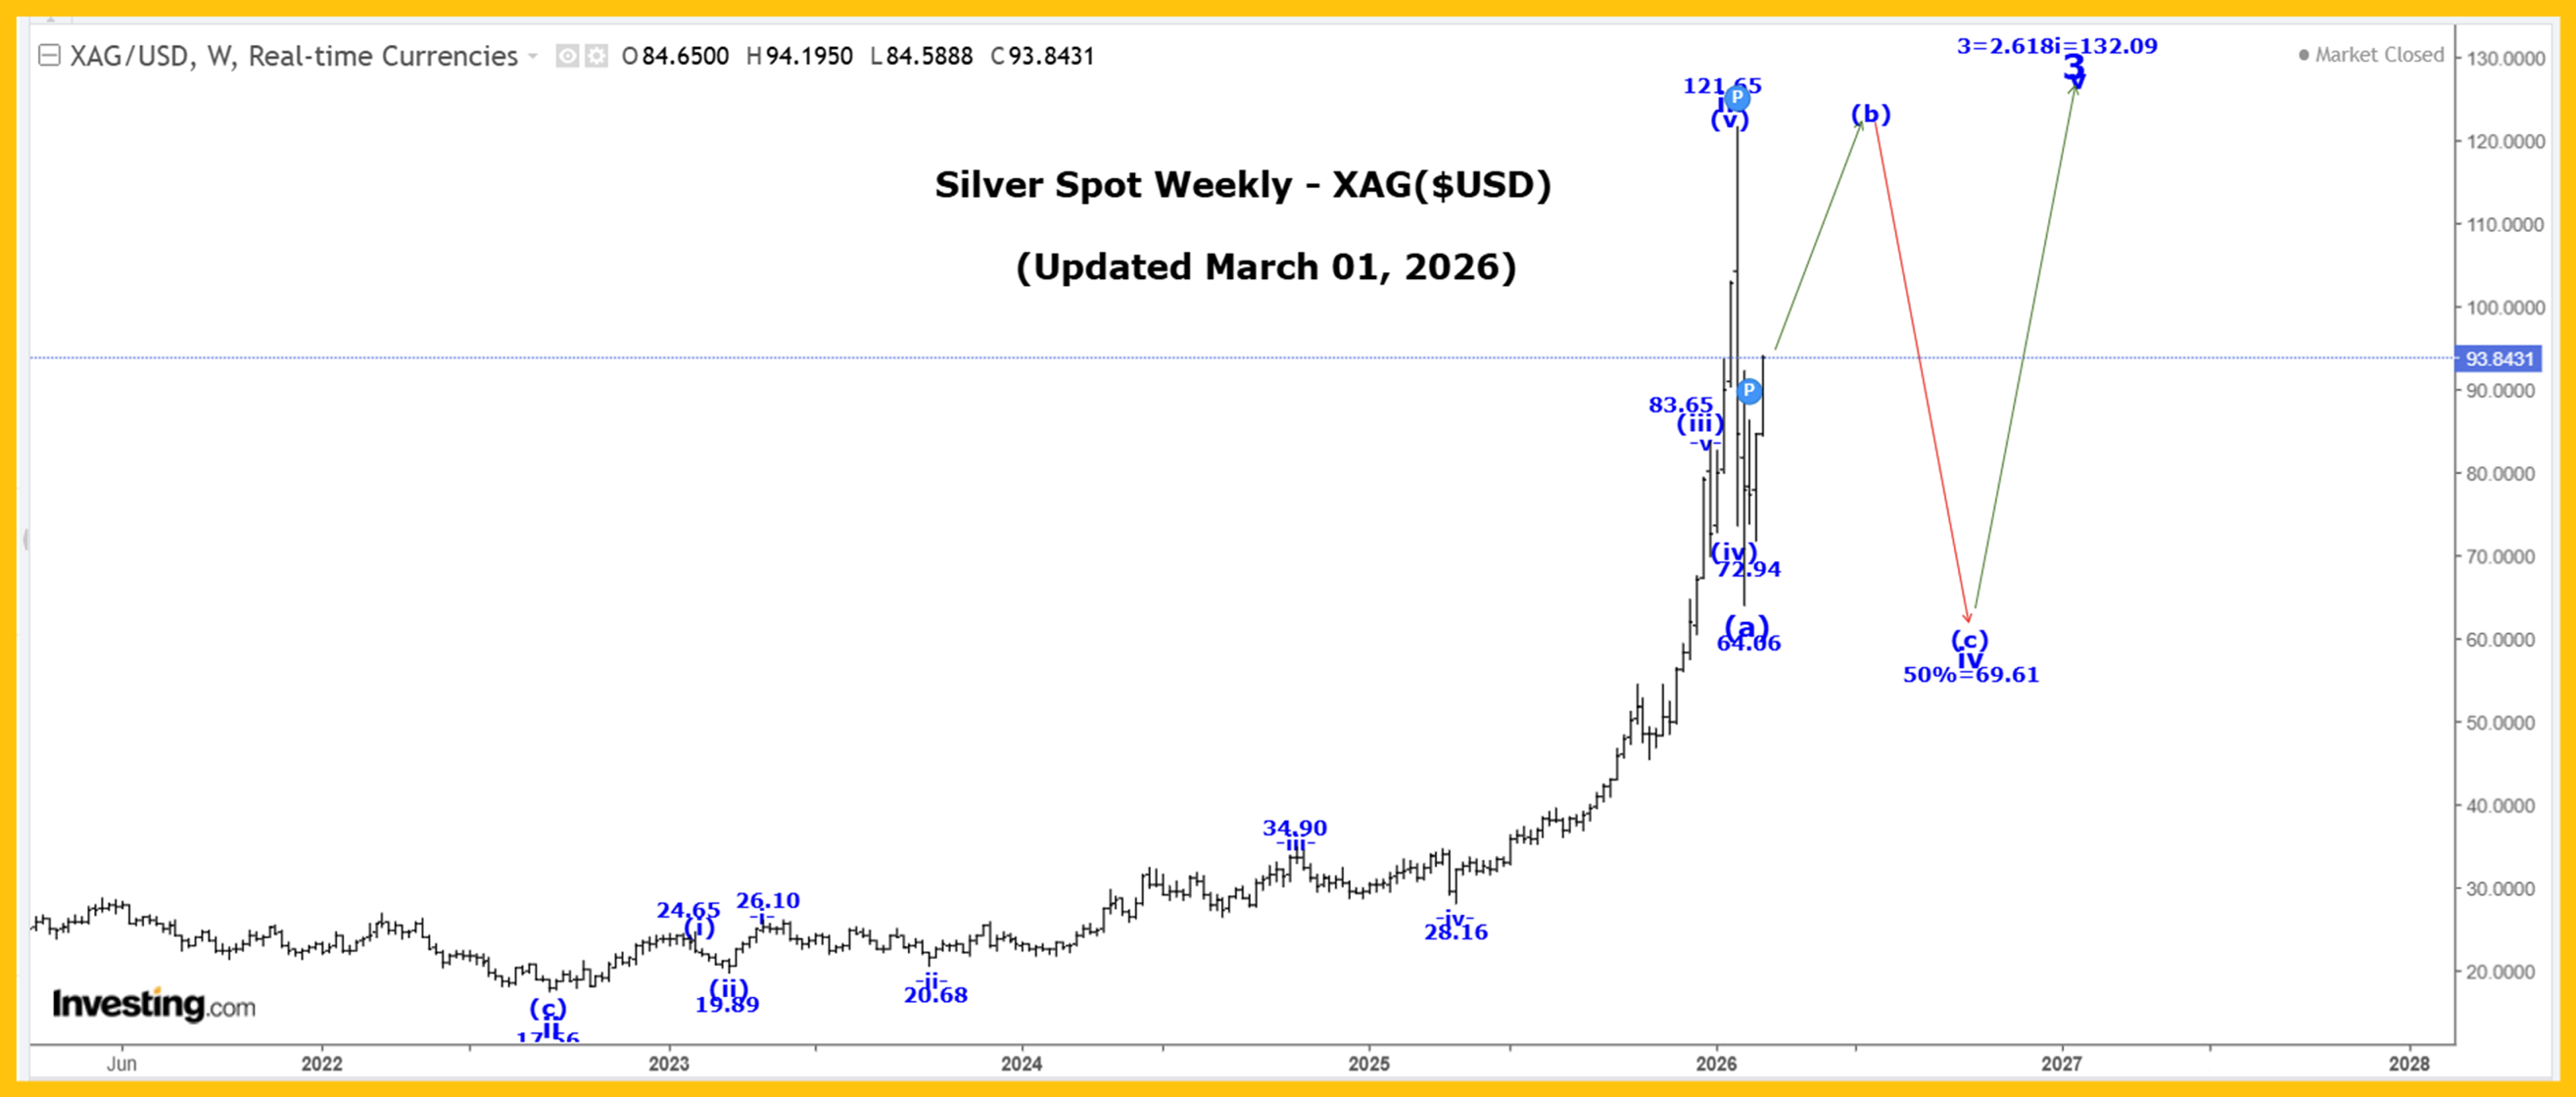
Silver was sharply higher this past week, reaching a high of 94.20 and closing at 93.84.
Analysis:
A very powerful wave iii ended at the 121.65 high, and we are falling in a multi-month wave iv correction that has the following retracement level:
50% = 69.61.
We have reached our 50% retracement level, but we still doubt that all of wave iv is complete at the 64.06 low, and instead, we likely just completed a three-wave structure wave (a) of iv at that low.
If that is the case, then we should now be moving higher in wave (b).
Since the wave (a) drop was a three-wave structure, we should assume that wave iv is going to become a flat, irregular, or even a bullish triangle corrective pattern.
In all of these cases, wave (b) is likely heading back to 121.65 high, or very near it, and may even exceed it before it ends!
After wave (b) ends, we expect a wave (c) drop, which should return to at least the wave (a) low of 64.06, except in the case of a bullish triangle, where we will not revisit that low before wave iv ends.
We expect very high volatility to continue as wave iv develops.
In the long term, we completed all of wave III at 49.00 in 1980 and all of wave IV at 3.55 in 1993. We are now working on wave V, and within that wave, we have the following count:
1 = 49.56.
2 = 11.64,
3 projection is updated to 3 = 2.618(1) = 132.09!
Active Positions: Long, through PSLV:TSX!
Thank-you!
Captain Ewave & Crew
About the author