 The Captain’s weekly US dollar chart.
Analysis:
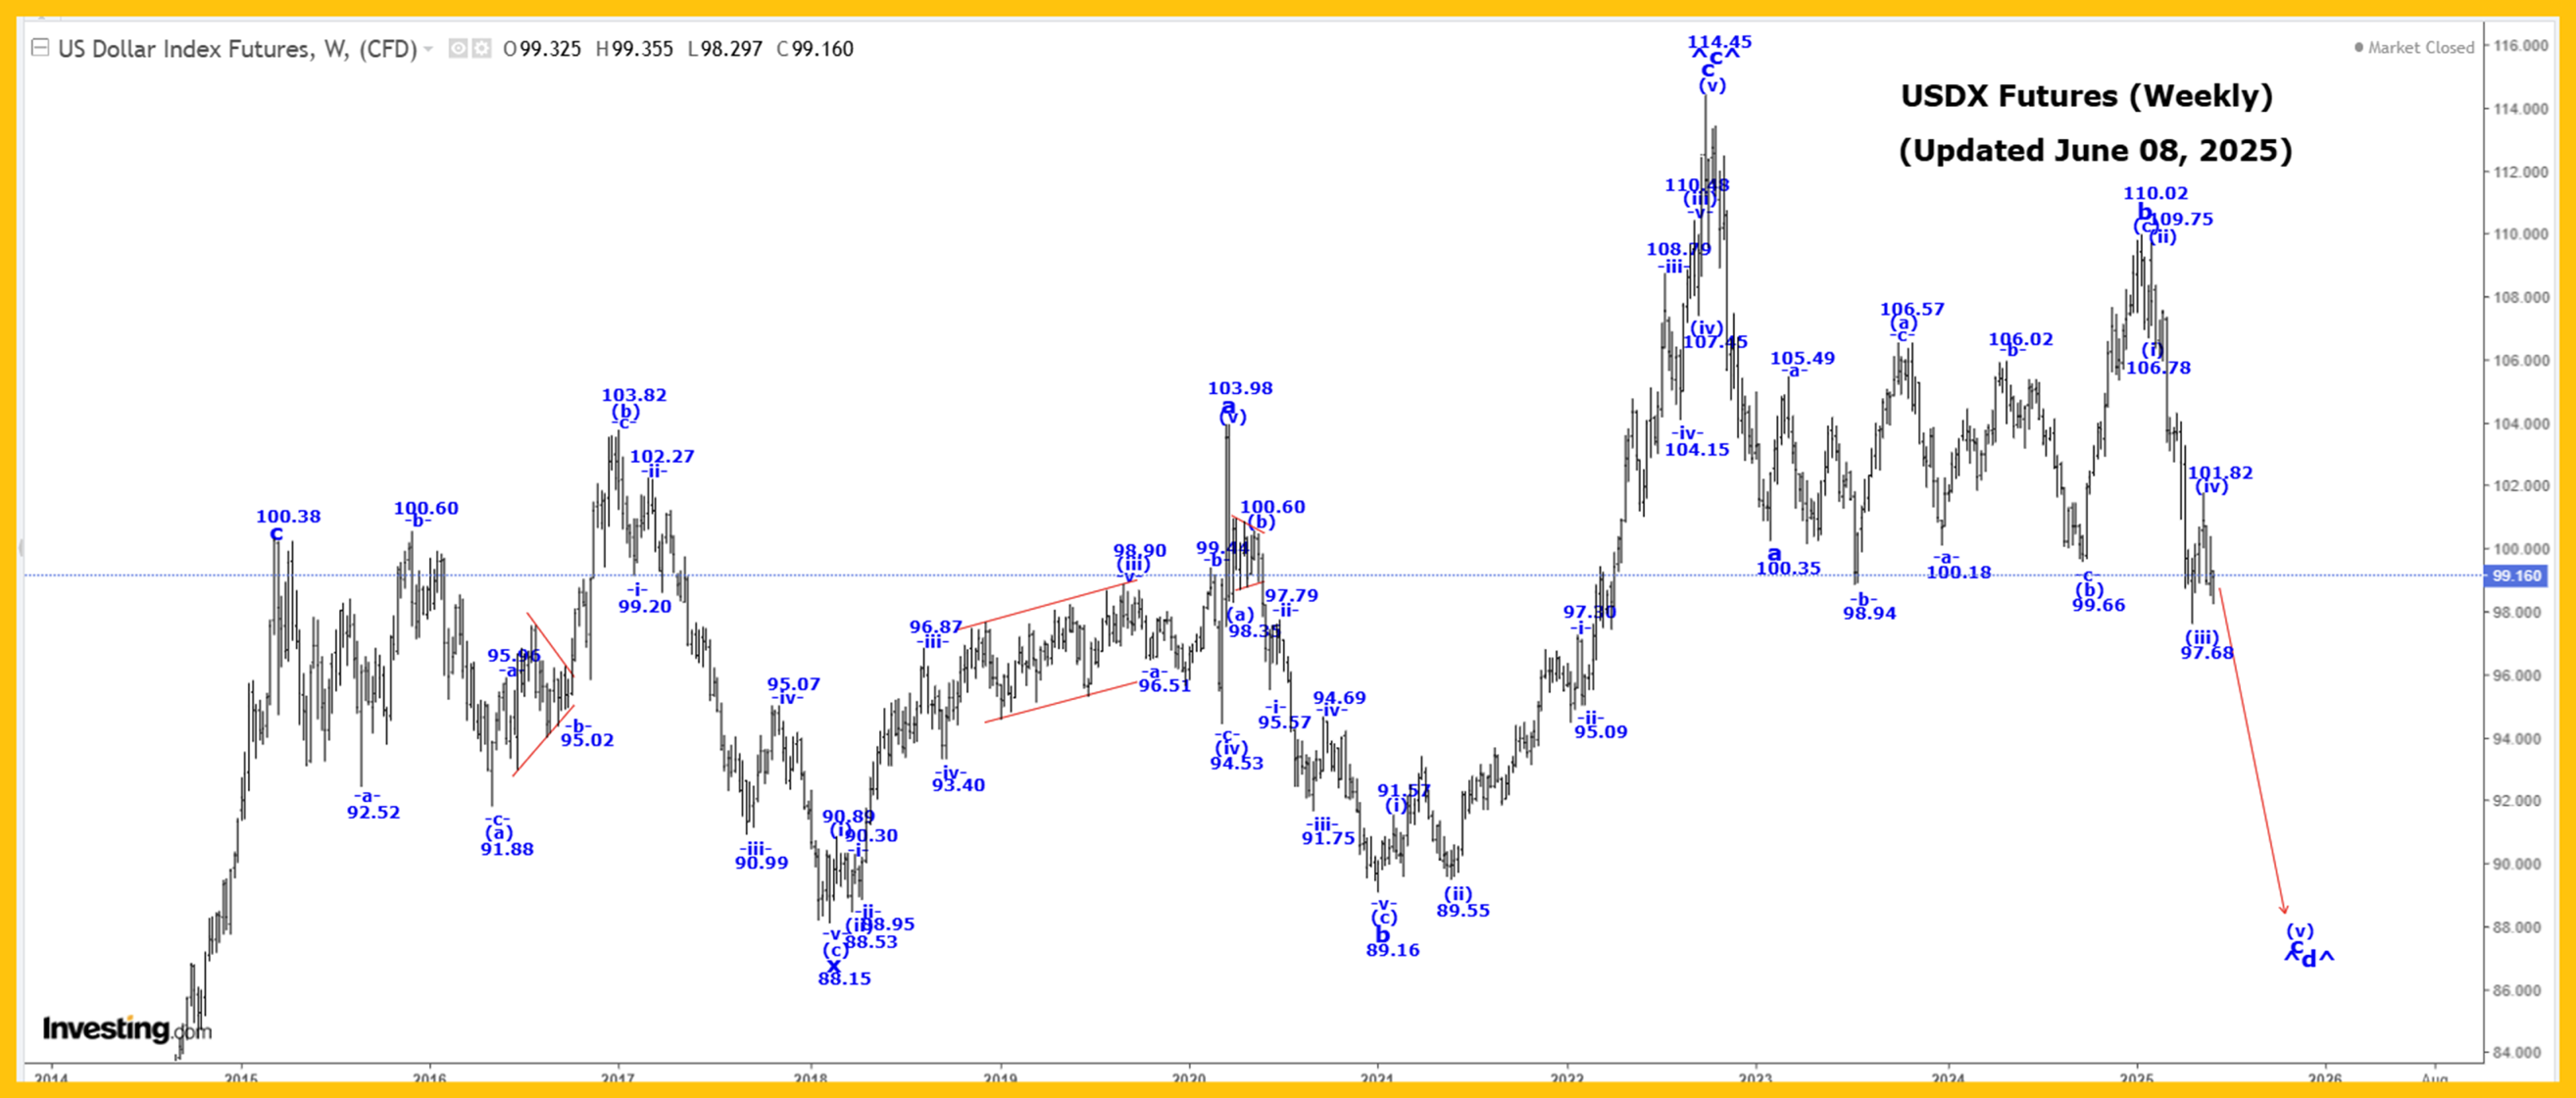
We continue to work on a very large wave B bearish triangle, and within that triangle, all of wave ^c^ ended at the 114.75 high.
We are now falling in wave ^d^. Wave ^d^ cannot fall below the wave ^b^ low of 71.46 for this triangle formation to remain valid.
Within wave ^d^, wave a ended at 100.35 and wave b at 110.02.
Within wave c, we completed wave (i) at 106.78 and wave (ii) at 109.75. It looks like wave (iii) ended at the 97.68 low, and we are now working on the assumption that all of wave (iv) is complete at the 101.82 high.
We should now be moving lower in the subdividing wave (v).
Active Positions: Short, risking to 104.00!
Silver:
The Captain’s weekly silver chart.
Analysis:
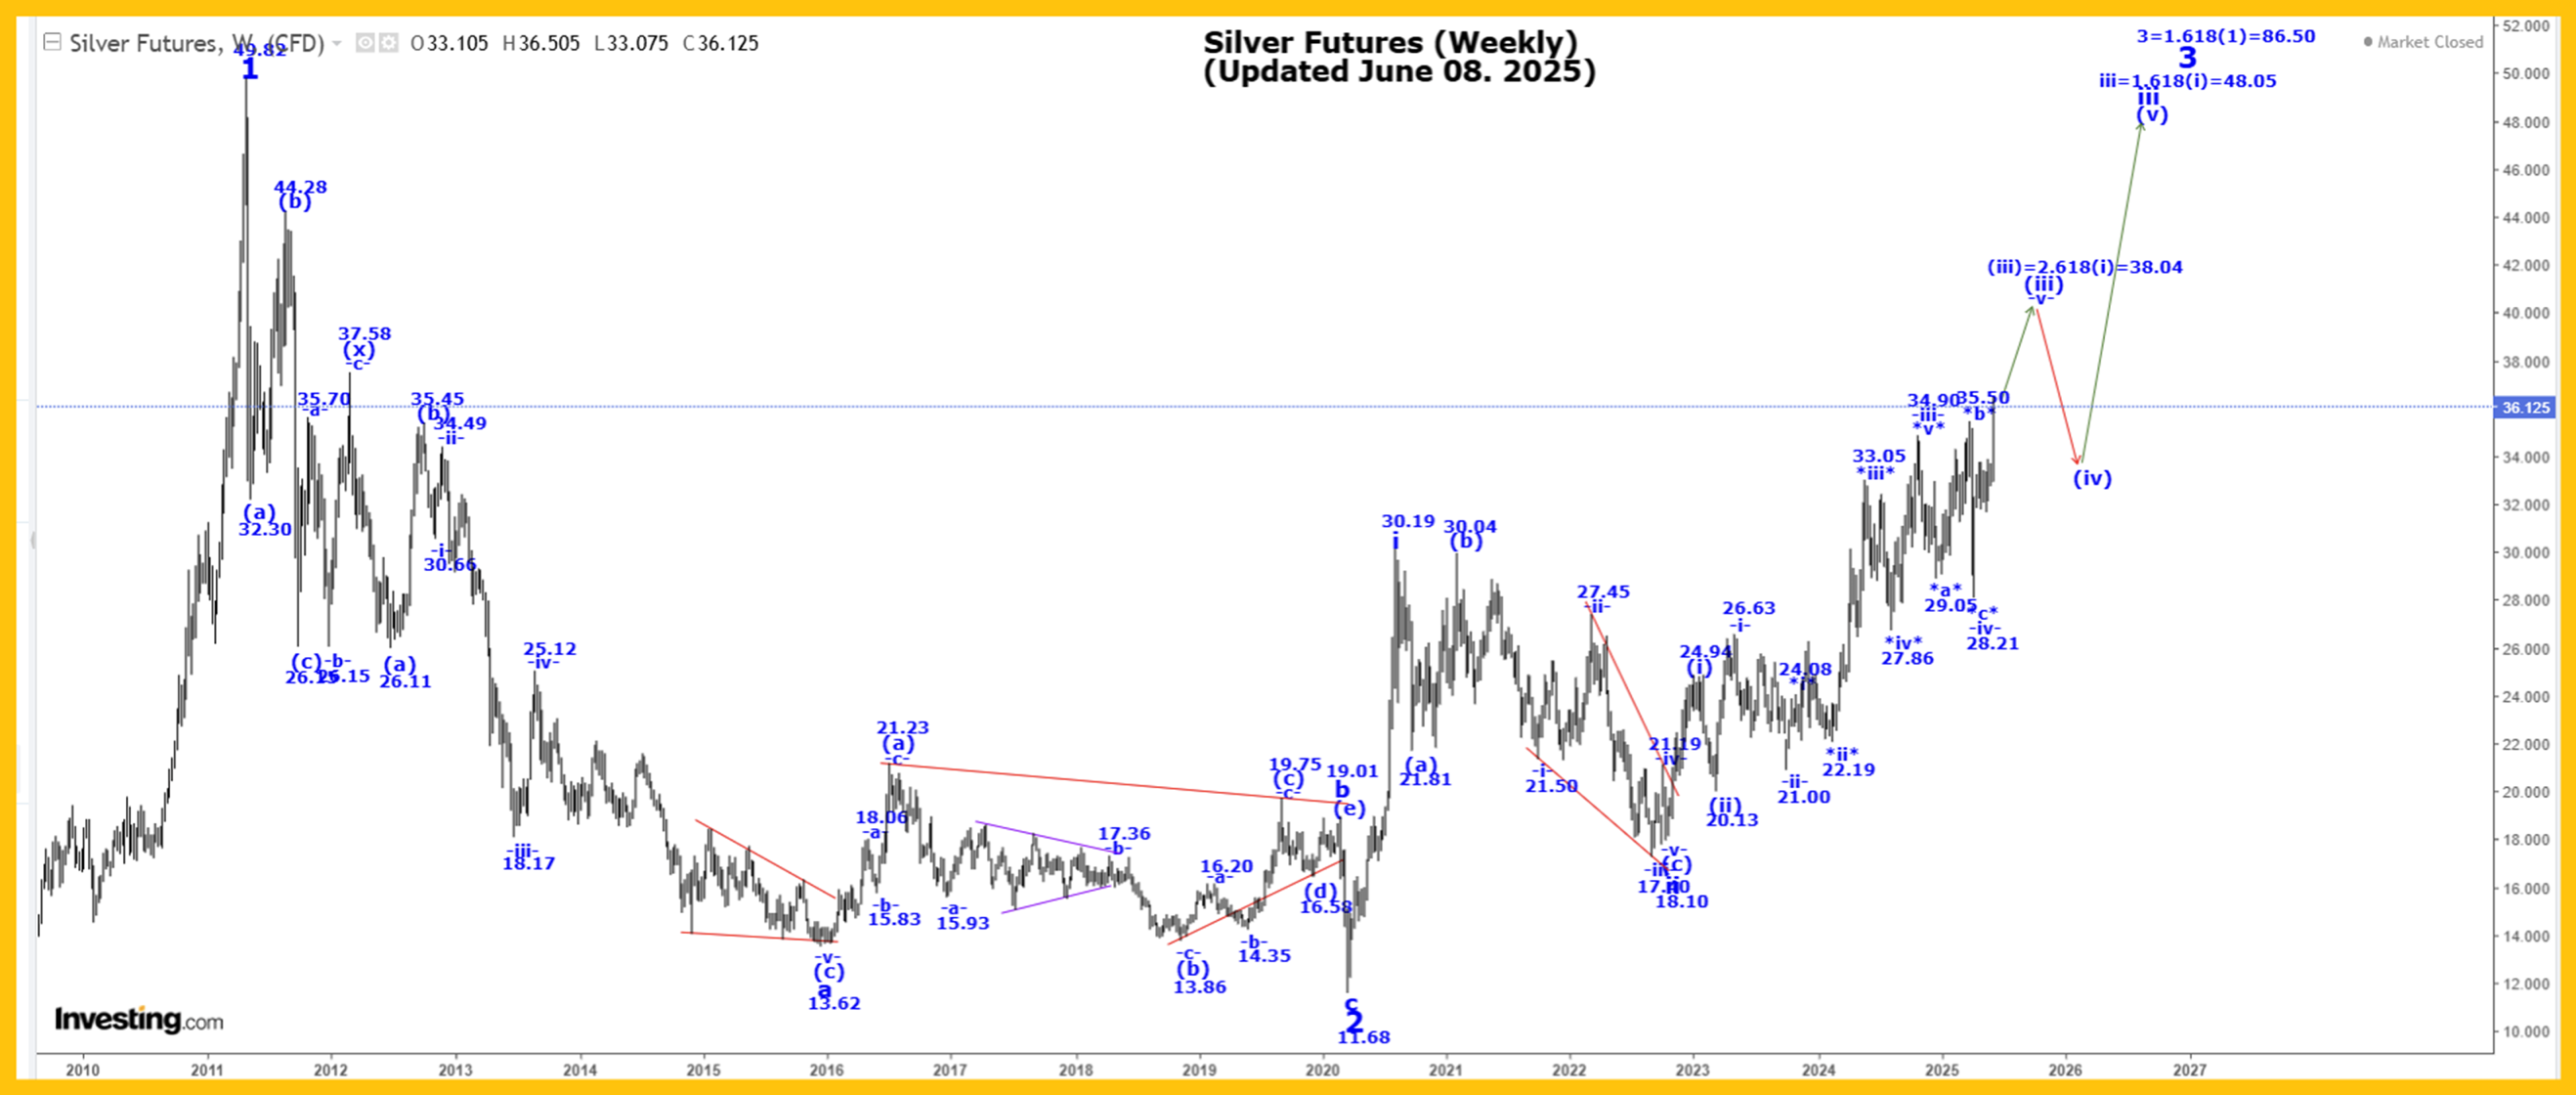
Silver was sharply higher this past week, reaching a high of 36.51 and closing at 36.13, up about 9%!
We are moving higher in wave 3, as shown on our Weekly Silver Chart. Within wave 3, we completed wave i at 29.91 and wave ii at 18.01, and we are now continuing to move higher in a subdividing wave iii.
Within wave iii, we completed wave (i) at 24.39, wave (ii) at 19.94, and we are now moving higher in wave (iii), which has the following projected endpoints:
(iii) = 2.168(i) = 38.04
Within wave (iii), we completed wave -i- at 26.43, wave -ii- at 20.85, wave -iii- ended at 34.90 and wave -iv- at 27.60. We are now moving higher in wave -v- and within wave -v-, wave !i! ended at 33.69 and wave !ii! at 31.78.
We are moving higher in wave !iii!, which has an initial projected endpoint as indicated in our Daily Silver Chart (reserved for subscribers).
The bottom line for silver is that we expect higher prices in the short term, and the long term too!
In the very long term, we completed all of wave III at 49.00 in 1980 and all of wave IV at 3.55 in 1993. We are now working on wave V, and within wave V we have the following count:
1 = 49.82;
2 = 11.64;
3 = First projection is 86.50.
Active Positions: Long with puts as a stop!
Gold:
The Captain’s daily gold chart.
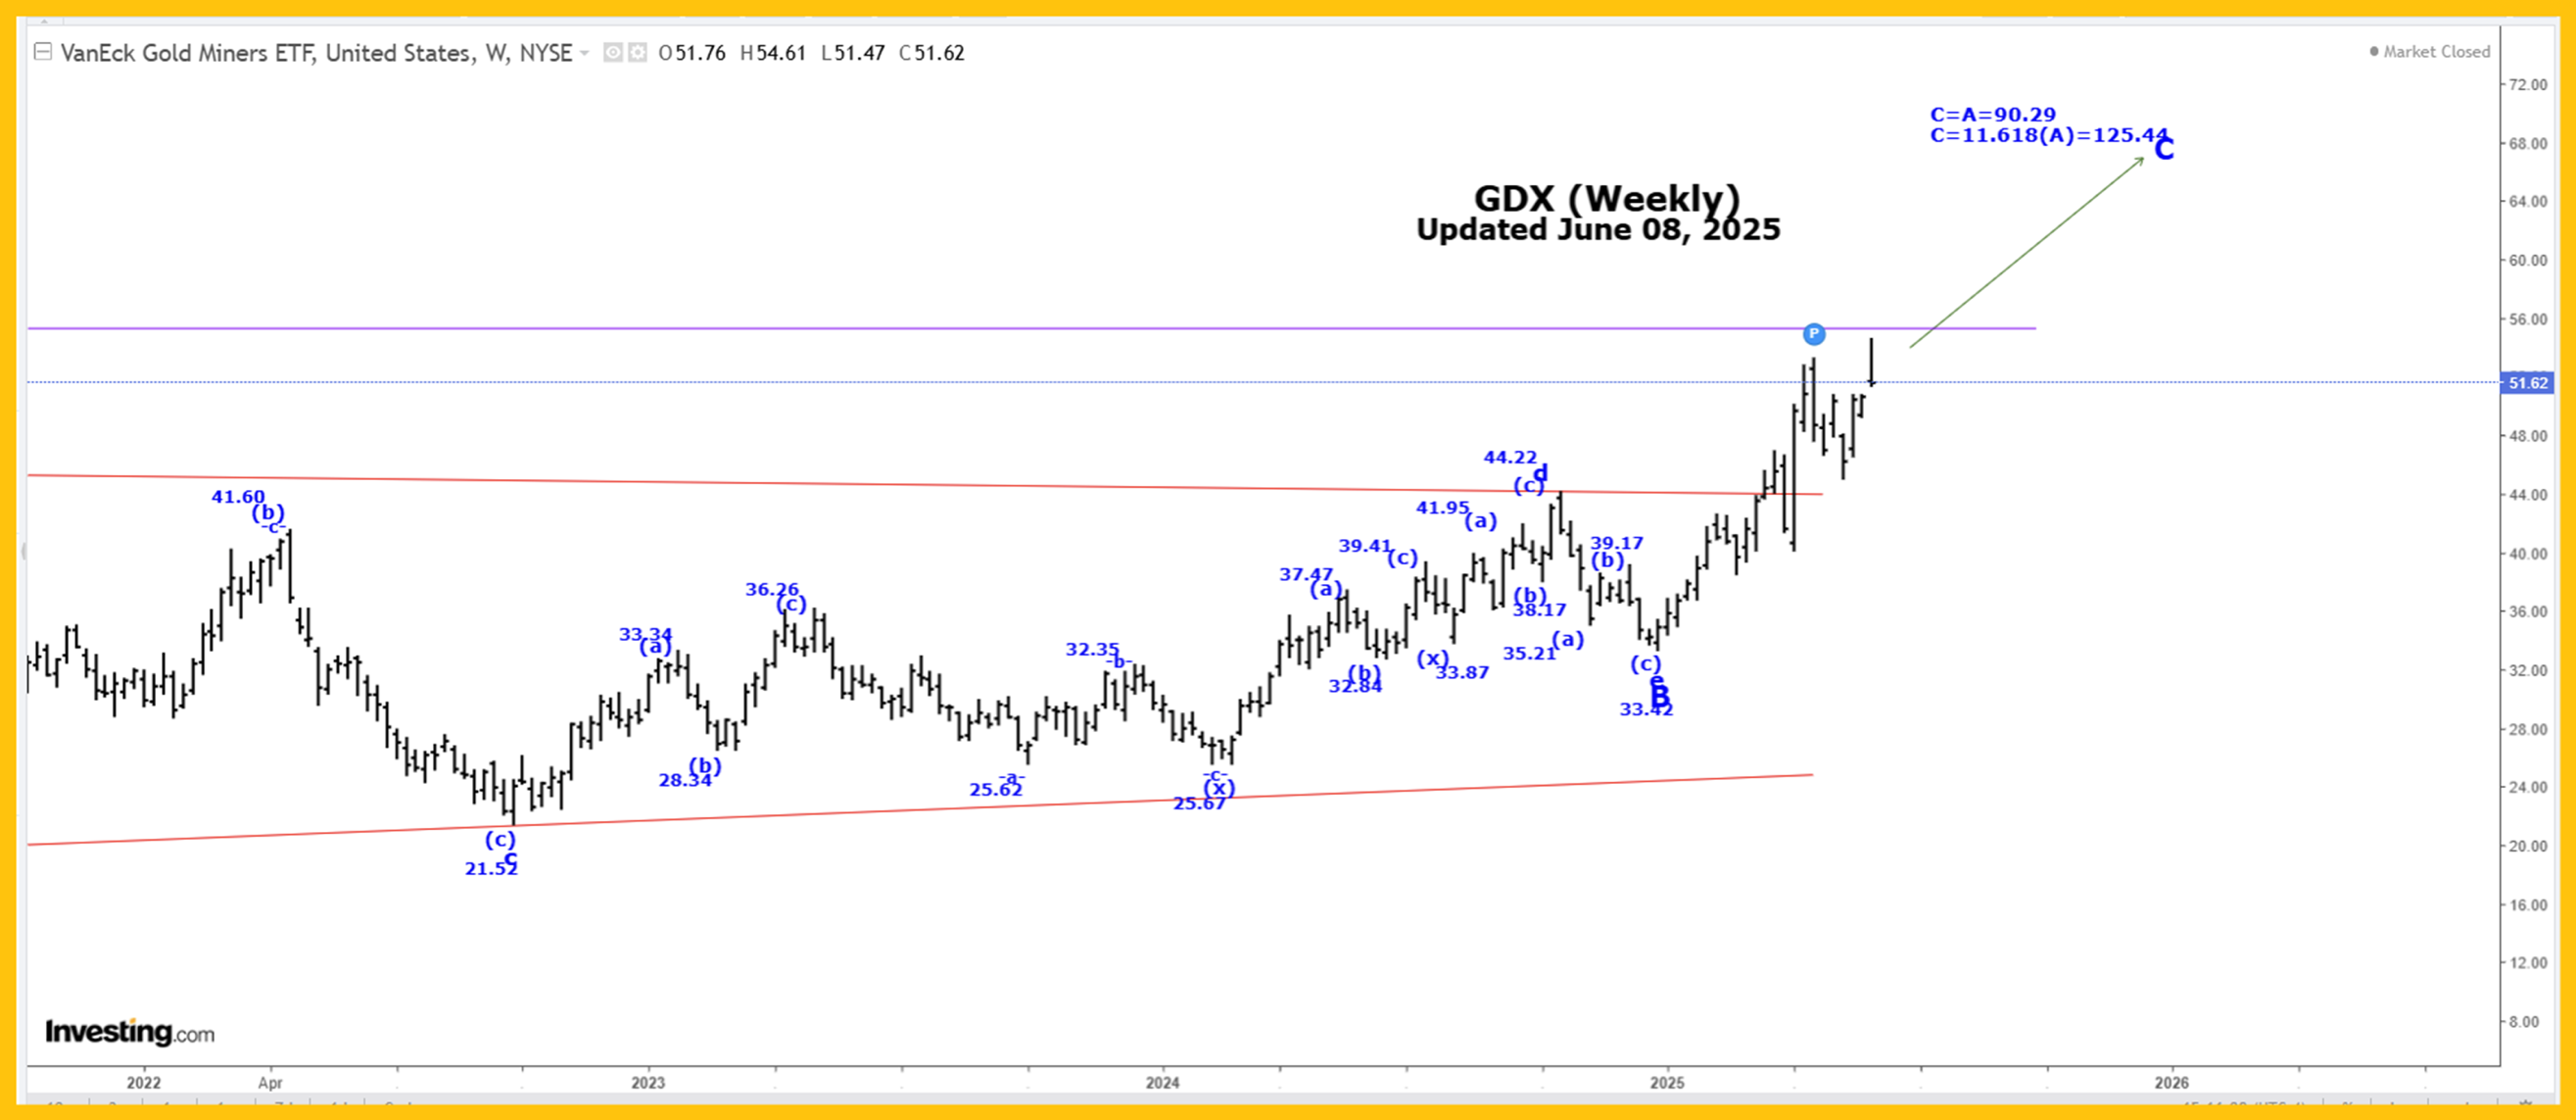
The weekly chart.
Analysis:
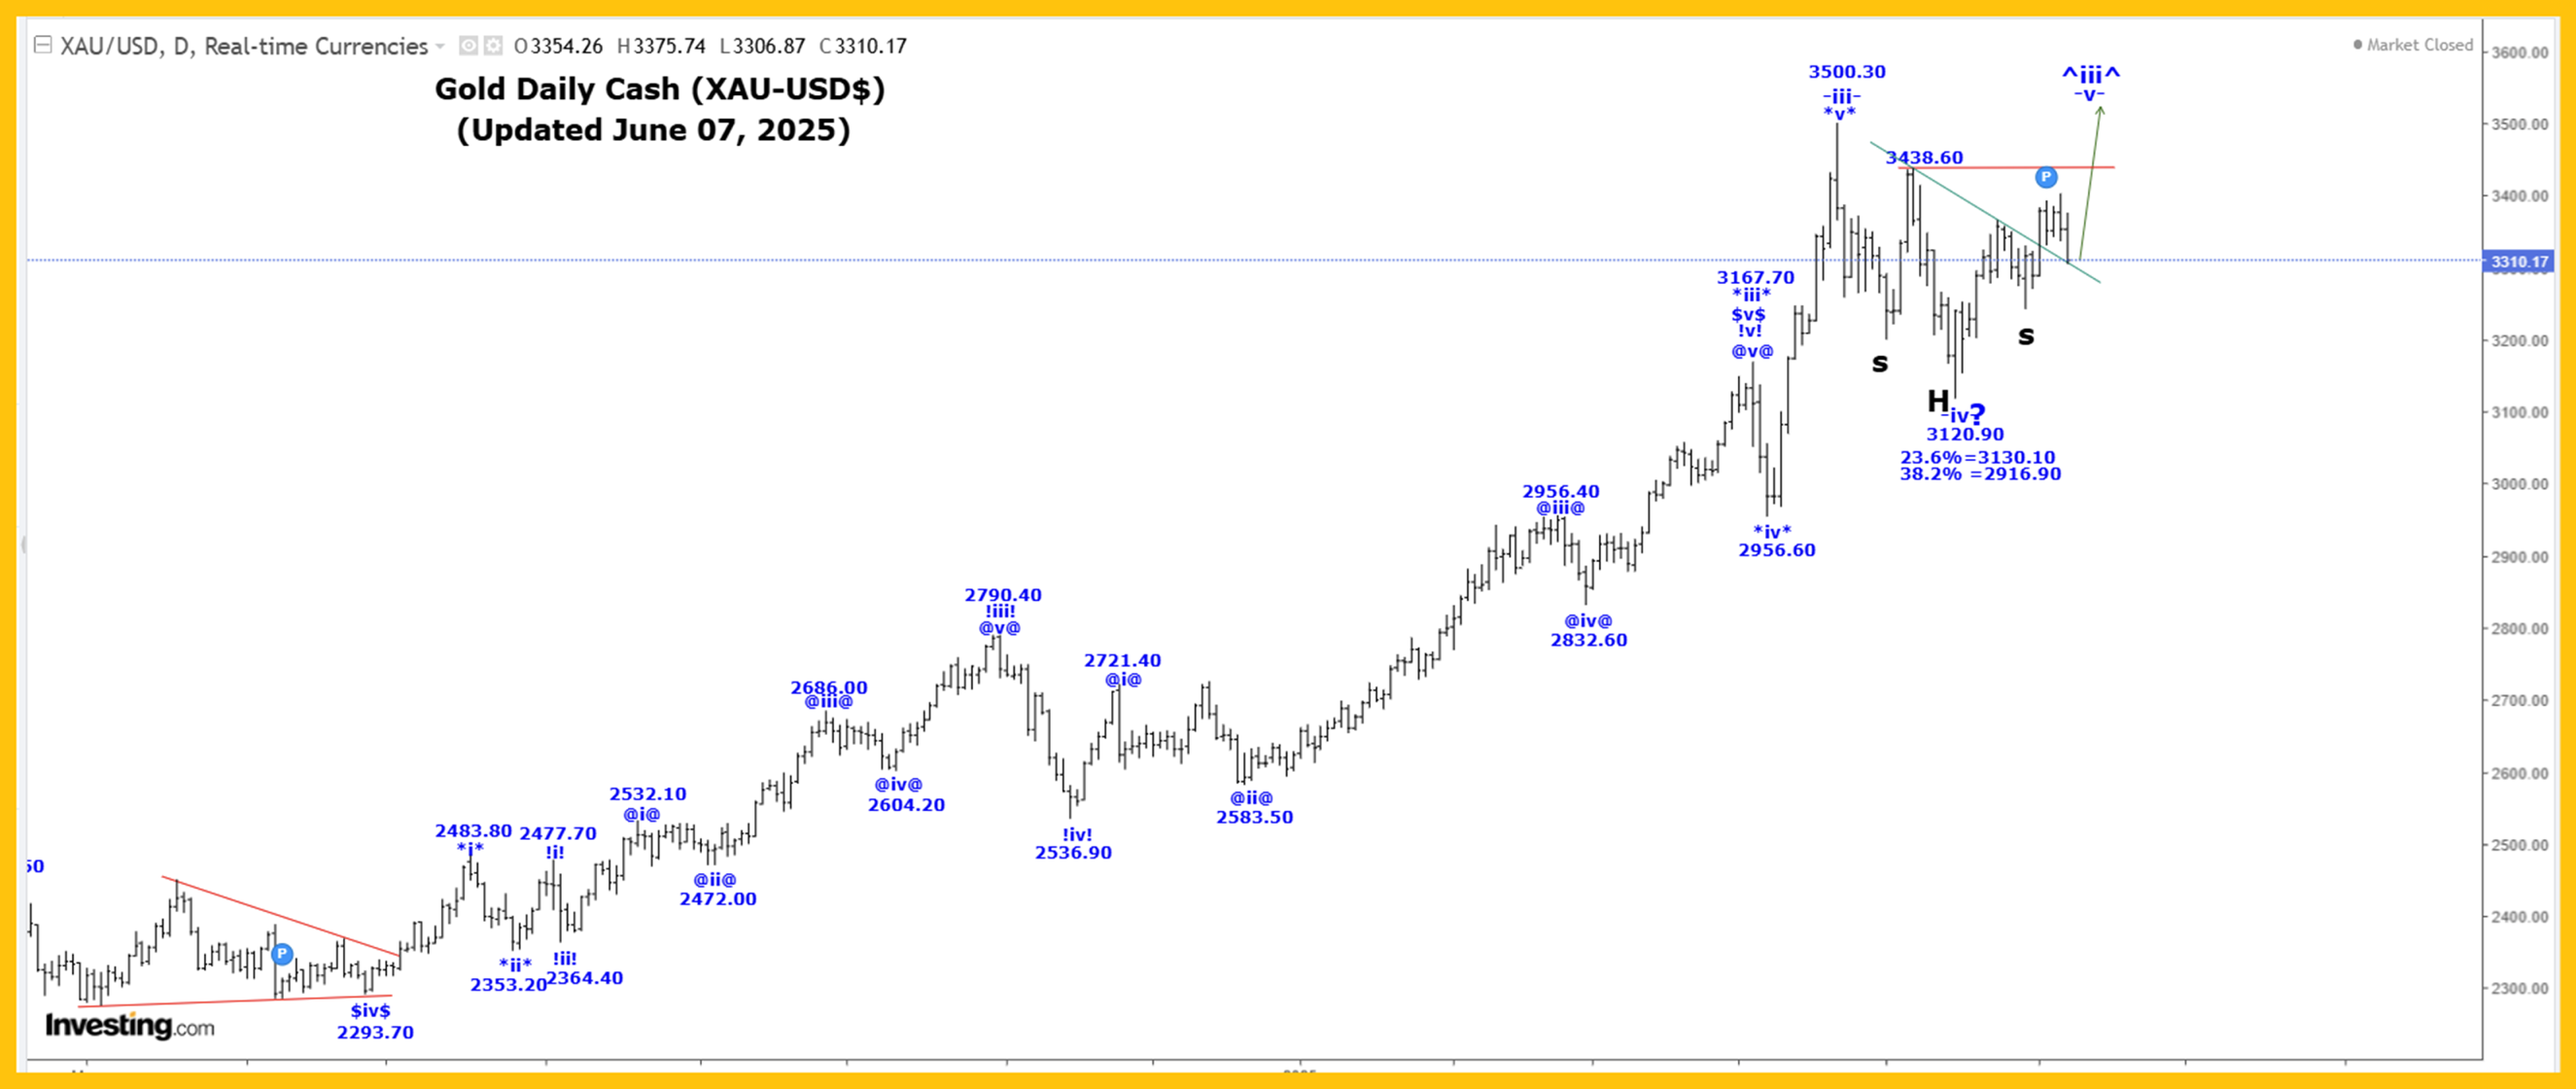
We are moving higher in a multi-year wave (3) of 3, that has a current projected endpoint of:
(3) = 1.618(1) = 4298.80.
Within wave (3), we are moving higher in wave -iii-.
Within wave -iii-, we are moving higher in wave *iii*, which has an updated projected endpoint of:
*iii* = 6.25*i* = 4660.20!
We are working on the assumption that wave *iii* is still underway, as shown on the Weekly Gold Chart, with wave $iii$ ending at the 3500.30 high.
If that is the case, then we are now falling in wave $iv$, which may be complete at the 3120.50 low, which is our 23.6% retracement level.
So, the good news is we need to be “on guard” for its completion and the start of another rally in wave $v$!
We did break above major resistance this past week, but we still cannot rule out the possibility that wave $iv$ is still underway. It may still become more complex before it ends.
Active Positions: Long with puts as stops!
Thank-you!
Captain Ewave & Crew
About the author