We wrote last week in The Impressive Long Term Purchasing Power of Gold & Silver about how brand-new Corvettes go up in price every year, but a Corvette in terms of ounces of gold and silver ounces had the same purchase price in 2020 as in 1971!
For decades General Motors have poured all their best science, technology, and labour into this sports car, and the value of silver kept pace. In both 1971 and 2020, a brand-new Corvette could be had for 3,600 ounces of silver.
This proves silver was a better currency for investors to store value than paper money. The paper cost of a Corvette moved from US$5,500 to US$68,000!
So, we know that silver is a great saving vehicle. How do we know? Because both silver and gold are better saving vehicles than paper money, especially over periods of time longer than a single year.
This is because government and banks keep inventing money and leverage so that more fiat money exists every year. No one can invent or print precious metals so they retain purchasing power while fiat money cannot.
Every time that government announces new spending or new liquidity it means they are dealing in things that can be printed to solve problems which they believe can be papered over.
Gold or Silver- Which is a Better Investment?
Either precious metal will preserve purchasing power better than fiat money can … just ask anyone from Germany. Gold and silver move together against paper money; thus, we say silver and gold correlates to each other. But is silver a better saving vehicle than gold?
This is a vital question for precious metal investors. The long answer is that sometimes gold is better, sometimes silver is better, and below we explain how to tell. Essentially when the correlation or ratio between silver and gold is at historically extreme levels, it’s best to buy both metals, but buy more of the cheaper metal.
For thousands of years of human history gold and silver have competed with each other to be used as money and be used as a savings vehicle.
Today we can look back over time to see the price, or ratio, at which silver traded in comparison to gold.
This look back is exactly the same idea as measuring Corvettes in ounces of silver, but we measure gold in ounces of silver [or silver in ounces of gold, it’s the same thing].
Gold/Silver Ratio: What is it and Why We Must Care
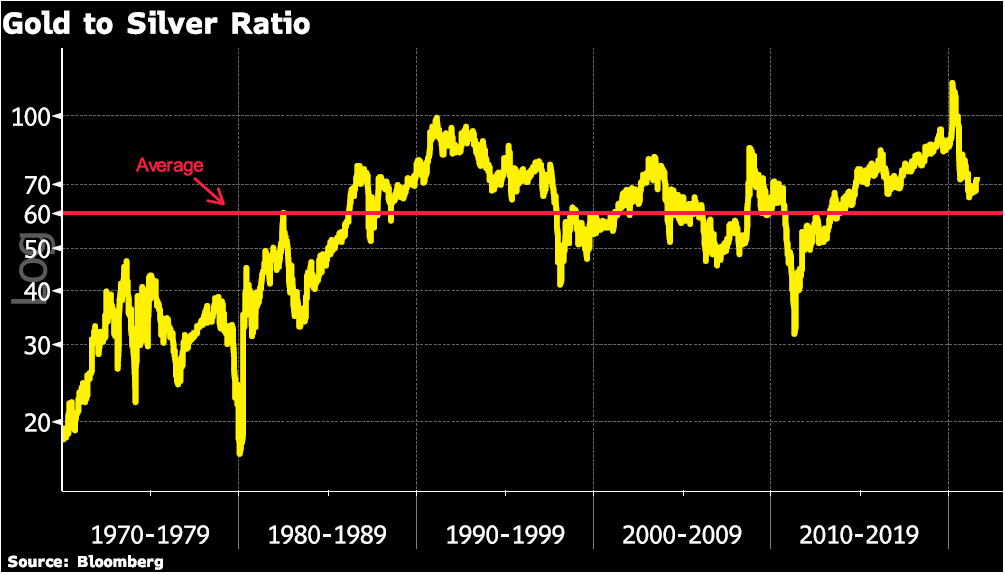
Below is a chart of silver against gold for the past 50 years. Keep in mind, this chart begins in the period of time when gold was still mandated against the US dollar, but silver was not.
So, it’s fair to expect gold to climb against silver for the first 15 years, starting from levels that are unlikely to ever be repeated.
We show a straight line on the chart at 63 ounces of silver per ounce of gold, the calculated average price of silver against gold for the 50 years shown.
Today silver looks super cheap against gold on this chart. We can see that it currently takes 75 ounces of silver to equal a single gold ounce. During the COVID crisis, it was best to buy both metals since so much fiat money was printed. However, it was also super smart to buy even more silver because 120 ounces of silver was equal to one ounce of gold.
Why does silver get to these extreme values against gold? Well, the two metals certainly have a correlation or relationship like brothers, but one brother is into Etsy and the other is into meditation, so different things get them excited.
Silver is like an Etsy maker.it’s so much more tied to industrial production, it is used in appliances, cars, healthcare, science etc. But gold is more like a patient meditator who is aware its role in the universe is to reflect others. So gold reacts to the panics of fiat money.
During COVID we see that silver went way down compared to gold because of both
A) the economy shut down so industrial demand for silver dropped and
B) many investors began to worry about governments printing fiat money so they moved into physical gold.
It looks like a great plan to buy silver faster than gold. When silver is priced worse than 80 ounces of gold and combine that idea with buying silver slower than gold when silver is priced at 40 ounces or less per ounce of gold.
Gold to Silver Ratio Chart
GOLD PRICES (USD, GBP & EUR – AM/ PM LBMA Fix)
01-09-2021 1813.90 1811.80 1318.89 1314.82 1535.10 1530.61
31-08-2021 1814.30 1814.85 1317.18 1316.49 1534.17 1534.82
27-08-2021 1795.50 1798.50 1310.72 1307.15 1527.61 1525.67
26-08-2021 1783.80 1786.60 1298.43 1302.43 1516.23 1520.04
25-08-2021 1794.70 1788.70 1307.80 1303.60 1527.29 1521.83
24-08-2021 1802.95 1808.45 1314.71 1318.00 1536.29 1538.63
23-08-2021 1786.90 1802.00 1308.19 1315.82 1524.23 1536.57
20-08-2021 1782.95 1779.05 1309.58 1305.47 1527.10 1523.58
19-08-2021 1788.20 1782.05 1307.89 1301.79 1530.16 1523.30
18-08-2021 1788.10 1783.45 1300.13 1295.32 1525.61 1522.00
Buy gold coins and bars and store them in the safest vaults in Switzerland, London or Singapore with GoldCore.
Learn why Switzerland remains a safe-haven jurisdiction for owning precious metals. Access Our Most Popular Guide, the Essential Guide to Storing Gold in Switzerland here
About the author

Chief Executive Officer
I am the CEO of GoldCore. We help investors buy and store gold and silver easily and cost effectively. We offer a service to purchase, sell and/or store precious metals personally or through a pension, a company or a family office.