
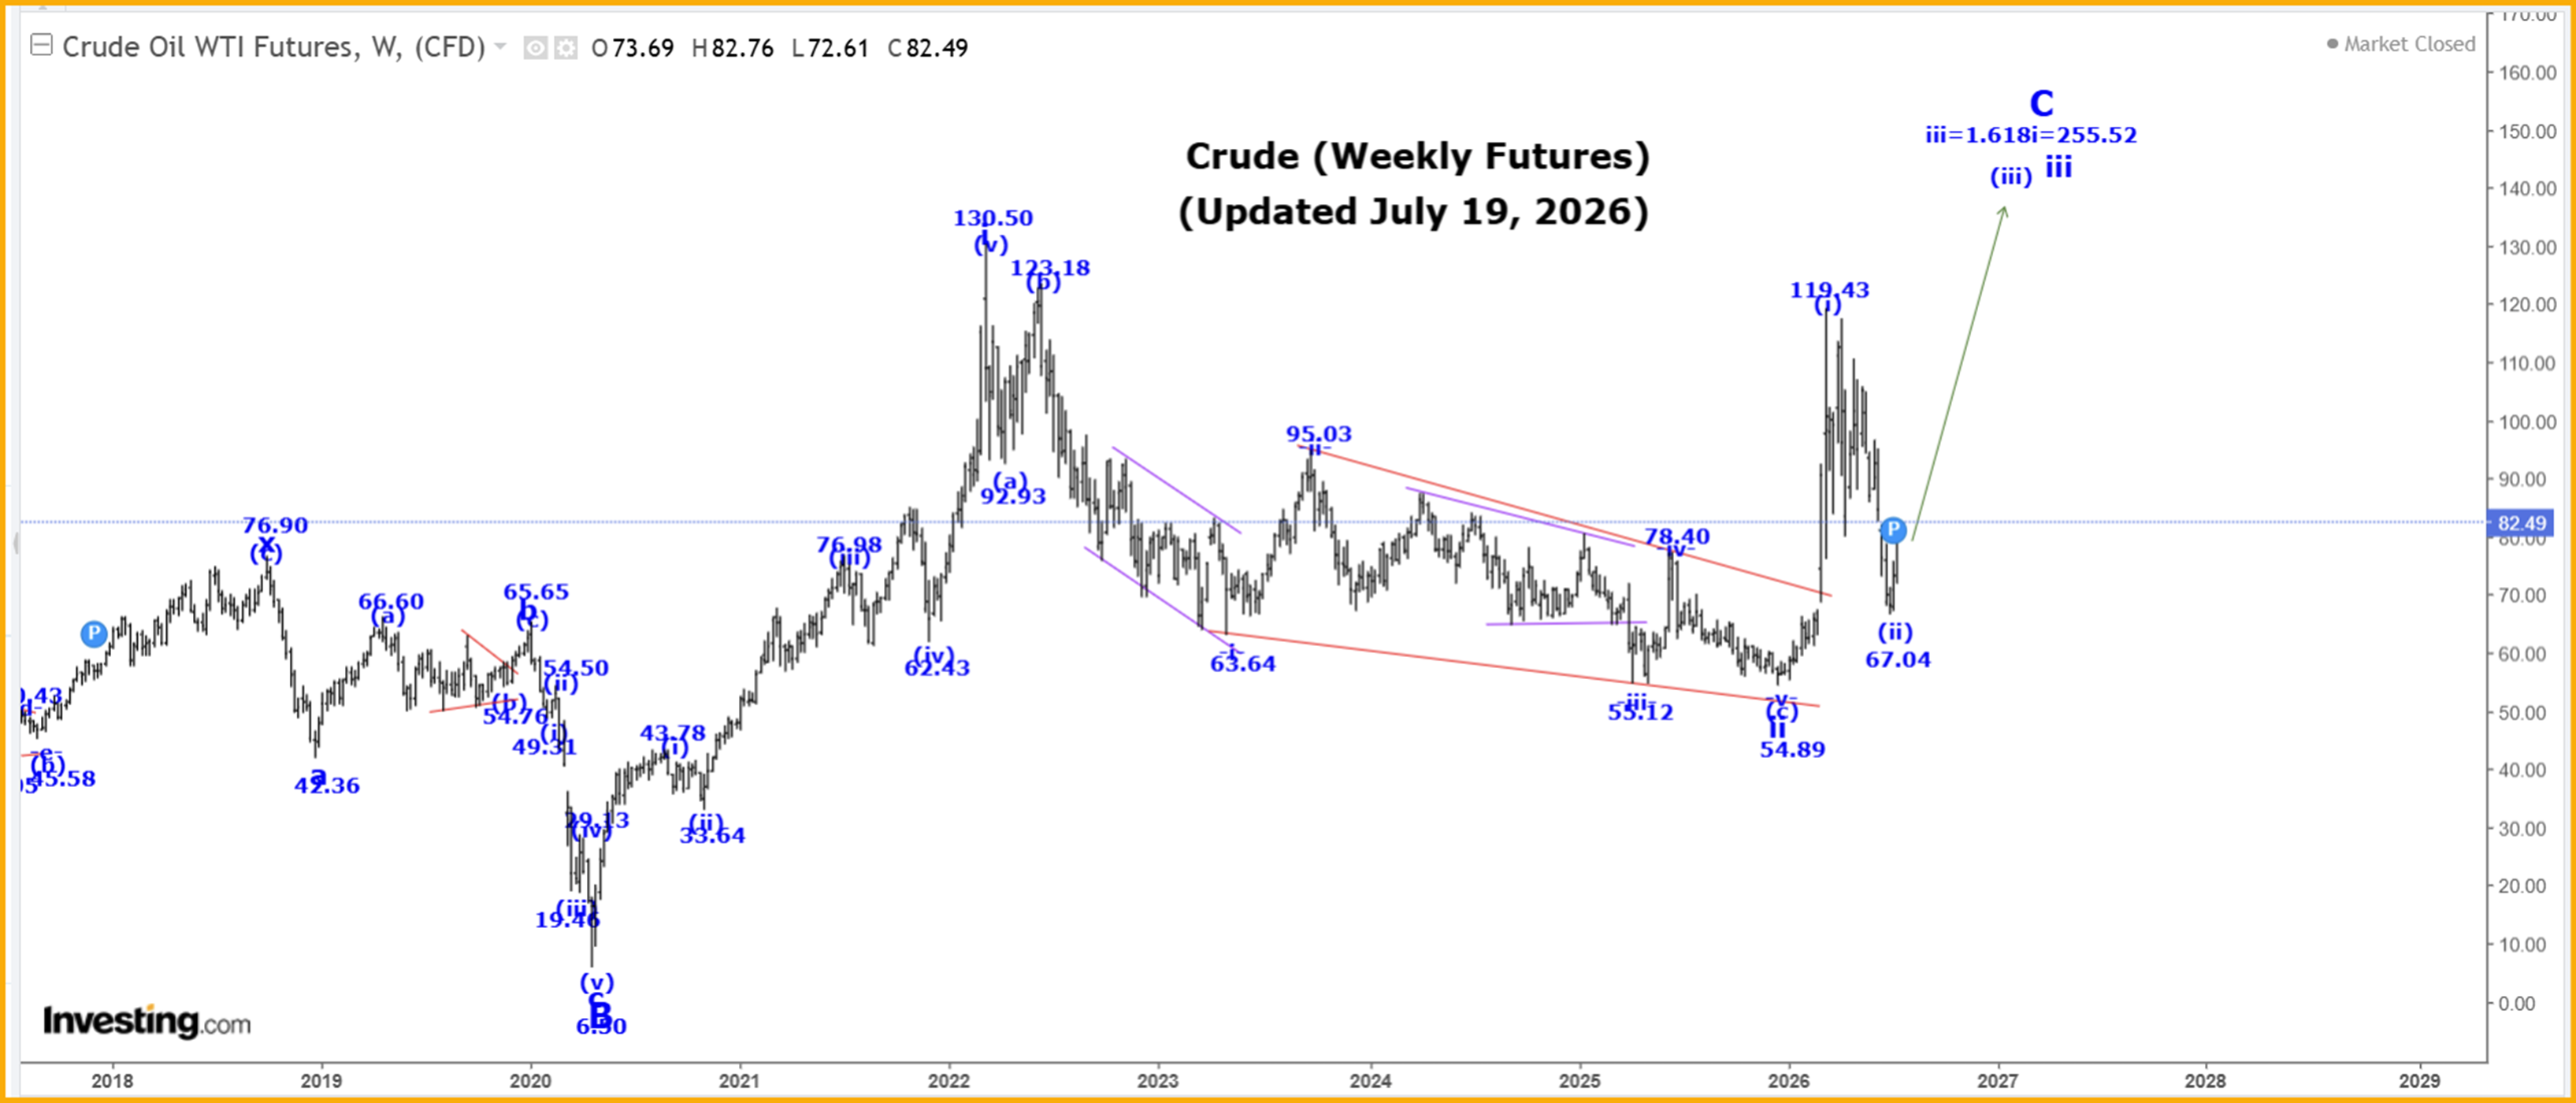

The Captain’s weekly oil price chart.
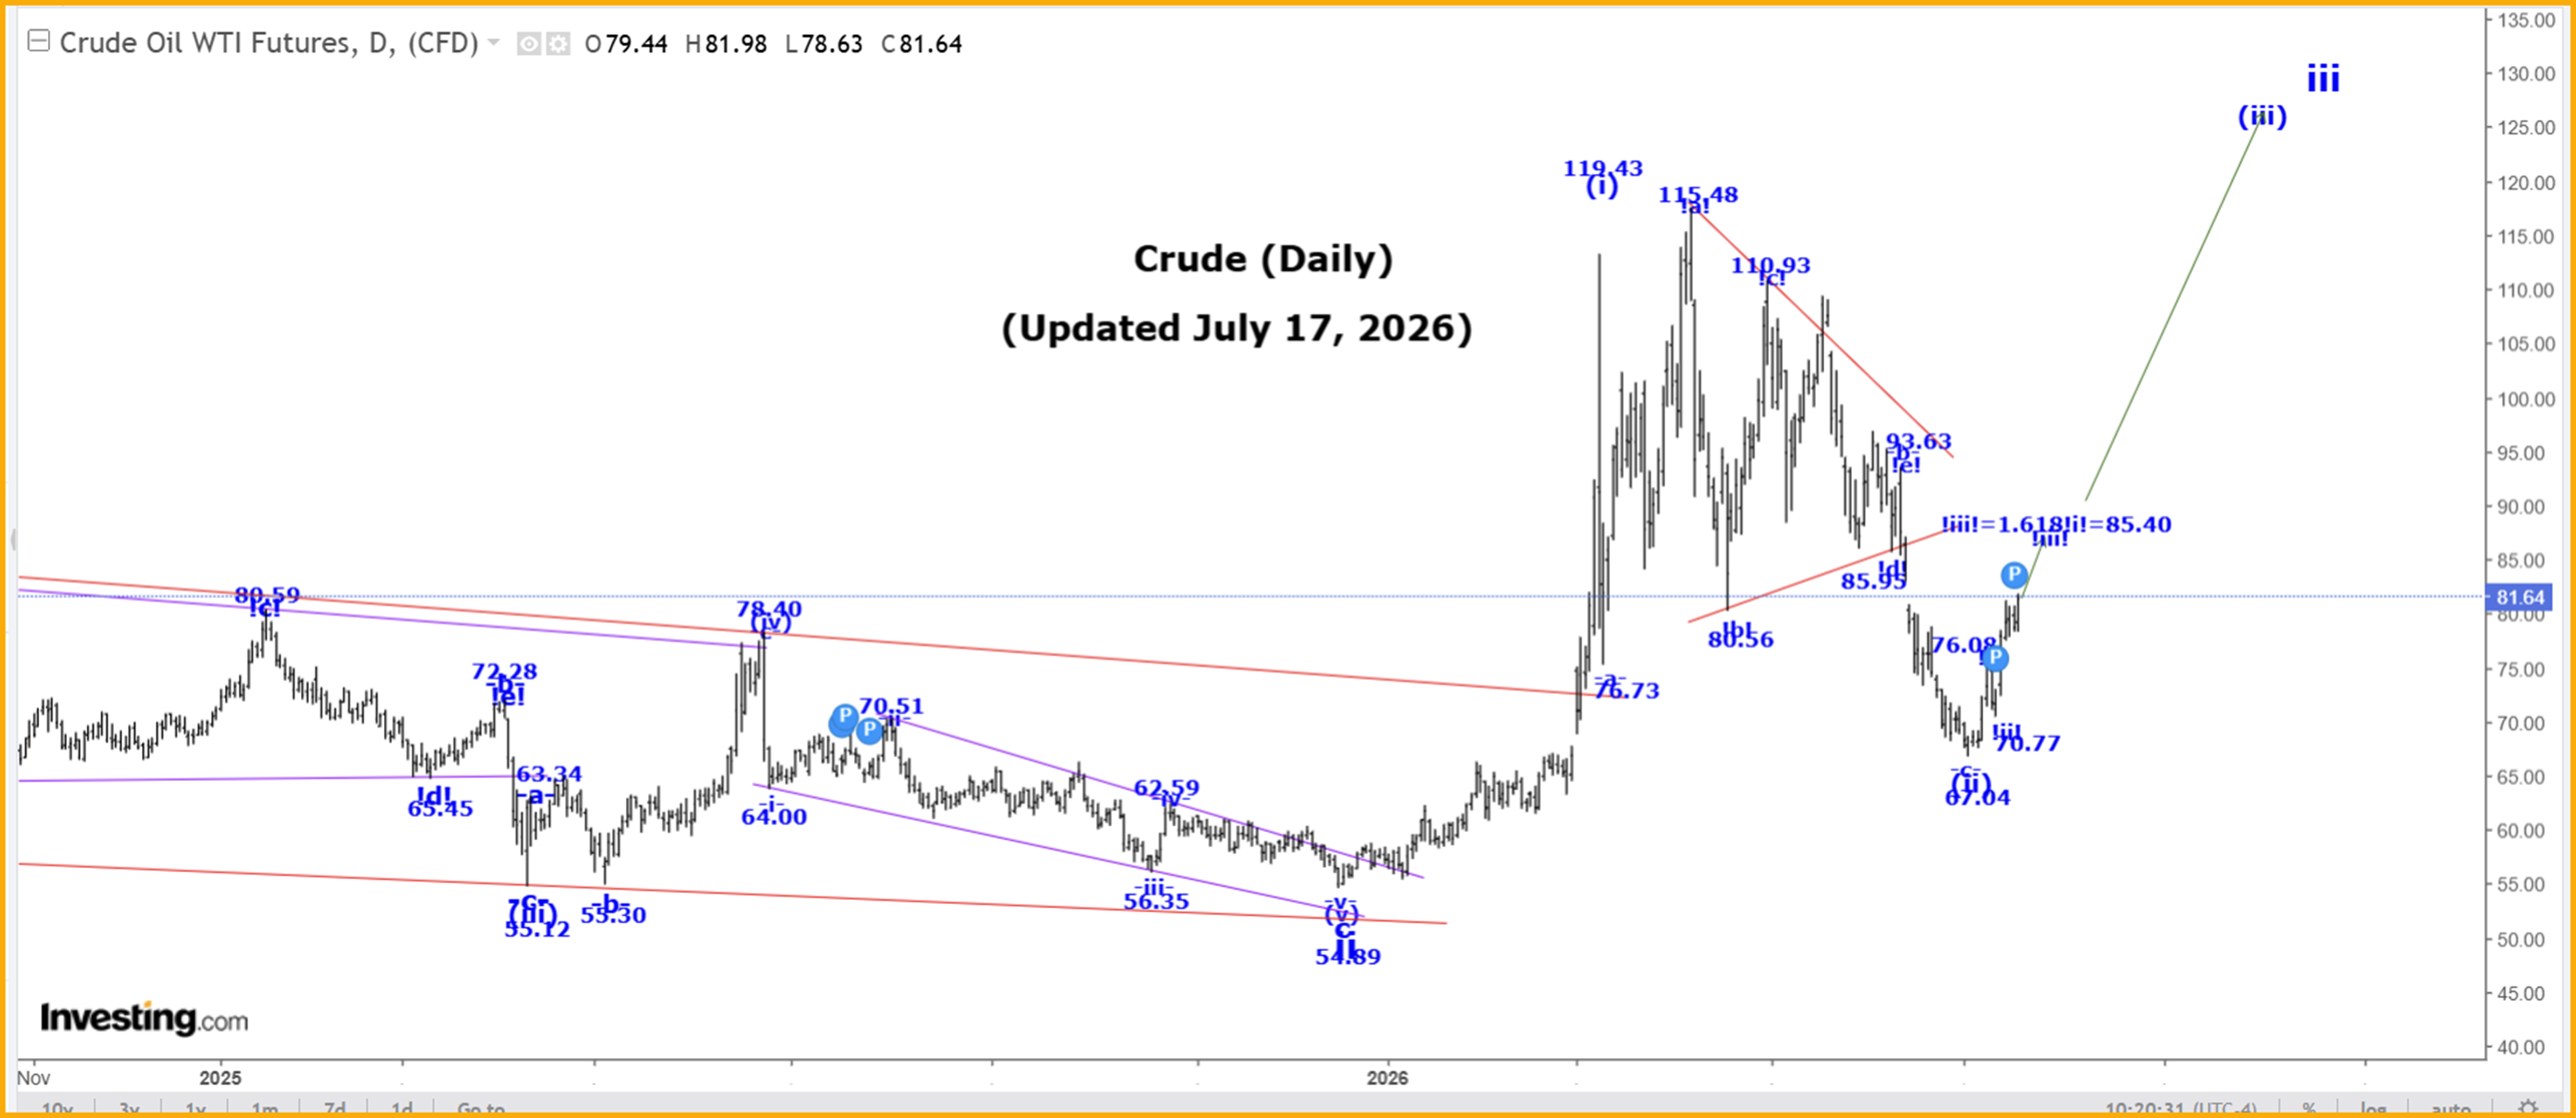
The Captain’s daily oil price chart.
Analysis:
Wave i ended at the 126.42 high and wave ii correction at the 54.89 low.
We are now moving higher in wave iii, and within wave iii, we completed wave (i) at the 119.43 high, and wave (ii) at the 67.04 low. We are now moving higher in wave (iii), which has an initial projected endpoint of:
(iii)=171.47!
Within wave (iii), we are still working on wave -i- and within wave -i-, we completed wave !i! at 76.08 and wave !ii! at 70.77 and are now moving higher in wave !iii!, which has an initial projected endpoint of:
!iii! = 1.618!i! = 85.40.
On the Intraday Chart the trading from the 81.27 high looks like a bullish triangle formation, which could be complete at the 78.58 low.
We expect higher prices as wave !iii! continues to develop.
After wave !iii! ends we expect a wave !iv! correction, that retraces between 23.6 to 38.2% of the entire wave !iii! rally.
Trading Recommendation: Go long crude with puts as a stop. Go long Suncor. Go long HOU:TSX or UCO:NYSE.
Active Positions: Long crude with puts as a stop! Long Suncor! Long HOU:TSX!
S&P500
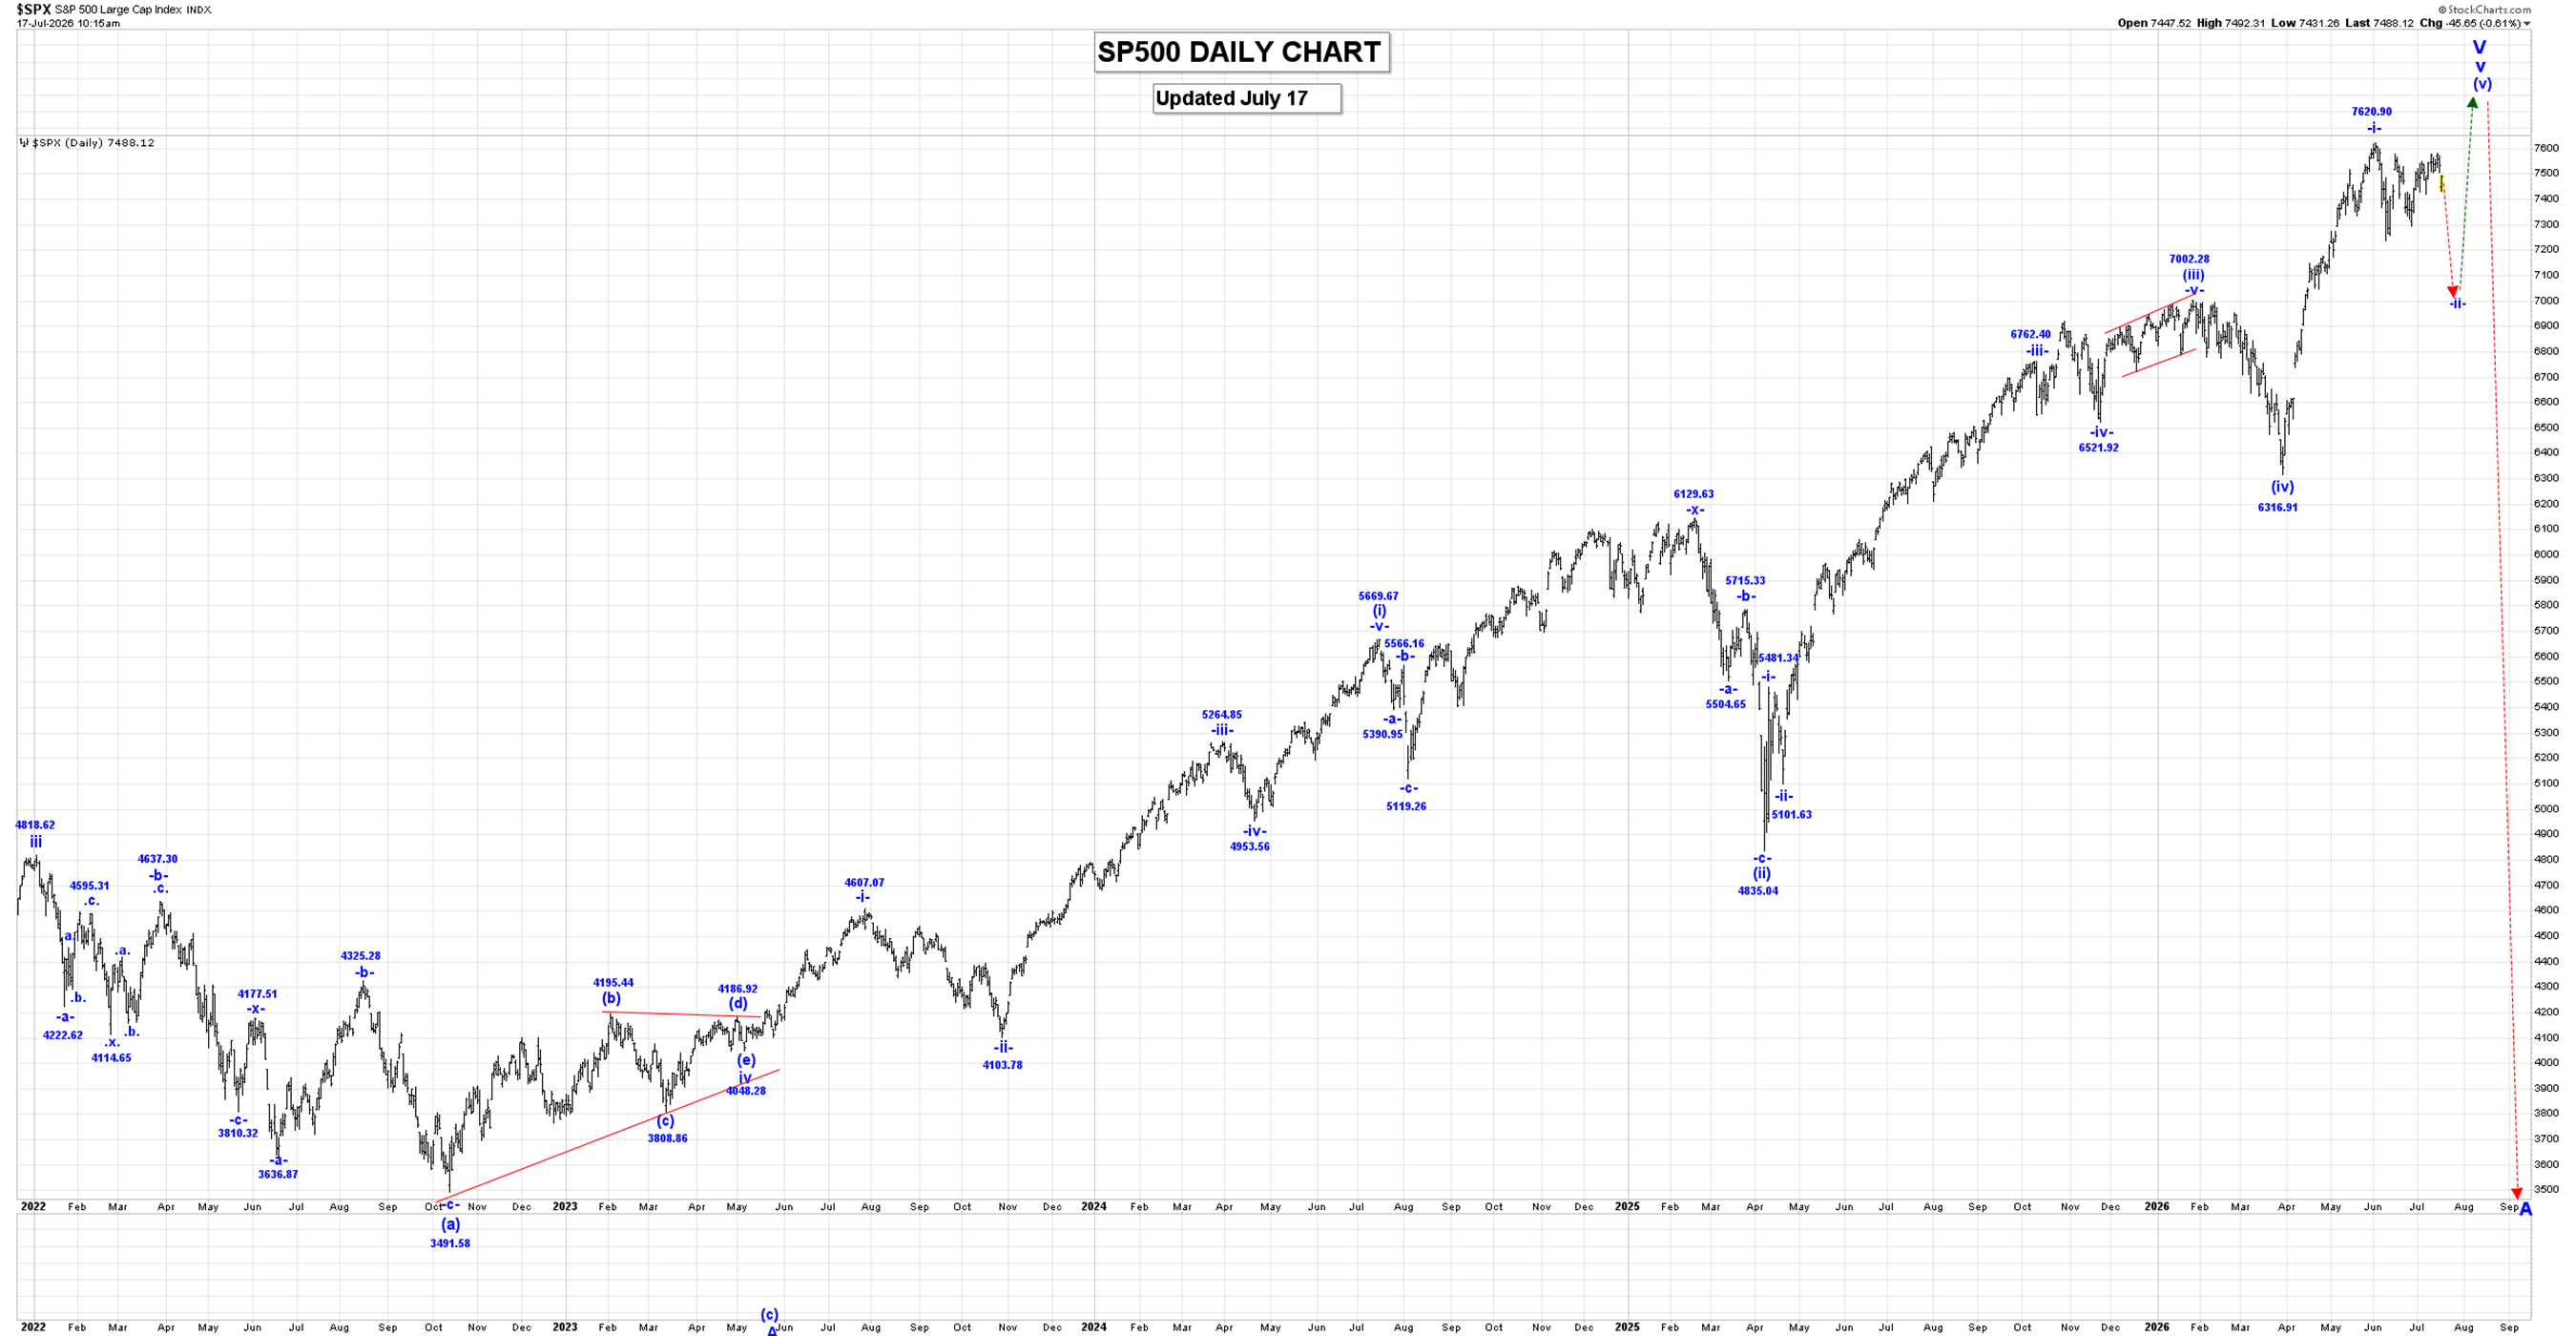
The Captain’s daily SP500 chart.
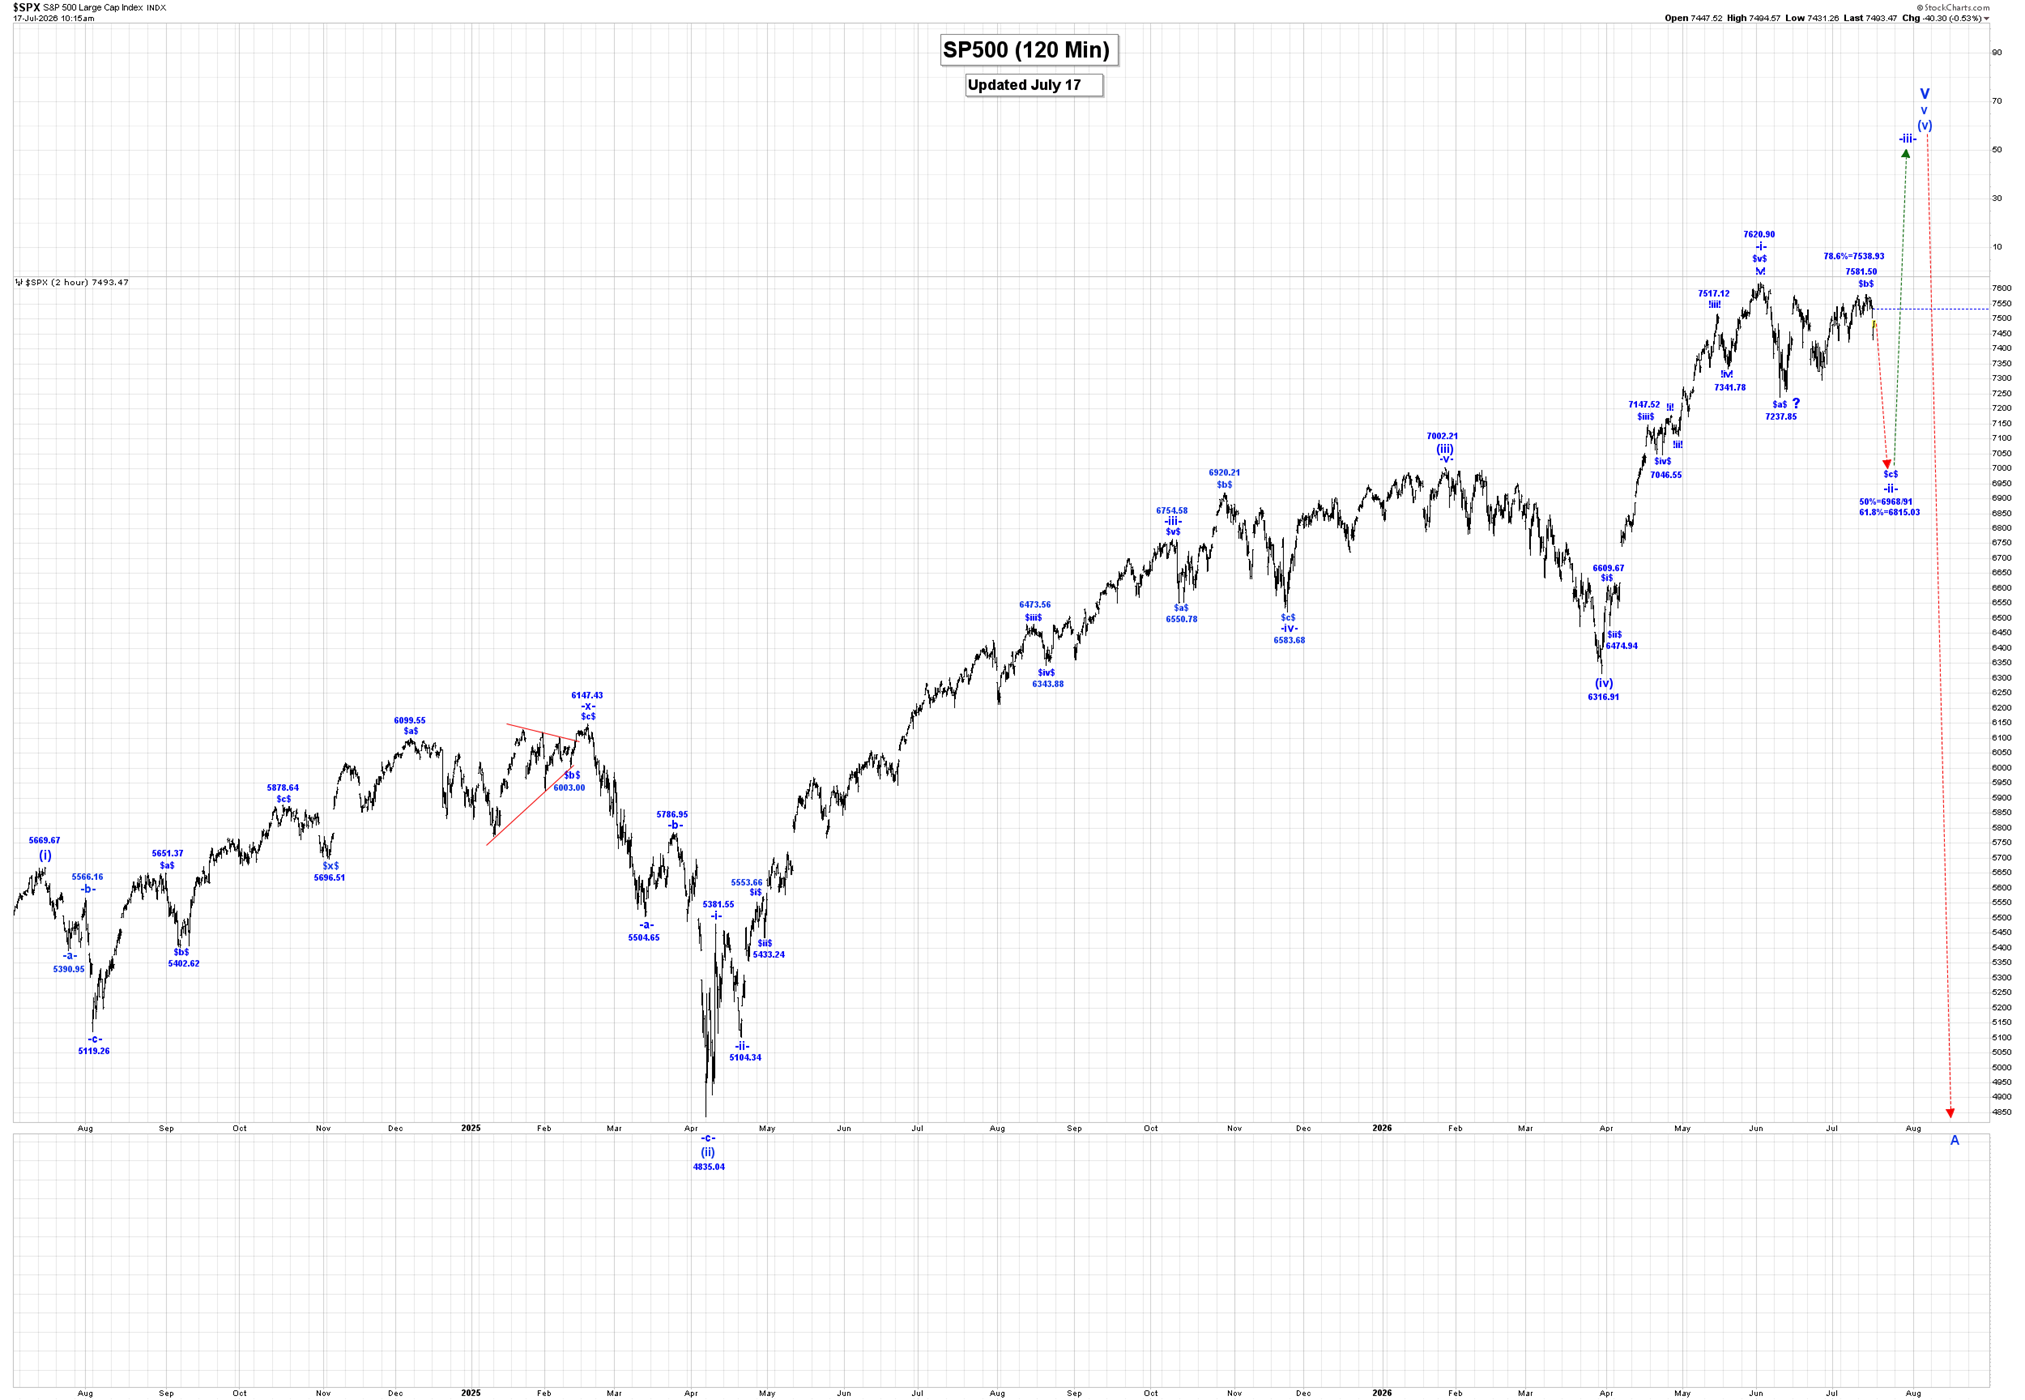
The Captain’s 120Minute SP500 chart.
Analysis:
We have updated our count within all of wave v to suggest the following:
- = 5669.67.
- = 4835.04.
- = 7002.28.
- = 6316.91.
(v) = 7620.90, to complete all of wave -i-.
-ii- drop after wave -i- ends.
We are now assuming that at least all of wave -i- of (v) is complete at the 7620.90 high, and if that is the case then we are starting to move lower in wave -ii-. Our retracement levels for wave -ii- are:
50% = 6968.91.
61.8% = 6815.03.
Within wave -ii-, we likely completed wave $a$ at 7237.85, and if that is the case then we are moving higher in wave $b$, which has the following last retracement level:
78.6% = 7538.93.
We have now exceeded our 78.6% retracement level, so it looks like we could be heading to all-time new highs, with wave -ii- perhaps ending at 7235.87 low. For now though, our count stands as shown on the charts.
The other option, and an ominous one, is that all of wave (v), v and V are complete at the 7620.90 and we are starting a prolonged multi-year bear market.
Trading Recommendation: Stay flat
Active Positions: Flat!
Silver
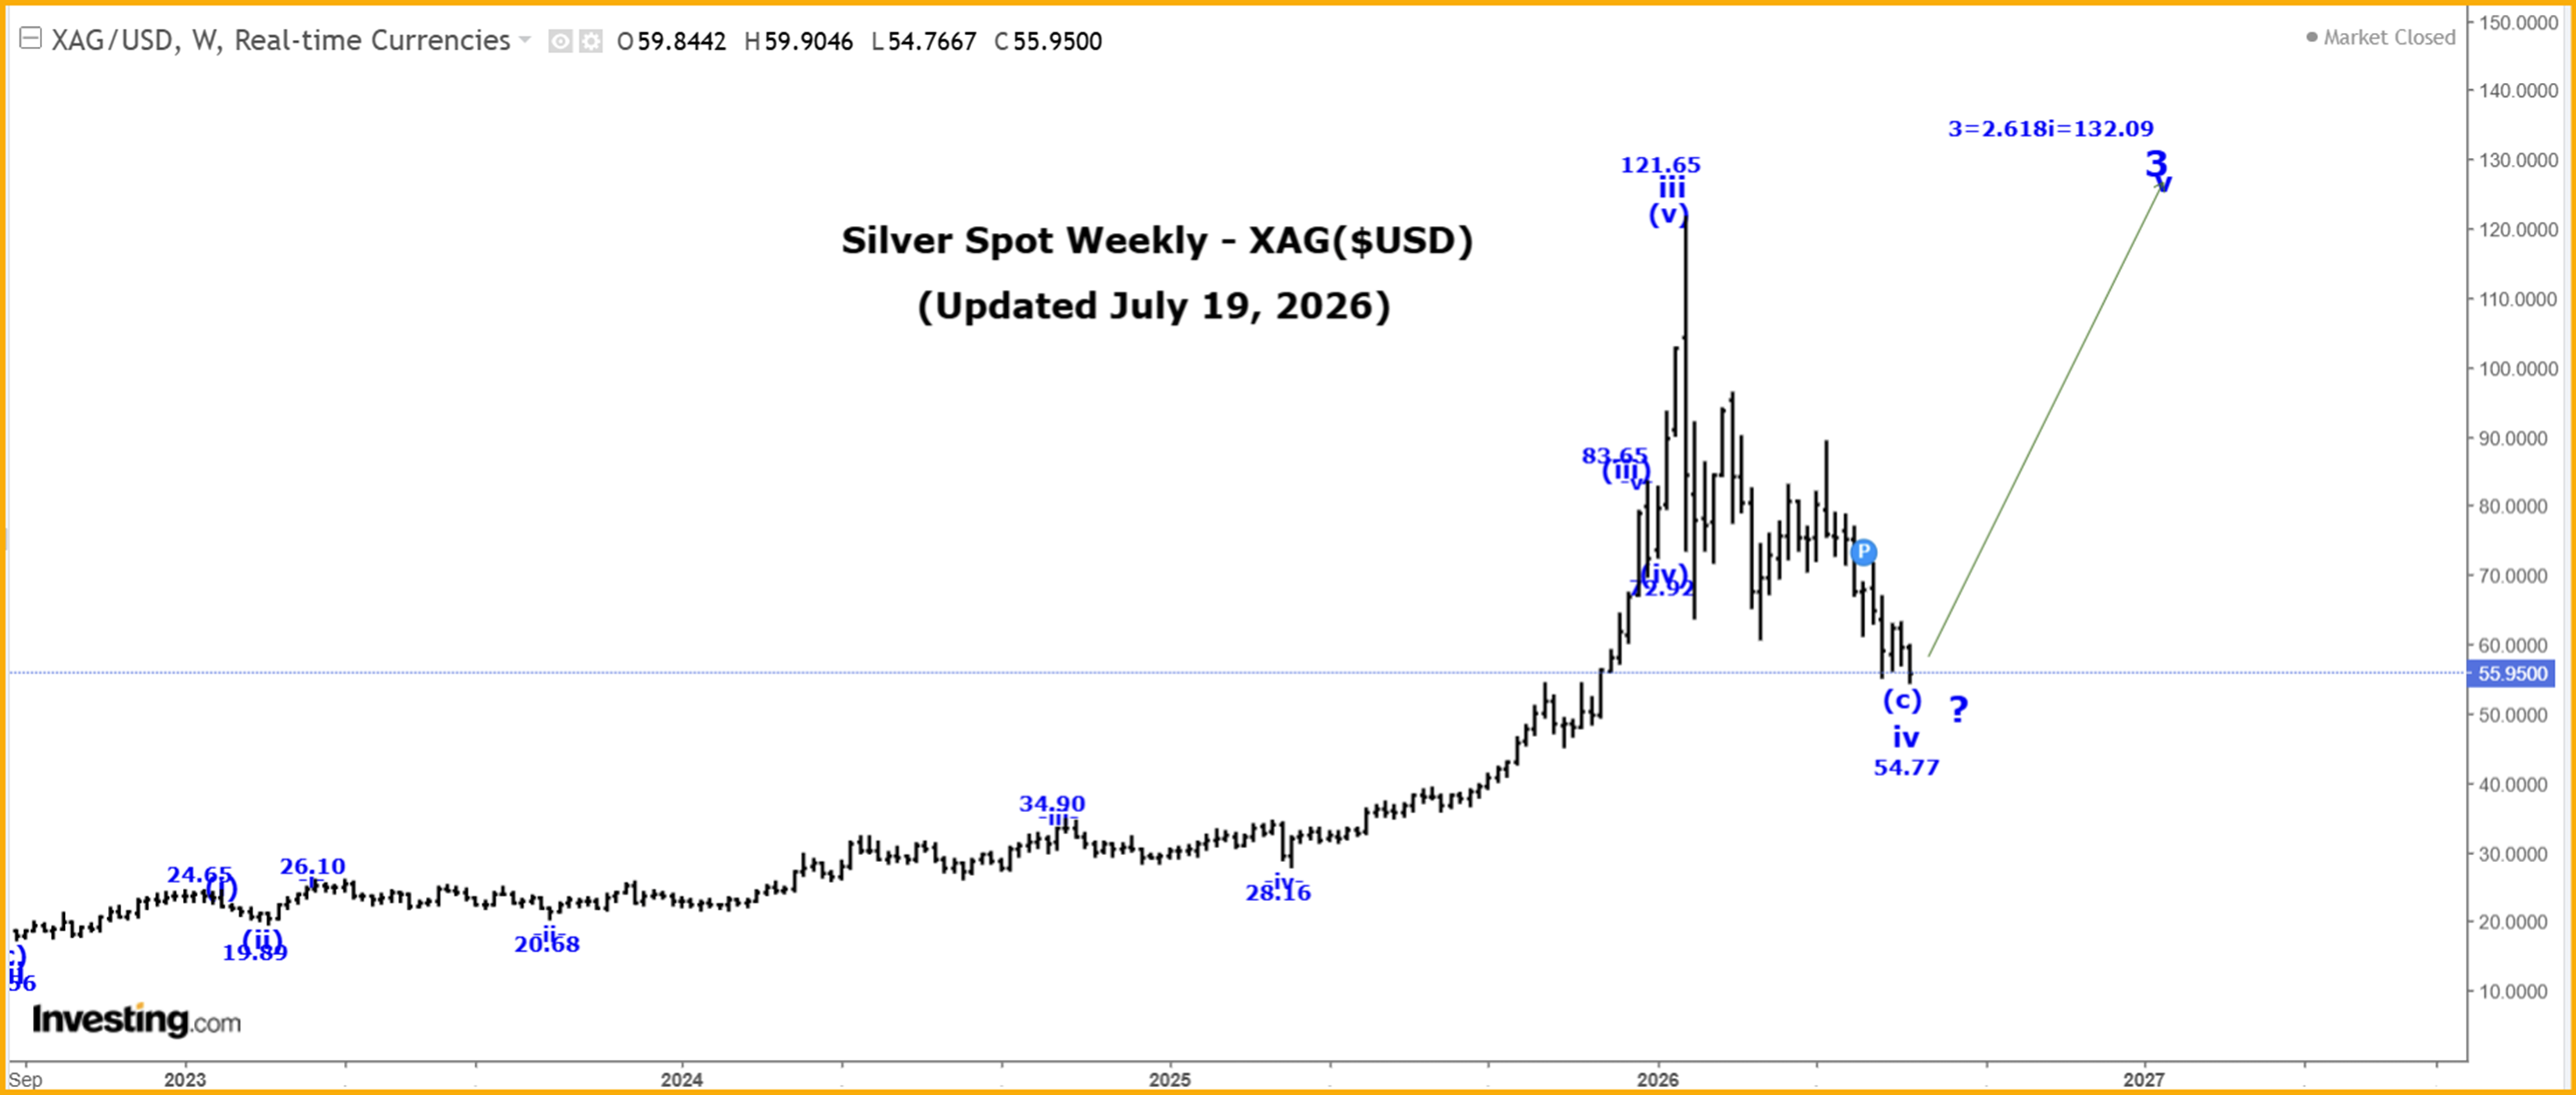
The Captain’s weekly silver price chart.
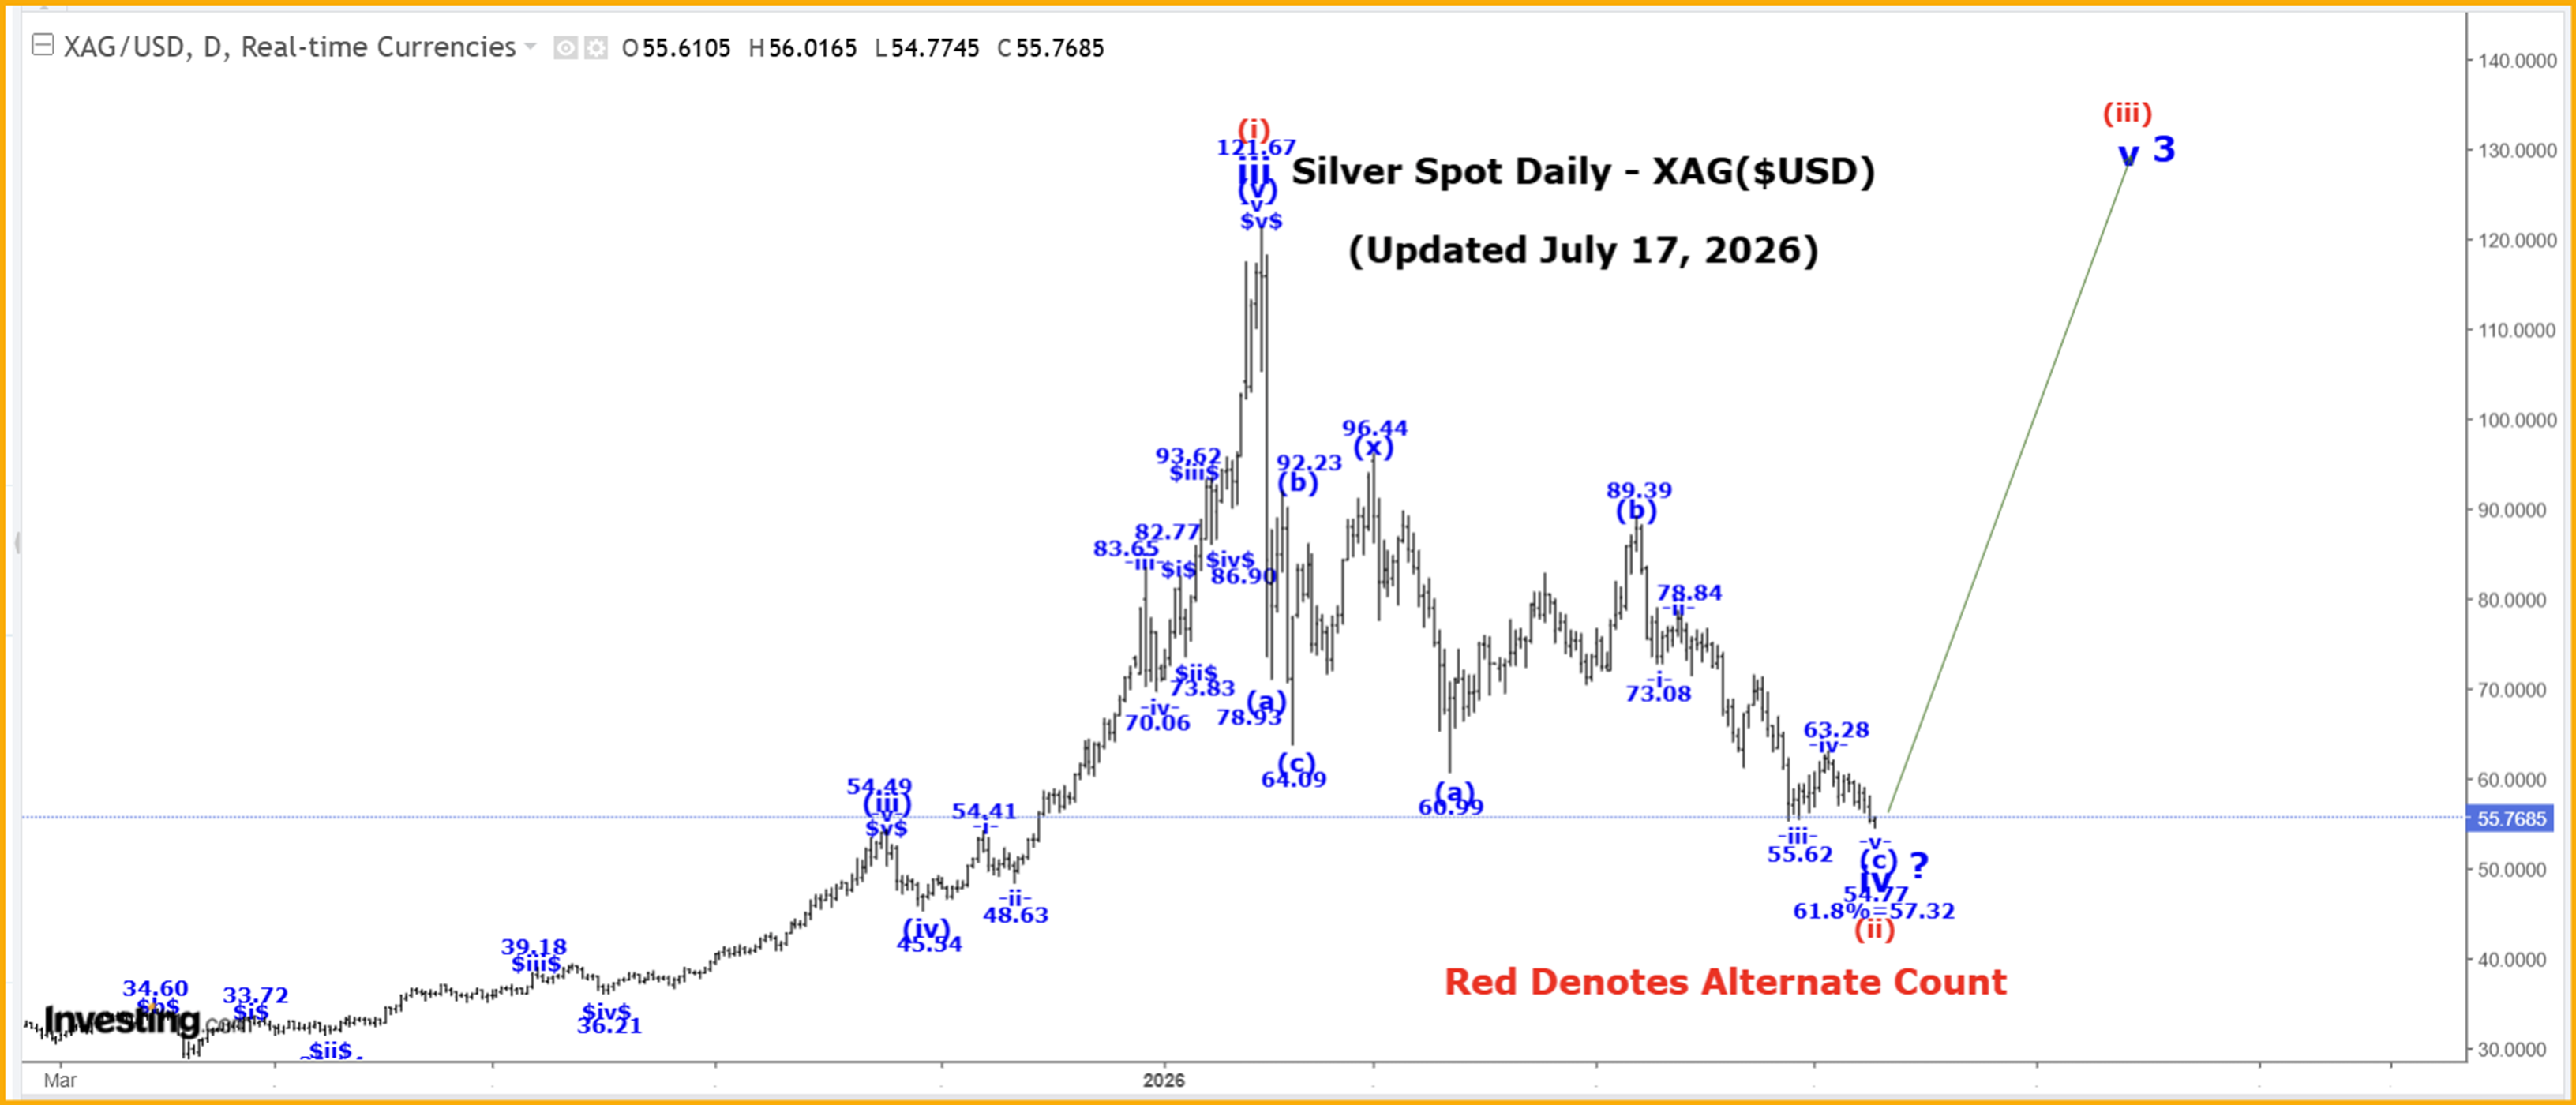
The Captain’s daily silver price chart.
Analysis:
Wave iii ended at the 121.65 high and we are now falling in a multi-month wave iv correction that has the following retracement level:
61.8% = 57.32.
Within wave iv, we cannot rule the possibly that all of wave iv is now complete at the 55.62 low, and that we have started to rally higher in wave v of 3.
The other option is that wave 3 is extending and that only wave i of 3 ended at the 121.56 high and that wave ii likely ended at the 55.62 low.
This would suggest that silver is heading well above the $300 level in wave iii of 3.
In the very long term, we completed all of wave III at 49.00 in 1980 and all of wave IV at 3.55 in 1993. We are now working on wave V and within wave V we have the following count:
1 = 49.56.
2 = 11.64,
3 projection is updated to 3 = 2.618(1) = 132.09
Active Positions: Long via PSLV:TSX and silver futures, with puts as our stops!
Thank-you!
Captain Ewave & Crew
About the author