
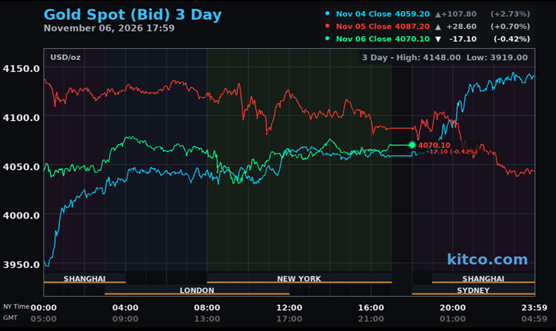
Gold's rally attempt in the first hour or so of Globex trading in New York on Thursday evening wasn't allowed to get far -- and it was then sold/engineered lower until around noon in Shanghai on their Friday. It then rallied a bit starting about 3:35 p.m. CST -- and that rally attempt was capped at 9 a.m. in London. It then had a very broad down/up move centered around the 9:30 a.m. opens of the equity markets in New York -- and ending at precisely 2 p.m. in after-hours trading. It was then sold/engineered lower for about an hour -- and then chopped a bit higher going into the 5:00 p.m. EST close.
The high and low ticks in gold were reported as $4,116.20 and $4,035.10 in the December contract...an intraday move of $81.10 an ounce. The December/ February price spread differential in gold at the close in New York yesterday was $32.60...February/April was $32.20...April/June was $33.90 -- and June /August27 was $34.30 an ounce.
Gold was closed on Friday afternoon in New York at $4,070.10 spot...down $16.70 on the day -- and $35.80 off its Kitco-recorded engineered high tick. Net volume was very light at a bit over 134,000 contracts -- and there were a bit under 44,000 contracts worth of roll-over/switch volume on top of that ...with noticeable amounts into every scheduled delivery month in 2027.
I saw that 73 gold, plus 6 silver contracts were traded in November yesterday and, as is always the case, it remains to be seen just how much of these amounts show up in tonight's Daily Delivery and Preliminary Reports further down in today's column.
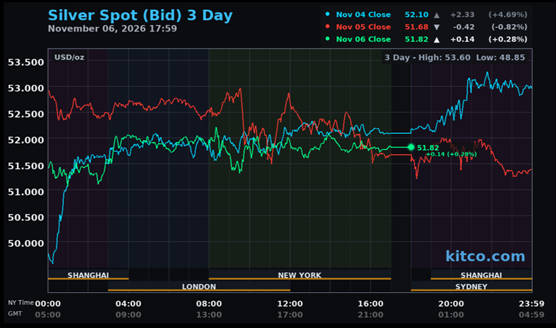
Silver's price path in early Globex trading was similar to gold's -- and its low tick was set around 3:30 p.m. in Shanghai on their Friday afternoon. Its ensuing rally attempt ran into 'da boyz' around 8:20 a.m. in Globex trading in London. From that juncture it was forced to chop quietly and unevenly sideways to a bit lower for the rest of the Globex/COMEX trading session.
The high and low ticks in it were recorded by the CME Group as $52.375 and $51.20 in the December contract...an intraday move of $1.175 an ounce. The December/March price spread differential in silver at the close in New York yesterday was 62.8 cents...March/May was 45.7 cents -- and May/July27 was 44.7 cents an ounce.
Silver was closed in New York on Friday afternoon at $51.82 spot...up 16 cents on the day -- and 43 cents off its Kitco-recorded high tick. Net volume in it was just above fumes & vapours at a bit under 32,000 contracts -- and there were about 17,300 contracts worth of roll-over/switch volume out of December and into future months in this precious metal...mostly March and May27.

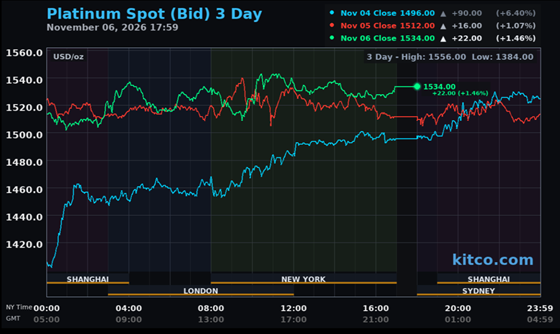
Platinum was forced to wander very broadly, quietly and unevenly sideways to a bit higher during the entire Globex/COMEX trading session on Friday -- and it closed up 22 bucks on the day at $1,534 spot...12 dollars off its Kitco-recorded high tick.
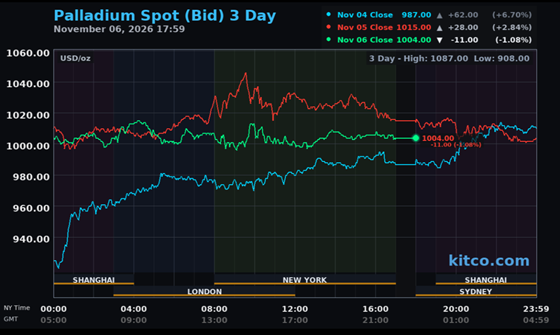
The only difference between platinum and palladium was that it was forced to wander very broadly, quietly and unevenly sideways to a bit lower during the entire Globex/COMEX trading session on Friday -- and it was closed down 12 dollars on the day at $1,004 spot -- and 19 bucks off its Kitco-recorded high tick.
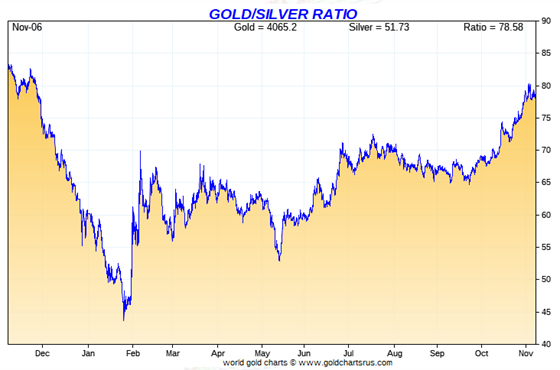
Based on the kitco.com spot closing prices in gold and silver posted above ...the gold/silver ratio worked out to 78.2 to 1 on Friday...compared to 79.1 to 1 on Thursday.
Here's the 1-year Gold/Silver Ratio chart from Nick Laird -- and updated with this past week's data. Click to enlarge.
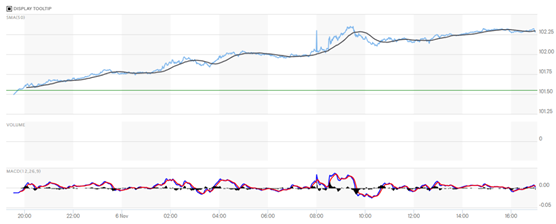
The dollar index closed very late on Thursday afternoon in New York at 101.55 -- and then opened lower by 6 basis points once trading commenced at 7:33 p.m. EST on Thursday evening...which was 8:33 a.m. China Standard Time on their Friday morning. It then proceeded to wander very quietly and broadly higher until around 9:17 a.m. in New York. Then, starting at 9:30 a.m. EST, it edged a bit lower until 10:30 a.m. From that juncture it crawled very quietly higher until 2:50 p.m. EDT -- and didn't do anything after that.
The dollar index finished the Friday trading session in New York at 102.28...up 73 basis points from its close on Thursday.
Here's the DXY chart for Friday...thanks to marketwatch.com as usual. Click to enlarge.
Here's the 6-month U.S. dollar index chart...courtesy of stockcharts.com as always. The delta between its close...102.28...and the close on DXY chart above, was zero basis points. Click to enlarge.
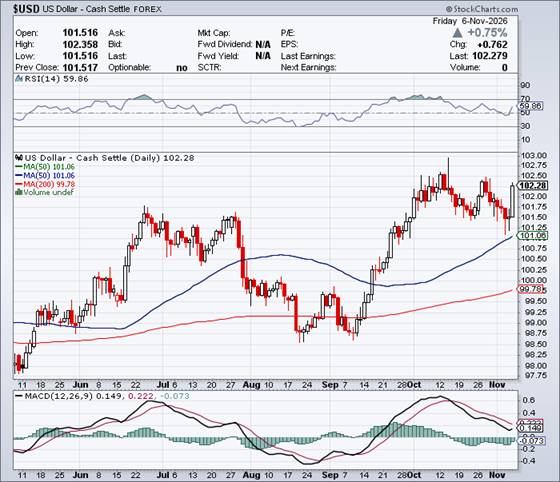
It was obvious that the big rally in the dollar index didn't have any effect in the price patterns of the precious metals on Friday.
U.S. 10-year Treasury: 4.8590%...up 0.0220/(+0.45%) as of the 1:59:56 p.m. CST close
The yield on the ten-year hit 4.9000% at 8:32 a.m. EST on Friday morning on that non-farm payroll number, but then the Fed/Treasury got the yield down to about 4.8230% at 11:37 a.m. CST/12:37 p.m. EST...but it then edged quietly higher until the market closed.
The yield on the 10-year Treasury was down 7.00 basis points on the week -- and with yield curve control in full force, I'll dispense the 40+ year chart for it...as it's now meaningless.

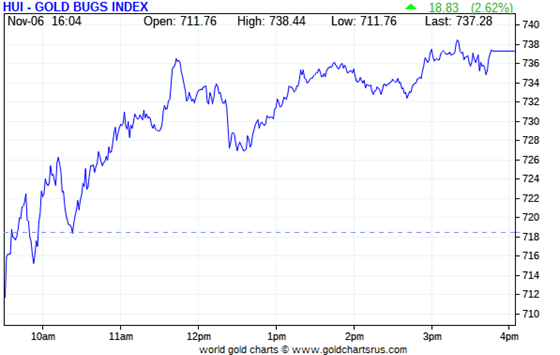
The gold stocks opened down a bit, but then began to chop unevenly higher at an ever-decreasing rate until around 3:35 p.m. EDT in New York. They then sagged a tad until trading ended at 4:00 p.m. Despite the fact that gold was closed lower on the day by a bit, the HUI closed up an impressive 2.62 percent.
The price path of the silver shares on Friday were almost a carbon copy of the price paths of the gold equities...except they outperformed the HUI this time around by a bit...as Nick Laird's Silver Sentiment Index closed higher by 2.96 percent. Click to enlarge.
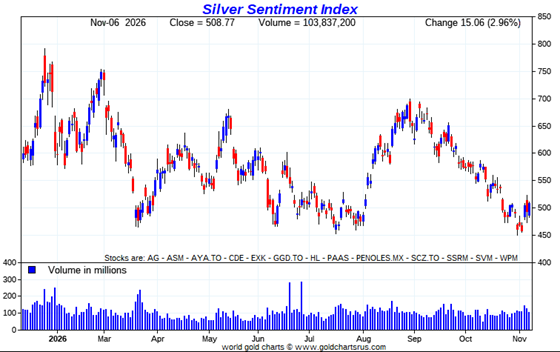
The two stars yesterday were Silvercorp Metals and Coeur Mining...as they closed higher by 6.71 and 5.74 percent respectively...on their Q3 earnings reports that were in yesterday's column. The biggest underperformer was Pan American Silver, as it closed up only 1.45 percent.
There was this news from Wheaton Precious Metals yesterday.
Silver closed higher by 0.16% on Friday -- and Nick's Silver Sentiment Index closed up 2.96%. Sprott's PSLV finished the day lower by 0.13%.
Gold closed lower by 0.41% -- the HUI closed up 2.62% -- and Sprott's PHYS closed lower by 0.71%
The Shanghai/U.S. price premium in silver on Friday was only 10.95 percent.
The reddit.com/Wallstreetsilver website, now under 'new' and somewhat improved management, is linked here. The link to two other silver forums are here -- and here.

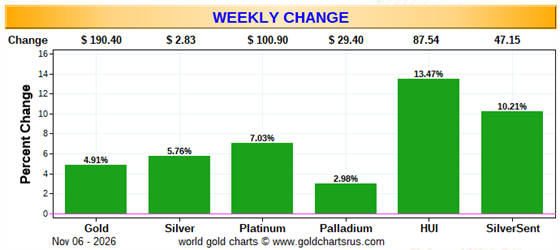
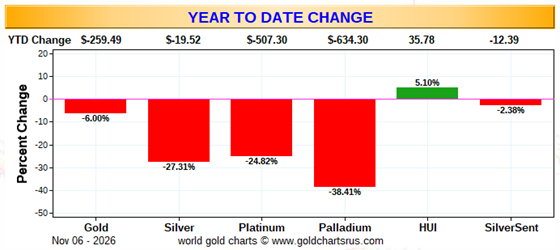
Here are two of the usual three charts that appear in this spot in every weekend missive. They show the changes in gold, silver, platinum and palladium in both percent and dollar and cents terms, as of their Friday closes in New York — along with the changes in the HUI and the Silver Sentiment Index.
Here's the weekly chart which, for this one week only, doubles as the month-to-date chart as well -- and it's back to being a lovely shade of green -- and the gold equities outperformed the silver stocks on both a relative and absolute basis. Click to enlarge.
Here's the year-to-date chart -- and I'm delighted to see some green here, after two straight weeks of wall-to-wall red. But it remains of great interest that the precious metal shares are 'outperforming' the metals themselves by as much as they are over this time period...especially the silver stocks, where the dichotomy remains stark. Click to enlarge.
Despite the fact that silver has now broken the $120 barrier...albeit briefly -- and the silver well in London came close to running dry more than a year ago now...the gold/ silver ratio is now a farcical 78.2 to 1 as of Friday's close. The 'normal' and historical ratio is around 15 to 1...which would put silver at around $270 based on gold's closing price on Friday. And if priced at the ratio of 7:1 that it comes out of the ground at...compared to gold...that would put silver at around $580 an ounce. So a rather impressive triple-digit silver price is in our future...most likely somewhere between those two numbers.
As I say in this spot every Saturday...all that remains to be resolved is what that price will be -- and how soon 'da boyz' allow it to happen. Its first attempt to reach one of these values back at the end of January was obviously crushed ...as were all the rest since then. How its next rally ends, remains to be seen. But in the face of its continuing structural deficit -- and all the other things going on in the world today, they can't keep it up forever.

The CME Daily Delivery Report for Day 7 of the November delivery month showed that 25 gold -- and 136 silver contracts were posted for delivery within the COMEX-approved depositories on Tuesday.
In gold, the only short/issuer of the three in total that mattered was British bank HSBC, issuing 20 contracts out of its client account. There were four long/ stoppers in total -- and the three biggest were JPMorgan, ADM and Advantage ...picking up 10, 7 and 5 contracts for their respective client accounts.
In silver, the only short/issuer that mattered there was Marex Spectron, issuing 131 contracts out of its client account. There were six long/stoppers in total -- and the two largest were Marex and JPMorgan...picking up 72 and 44 contracts for their respective client accounts.
The link to yesterday's Issuers and Stoppers Report is here.
Month-to-date there have been 4,492 gold contracts issued and stopped -- and in silver that number is 1,502 COMEX contracts.
On First Delivery Notice Day for November...back on October 29...there were 2,862 gold, plus 1,164 silver contracts still open for delivery that month. So those have already been delivered...plus a bunch more contracts have been added as well...in gold especially.
The CME Preliminary Report for the Friday trading session, showed that gold open interest in November fell by 25 contracts, leaving 67 still around ...minus the 25 contracts out for delivery on Tuesday as per the above Daily Delivery Report. Thursday's Daily Delivery Report showed that 13 gold contracts were actually posted for delivery on Monday...so that means that 25-13=12 gold contracts disappeared from November deliveries.
Silver o.i. in November declined by 18 contracts, leaving 354 still open... minus the 136 contracts out for delivery on Tuesday as per the above Daily Delivery Report. Thursday's Daily Delivery Report showed that 22 silver contracts were actually posted for delivery today...so that means that 22-18=4 more silver contracts were added to November deliveries.
Total gold open interest for the Friday trading session in last night's Preliminary Report increased by 859 COMEX contracts. Total silver o.i. actually fell, it by 1,985 contracts...some short covering perhaps?
[I checked the final change in total open interest for gold on Thursday in Friday's final report from the CME Group -- and it declined by a significant amount...from +5,233 COMEX contracts, down to only +465 contracts. The final change in total silver o.i. for Thursday showed a smallish decline... from +175 contracts, down to -153 COMEX contracts.]
Gold open interest in Decemberin Friday's Final Report for Thursday fell by a further 4,670 COMEX contracts, leaving 260,278 contracts still open. Silver open interest in December in Friday's final report for the Thursday trading session declined by a further 2,191 COMEX contracts, leaving 75,885 contracts still around.
There were a further 27,632 troy ounces of gold added to GLD on Friday...plus another 43,370 troy ounces of gold were added to GLDM. But after two days of no activity, there were 1,353,897 troy ounces of silver withdrawn from SLV.
The SLV borrow rate started the Friday session at 0.26% -- and finished it at 0.41%...with 10.0 million shares available. The GLD borrow rate started at 0.28% -- and finished the day at 0.50%...with 5.7 million shares available.
In other gold and silver ETFs and mutual funds on Earth on Friday ...net of any changes in COMEX, GLD, GLDM and SLV activity, there were a net 206,902 troy ounces of gold added...but the silver number, which is a work in progress as mentioned at the top of today's column, showed that a net 4,139,183 troy ounce of silver were added -- and that's all because of the three new depositories that he's added to the list...Ninepoint, Purpose and Ainslie. The silver was already there, but is now in Nick's database for the first time. So this is a one-time adjustment.
There wasn't much activity in gold over at the COMEX-approved depositories on the U.S. east coast on Thursday. Nothing was reported received -- and only 3,940 troy ounces were shipped out involving two different depositories -- and I shan't bother itemizing these small amounts.
There was a bit of paper activity, as 13,635.343 troy ounces/393 kilobars were transferred from the Registered category and back into Eligible over at Brink's, Inc.
The link to what little COMEX gold activity there was on Thursday, is here.
There was more activity in silver, as 58,765 troy ounces were received at Delaware -- and 715,928 troy ounces were shipped out involving four different depositories. The largest two 'out' amounts were the 621,681 and 64,814 troy ounces that left Asahi and JPMorgan respectively.
There was some paper activity, as one truckload/599,447 troy ounces were transferred from the Registered category and back into Eligible over at Asahi.
The link to Thursday's COMEX silver action is here.
Although I don't have the space for the charts in today's column, Nick Laird passed around the gold and silver import and export numbers for the U.S. -- and updated with September's data.
During that month they imported 16.231 tonnes/521,840 troy ounces of gold -- and exported 27.972 tonnes/899,327 troy ounces. In silver, the import number was 475.376 metric tonnes/15.284 million troy ounces -- and the export number was 283.707 metric tonnes/9.121 million troy ounces of silver. I'll have the charts next week.
The Shanghai Futures Exchange showed that a net 259,362 troy ounces/ 8.067 metric tonnes of silver were withdrawn on their Friday. This puts their inventory level at 44.132 million troy ounces/1,372.641 metric tonnes.
The Shanghai Gold Exchange published their gold and silver withdrawals, updated with October's data. During that month there were 93.874 metric tonnes/3.018 million troy ounces of gold withdrawn -- and that number in silver was 123.390 metric tonnes/3.967 million troy ounces.
China also updated their 'official' gold reserves data for October -- and during that month the PBOC added a further 25.810 tonnes/829,817 troy ounces of gold. This puts their 'official' gold reserves at 2,435 tonnes/78.288 million troy ounces...but a lot of pundits believe that in reality it's around 10x that amount...including this writer.
I'll have all the charts for this sometime next week.

The Commitment of Traders Report, for positions held at the close of COMEX trading on Tuesday, showed the expected declines in the commercial net short positions in both gold and silver...but not nearly as much as I was expecting in either of them. And in the case of silver, it was the Big 8 traders involved -- and Ted Butler's raptors were sellers, which I was surprised but relieved to see.
In silver, the Commercial net short position declines by only 931 COMEX contracts, which works out to 4.655 million troy ounces of paper silver.
They arrived at that number through the sale of 2,759 long contracts...but also bought back/covered 3,690 short contracts -- and it's the difference between those two numbers that represents their change for the reporting week.
Under the hood in the Disaggregated COT Report, the Managed Money and Other Reportables actually increased their net long positions by small amounts during the reporting week...the former by 714 COMEX contracts -- and the latter by 834 contracts. This is deep into 'man bites dog' territory! So this meant that the Nonreportable/small traders had to have reduced their net long position by a whopping amount in order for the numbers to work out -- and they did, by 2,479 COMEX contracts.
Doing the math: 2,479 minus 714 minus 834 equals 931 COMEX contracts... the change in the Commercial net short position.
The Commercial net short position in silver now stands at 34,756 COMEX contracts/173.780 million troy ounces of paper silver...down those 931 contracts mentioned in the previous paragraph.
The Big 4 collusive commercial traders decreased their net short position during the reporting week, them by a tiny 293 COMEX contracts, down to 31,669 COMEX contracts...which is still 1,849 contracts above their lowest short position on record.
The Big '5 through 8'increased also decreased their net short position... them by 1,126 COMEX contracts...down to 14,448 contracts...and 1,752 contracts above their lowest short position I have records for.
The Big 8 commercial traders in total are net short 46,117 COMEX silver contracts...down 1,419 COMEX contracts on the week.
As per the number in the previous paragraph, the Big 8 short position fell by 1,419 contracts during the reporting week -- but the total Commercial short position declined by only 931 COMEX contracts, which meant that Ted Butler's raptors, the 30 small commercial traders other than the Big 8, had to have been net sellers during the reporting week -- and they were... decreasing their net long position by 1,419-931=488 COMEX contracts. They remain net long silver by 11,361 COMEX contracts. They haven't been this net long silver since 07 February 2025...which remains a monster bullish sign.
The sale of these 488 long contracts by the raptors allowed the Big 8 to cover more of their short position, which is a big positive.
Here's the 3-year COT chart for silver thanks to Nick Laird -- and updated with the above data. Click to enlarge.
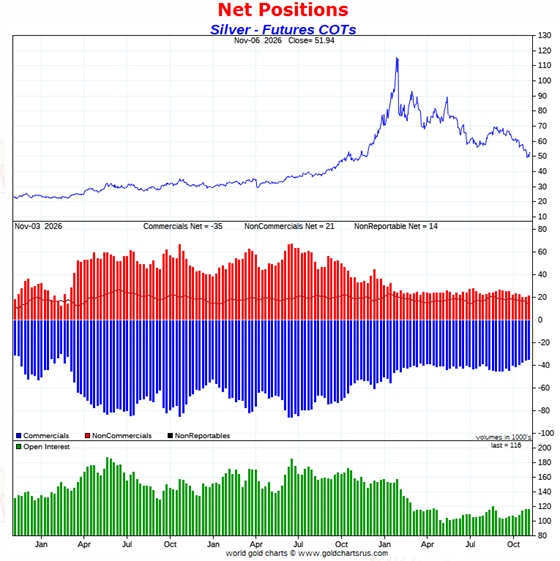
So, even though the headline decrease in the commercial net short position silver was only 931 COMEX contracts, the fact that Ted's raptor sold 488 long contracts allowed the Big 8 to cover more of their short position than they would have otherwise been able to.
The Big 8 short position back at its April 7 low, was 43,407 COMEX contracts -- and that was when silver was selling c. $75 the ounce. As of Tuesday's cut-off on November 3, silver was selling for $50 -- and the Big 8 short position was 46,117 COMEX contracts...2,710 contract higher now than it was back then.
So, whoever is long against them in the Managed Money, Other Reportables, or Nonreportable/small traders category...whether they be friend or foe of the Big 8 commercial traders...just refuse to sell regardless of how much the silver price gets beaten lower.
And to make things even more perverse, these traders in the Managed Money and Other Reportables categories actually increased their net long positions during the reporting week, which was totally counterintuitive considering how much 'da boyz' slammed the silver price.
It's now the battle of the titans in the silver market...the Big 8 vs. the new kids on the block that have shown up since the January crash.
The Big 8 commercial traders are net short 39.9 percent of the total open interest in silver in the COMEX futures market...down a bit from the 40.9 percent they were net short in last Friday's COT Report. The tiny decrease of 643 contracts in silver's open interest during the reporting week was not a factor in this calculation.
All that stands in the way of a rather spectacular 3-digit silver price...as it's always been...are the Big 8 collusive commercial shorts. If not for them...we'd already be there.
In gold, the commercial net short position also fell, but only 10,722 COMEX contracts...1.072 million troy ounces of paper gold...which was very disappointing. I was expecting a figures more than double that amount. All three categories reduced their net short positions during the reporting week.
They arrived at that number through the purchase of 217 long contract...but also bought back/covered 10,505 short contracts -- and it's the sum of those two numbers that represents their change for the reporting week.
Under the hood in the Disaggregated COT Report, all three categories got the 'sell' memo...as the Managed Money traders decreased their net long position, but only by 1,948 COMEX contracts. The traders in the Other Reportables and Nonreportable/ small traders categories reduced theirs by 4,955 and 3,819 contracts respectively.
Doing the math: 1,948 plus 4,955 plus 3,819 equals 10,722 COMEX contracts...the change in the commercial net short position.
The commercial net short position in gold now sits at 204,902 COMEX contracts/ 20.490 million troy ounces...down those 10,722 contracts in this reporting week...which is far bigger number than I'd like to see at this point in the price cycle.
The Big 4 commercial traders decreased their net short position, them by only 4,751 COMEX contracts, down to to 136,116 contracts.
The Big '5 through 8' commercial traders also decreased their net short position...them by 3,219 contracts, down to 59,477 COMEX contracts...which is still monstrous.
The Big 8 commercial traders in total are net short 195,593 COMEX gold contracts...down 4,751+3,219=7,970 contracts from last Friday's COT Report -- and remain net short a very hefty 33,695 contracts above their record low of 161,898 contracts that they were short back on May 26.
But since the commercial net short position fell by 10,722 COMEX contracts -- and the Big 8 decreased their net short position by only 7,970 contracts...that meant that Ted's raptors, the 36 small commercial traders other than the Big 8, had to have been net buyers during the reporting week as well -- and they were. They decreased their net short position by 10,722-7,970=2,752 COMEX contracts -- and are now net short gold by 9,309 COMEX contracts...which still remains a grotesque amount at this point in the price cycle.
And like they currently are in silver, these raptors [who are all the same traders in both these precious metals] would normally be net long gold by many thousands of contracts [if not tens of thousands of contracts] at this point in the price cycle -- and why they're not this time around, I have no idea...but suspect that they've been recruited into the trenches in the fight to prevent a massive rise in its price.
But if they weren't short this amount -- and net long those thousands [or tens of thousands] of contracts that they normally would be, it's a guarantee that gold would be many, many thousands of dollars higher in price than it is now.
I suspect that no more than a small handful of these small commercial traders hold the vast majority of this short position...so it's the 'Big 10 or 12' -- and not just the 'Big 8' traders that are running the gold price management show.
Here's Nick's 3-year COT chart for gold -- and updated with the above data. Click to enlarge.
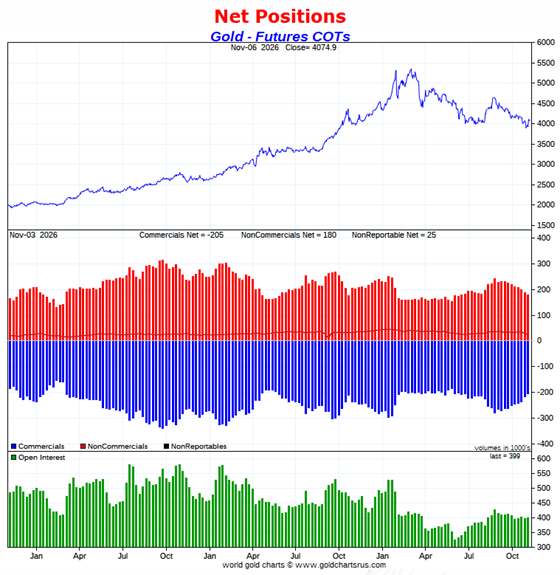
Like in silver, I was more than disappointed that the collusive commercial traders of whatever stripe weren't able to decrease their short positions in gold by more than they did...especially considering the fact they beat the living snot out of it during the reporting week just past.
But it suddenly dawned on me as I was working on the numbers above the gold COT chart, that the sole reason that 'da boyz' weren't able to do better was for the same reason they didn't do well in silver -- and that was because the new kids on the block...friend or foe...in the Noncommercial/small trader categories flatly refused to sell to them, either.
The Big 8 are short 49.0% of total open interest in gold in the COMEX futures market...down a bit from the 51.3% they were short in last week's report. The percentage decline would have been a tad more if it hadn't been for the 2,359 contract increase in total open interest, which obviously affects the percentage calculation.
However, unlike silver, the commercial net short position in gold is much larger than the Big 8 short position...because almost all of the rest of the collusive commercial traders, Ted Butler's raptors, are also net short gold. Adding them [36 traders] into the mix, which you have to do, puts the commercial net short position in gold at 51.3% of total open interest in the COMEX futures market ...down a lot from the 54.3% from last Friday's report.
Then, if you subtract out the uneconomic and market-neutral spread trades from total open interest, the commercial net short position in gold jumps up to something under 55% of total open interest. That's still a lot, but a vast improvement from the 70+% it was at one point early this year.
So, all the stars are aligned for a monster rally in the precious metals from a COMEX futures market perspective. But, as is always the case, that will only come about when the Big 8 shorts allow it...or are instructed to stand aside.
In the other metals, the Managed Money traders in palladium increased their net short position by the largest weekly amount I've ever seen...1,919 COMEX contracts -- and are now net short palladium by a death-defying 15,216 COMEX contracts. Why they're so grossly short this particular precious metal remains a mystery...but it was their adding of 9,000+ short contracts over the last six weeks that caused its price to crash to a new 1+ year low.
The commercial traders in the Swap Dealers category are net long palladium by 8,763 contracts -- and the commercial traders in the Producer/Merchant category are also net long...them by 2,485 COMEX contracts. The traders in the Other Reportables category are net long 2,913 contracts in this metal -- and the Nonreportable/ small trader categories are net long 1,055 COMEX contracts.
So the Managed Money traders in palladium are net short against all of the other four categories...including all the commercial traders. This is preposterous beyond belief -- and now even deeper into 'man bites dog' territory...but has improved somewhat since Tuesday's cut-off.
As I keep mentioning about these numbers, palladium is a very dinky market. Total open interest is only 30,676 COMEX contracts...up a further 3,601 contracts this past reporting week.
The world's banks are now net long palladium by 5.7% of total open interest in the COMEX futures market in the November Bank Participation Report, which came out yesterday...which is down big from the 0.7% of total open interest that they were net short in October's Bank Participation Report.
This is a very strange and very twisted market once you get a look into its internal structure -- and as I point out in every monthly Bank Participation Report, the only reason that there's a COMEX futures contract in palladium is so that its price can be managed. Right now it's being 'managed' by the Managed Money traders!
In platinum the Managed Money traders decreased their net long position by a further 3,048 COMEX contracts during the reporting week -- and are now net short platinum by 1,283 contracts -- but I suspect they're no back on the long side since the Tuesday cut-off. The traders in the Other Reportables and Nonreportable/small trader categories, remain net long platinum by very respectable amounts...the former category in particular.
The commercial traders in the Producer/Merchant category in platinum are net short 2,793 COMEX contracts. The Swap Dealers are net short platinum by 6,463 COMEX contracts. Both categories decreased their net short positions this past reporting week...the latter category in particular.
In November's Bank Participation Report, the world's banks...19 of them in total...were net short 15.2 percent of total open interest in platinum in the COMEX futures market...down a decent amount from the 19.0 percent they were short in October's.
In copper, the Managed Money traders decreased their net long position by a further 5,685 COMEX contracts during the past reporting week -- but remain net long copper by 34,890 contracts...872 million pounds of the stuff. The traders in the Other Reportables and Nonreportable categories are net long copper by a bit as well.
Copper, like palladium, continues to be a wildly bifurcated market. The Producer/ Merchant category is net short a hefty 55,218 copper contracts/ 1.380 billion pounds -- while the Swap Dealers are net long 13,295 COMEX contracts/332 million pounds of the stuff. So it's the commercial traders in the Producer/Merchant category that remain net short against every other group of traders...including the commercials in the Swap Dealer category.
Whether this dichotomy in copper means anything or not, will only be known in the fullness of time. Ted Butler said it didn't mean anything as far as he was concerned, as they're all commercial traders in the commercial category. But this bifurcation has been in place for as many years as I've been keeping records -- and that's a very long time....10+ years.
In this vital industrial commodity, the world's banks...both U.S. and foreign... are net short copper by 4.8% of total open interest in the November Bank Participation Report...down from the 10.0% they were short in the October BPR.
However, the very interesting thing about copper in the November BPR that came out yesterday, was that 5 U.S. banks are net long copper by 13,509 COMEX contracts...whereas 16 non-U.S. banks are net short copper by a very hefty 29,272 contracts.
At the moment it's mostly the commodity trading houses such as Glencore and Trafigura et al., along with some hedge funds, that are mega net short copper in the Producer/Merchant category, as the Swap Dealers are net long, as pointed out above.
The next Bank Participation Report for November's activity is scheduled to be out on Friday, December 4.

Here’s Nick Laird’s “Days to Cover” chart, updated with the COT data for positions held at the close of COMEX trading on Tuesday, November 3. It shows the days of world production that it would take to cover the short positions of the Big 4 — and Big '5 through 8' traders in every physically traded commodity on the COMEX. This chart is a graphical representation of what's shown in the COT Report above. Click to enlarge.
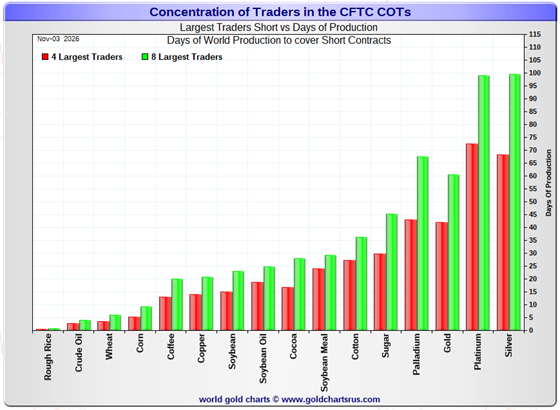
In this week's data, the Big 4 traders are short about 68 days of world silver production...down about 1 day from last Friday's COT report. The ‘5 through 8’ large traders are short an additional 31 days of world silver production...down about 2 days from the last report...for a total of 99 days that the Big 8 are short -- and obviously down about 3 days from last Friday's report.
Those 99 days that the Big 8 traders are currently short, represents about 3.3 months of world silver production, or 230.585 million troy ounces/46,117 COMEX contracts. That's down a tad from the 237.680 million troy ounces/ 47,536 contracts in last Friday's COT Report.
This is the Big 8's lowest short position since 23 June...but still higher than the 43,407 contracts they were net short at their lows back on 07 April.
In gold, the Big 4 are short about 42 days of world gold production...down about 2 days from last Friday -- and the Big '5 through 8' are short an additional 18 days of world production...down about 1 day from last Friday's COT Report...for a total of 60 days of world gold production held short by the Big 8 commercial traders -- and obviously down about 3 days from last Friday's report.
In silver, I believe that a goodly chunk of the gross short position in the Big 4 commercial category is mostly held by only two traders...both of them U.S. banks ...Wells Fargo and BofA I suspect.
In yesterday's Bank Participation Report for October, the Big 5 U.S. banks held a gross short position in silver of 12,417 COMEX contracts...compared to 15,472 contracts in September -- and 15,819 contracts in August. This is their lowest gross silver short position that I can remember, but still huge.
This chart is also a graphical representation of why I consider platinum to be 'da boyz' No. 2 problem child after silver -- and it continues to be a big problem child. The Big 4 short position in it now exceeds the Big 4 short position in silver -- and the Big 8 are neck and neck...short 99 days of world production in each.
I note that palladium, because of the increasing net short position of the Big 8 traders in the Managed Money category, has slid past gold -- and is now the third most shorted physical commodity in the COMEX futures market.
The short position in SLV now sits at 28.49 million shares/troy ounces as of the latest short report that came out this about eleven days ago...for positions held at the close of trading on Thursday, October 15. This represents an unwelcome increase of 12.22% from the prior report -- and 5.15% of total SLV shares outstanding. This is not as off-the-charts grotesque and obscene as it once used to be -- but realistically should be around a fifth of that amount.
Please remember that there's not a single solitary troy ounce of silver backing any of these shorted shares as the SLV prospectus requires...which begs the question of what the silver price might be if those short SLV shares had to buy enough physical silver to back them.
The next short report...for positions held at the close of business on Friday, October 30...is due out on Tuesday, November 10.
As Ted Butler pointed out quite often over the years, the resolution of the Big 4/8 short positions will be the sole determinant of precious metal prices going forward...although that short position in gold held by his raptors continues to be another huge negative factor...but which has declined precipitously during the last two reporting week. However, under normal circumstances, it wouldn't be there at all...it would be a big long position.
And as he also pointed out over the years, there would come a time when what the numbers show in the COT Report won't matter, as events in the real world...whatever they may be...will overtake them. That hasn't happened yet...but that day is most certainly coming -- and rapidly, I suspect.
All that we await, is the denouement that follows. The big bear raids we've endured over the last many months, weeks and again this past week...are all part and parcel of the process to keep their respective prices in line until that moment arrives.

The November Bank Participation Report [BPR] data is extracted directly from the above Commitment of Traders Report. It shows the number of futures contracts, both long and short, that are held by all the U.S. and non-U.S. banks as of the Tuesday, November 3 cut-off in all COMEX-traded products.
For this one day a month we get to see what the world’s banks have been up to in the precious metals -- and they're usually up to quite a bit.
[The November Bank Participation Report covers the four-week time period from October 6 to November 3 inclusive]
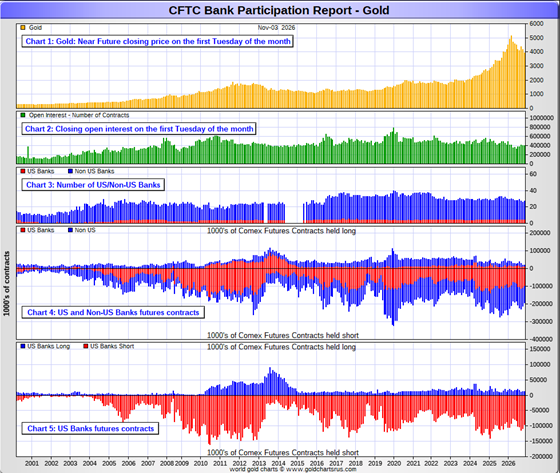
In gold, 5 U.S. banks are net short 83,911 COMEX contracts, down 12,754 contracts from the 96,665 they were short in the October report. This remains a grotesque number, because back in the November 2023 BPR, four U.S banks were net short gold by only 39,681 contracts.
Also in gold, 22 non-U.S. banks are net short 88,707 COMEX contracts, down 6,643 contracts from the 95,350 contracts that 21 non-U.S. banks were net short in October's BPR. I was expecting a lot more of a drop here, too. This is also a grotesque number, because back in the October 2023 BPR, 24 non-U.S. banks were only net short 26,781 COMEX gold contracts.
At the low back in the August 2018 BPR...these non-U.S. banks held a net short position in gold of only 1,960 contacts -- so they've been back on the short side in a gargantuan way ever since. Only a handful of these bullion banks hold meaningful short positions in gold. The short positions of the rest are of no consequence -- and never have been.
Although almost all of the largest U.S. and foreign bullion banks are in the Big 10-12 short category in gold, the odd hedge fund/commodity trading house are net short large amounts of gold in that category as well. There's also the possibility that the BIS could be short gold in the COMEX futures market.
As of November's Bank Participation Report, 27 banks [both U.S. and foreign] were net short 43.2 percent of the entire open interest in gold in the COMEX futures market...down a bit from the 48.4 percent that 26 banks were net short in the October BPR.
In yesterday's COT Report, the commercial net short position in gold was 51.3 percent of total open interest -- and if you subtract out the 43.2 percent held short by the banks...only 51.3-43.2=8.1 percentage points of the commercial net short position in gold is not held by the bullion banks. How's that for a concentrated and manipulative short position?
Here’s Nick’s BPR chart for gold going back to 2000. Charts #4 and #5 are the key ones here. Note the blow-out in the short positions of the non-U.S. banks [the blue bars in chart #4] when Scotiabank’s COMEX short position was outed by the CFTC in October of 2012.
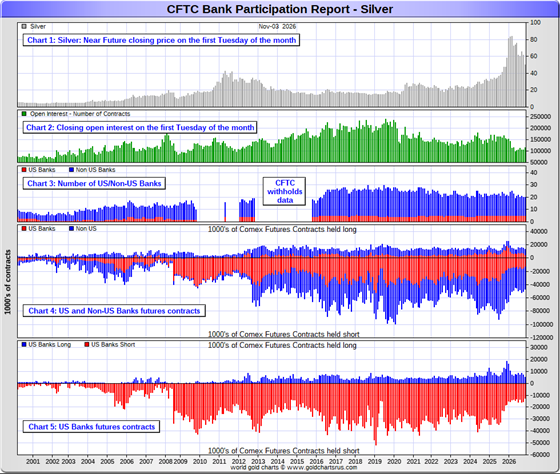
In silver, 5 U.S. banks are net short 7,478 COMEX contracts...down only 939 contracts from the 8,417 contracts they were net short in the October BPR. I was expecting far more improvement than this. It's still ultra low, but 6,705 contracts above their record low of December of last year, when they were net short only 773 COMEX contracts.
But the number I really wanted to see was the change in their gross short position. It fell from 15,472 in the October BPR...down to 12,417 in November's...a decent improvement...but the lion's share of that amount is held by two banks at most.
These same 5 U.S. banks hold a gross long position of 4,939 contracts... down from the 7,055 COMEX contracts they were gross long in the October BPR -- and it's a given that they're not divided up equally between them. I figure that the two U.S. banks that hold the biggest short positions in silver, don't hold much of a long position in it.
The five U.S. banks that are net short silver would be Citigroup, Wells Fargo, Bank of America, Goldman Sachs -- and Morgan Stanley...with by far the lion's share held by no more than two of these banks...most likely BofA and Wells Fargo.
Also in silver, 15 non-U.S. banks are net short 25,681 COMEX contracts, down only 1,544 contracts from the 27,225 contracts that these same 15 non-U.S. banks were net short in the October BPR. I wasn't pleased with this number, either.
It's a given, based on silver deliveries in 2025 -- and so far in 2026...that HSBC, Barclays, Standard Chartered, BNP Paribas, Deutsche Bank and Macquarie Futures hold by far the lion's share of the short positions of these non-U.S. banks. Canada's Bank of Montreal is a card-carrying member of this group as well.
And, like in gold, the BIS could also be actively shorting silver. However, the remaining short positions in silver, divided up between the remaining 8 or so non-U.S. banks, are immaterial — and have always been so....the same as most of the 22 non-U.S. banks in gold as well.
As of November's Bank Participation Report, 20 banks [both U.S. and foreign] were net short 28.7 percent of the entire open interest in silver in the COMEX futures market — down from the 33.9 percent that these same 20 banks were net short in the October BPR.
Here’s the BPR chart for silver. Note in Chart #4 the blow-out in the non-U.S. bank short position [blue bars] in October of 2012 when Scotiabank was brought in from the cold. Also note August 2008 when JPMorgan took over the silver short position of Bear Stearns—the red bars. It’s very noticeable in Chart #4—and really stands out like the proverbial sore thumb it is in chart #5. Click to enlarge.
In platinum, 4 U.S. banks are net short 2,314 COMEX contracts in the November BPR, down only 1,153 contracts from the 3,467 contracts that 5 U.S. banks were short in the October BPR...very disappointing.
At the 'low' back in September of 2018, these U.S. banks were actually net long the platinum market by 2,573 contracts...so they still have more work to do to get back to market neutral...but I doubt they'll make it now.
Also in platinum, 15 non-U.S. banks decreased their net short position by a tiny 901 contracts... from 12,481 contracts held by 16 non-U.S. banks in October's BPR...down to 11,580 contracts in October's BPR. This is 4.74x the amount they held short at their low in the May/25 BPR, so they've gone back on the short side in platinum by a huge amount since then -- and have barely reduce it since.
Back in the December 2023 BPR, these non-U.S. banks were net short a microscopic 35 platinum contracts...so they have yeoman work to do if they ever want to get back to even close to that number. I doubt that they'll ever accomplish that, without driving its price to the moon -- and are permanently stuck with this short position.
As you know, platinum remains the big commercial shorts No. 2 problem child after silver -- and there's now a long-term structural deficit in it [and palladium] as well.
As of November's Bank Participation Report, 19 banks [both U.S. and foreign] were net short 15.2 percent of platinum's total open interest in the COMEX futures market, down from the 24.2 percent that 21 banks were net short in October's BPR.
Here's the Bank Participation Report chart for platinum. Click to enlarge.
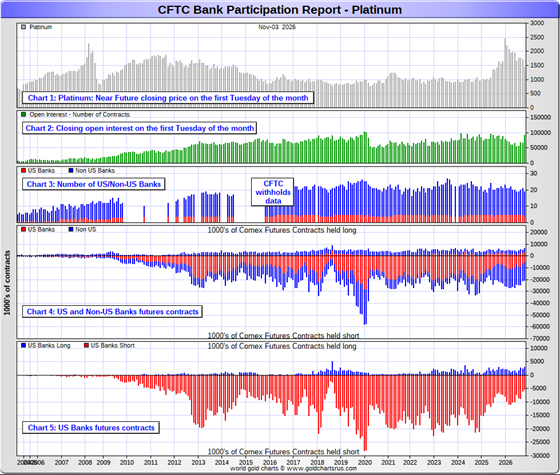
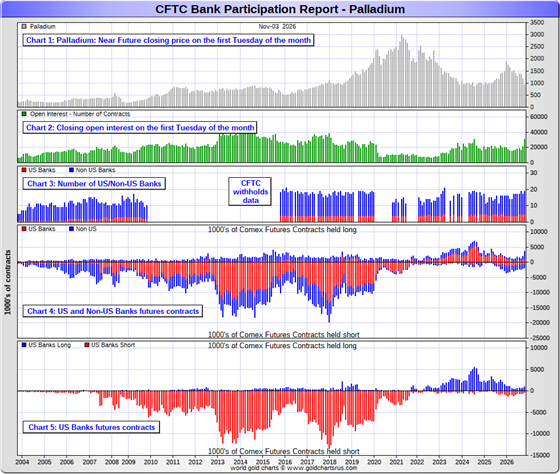
In palladium, 5 U.S. banks are net long 638 COMEX contracts in the November BPR. In October's BPR, they were net long palladium by 97 contracts.
Also in palladium, 14 non-U.S. banks are now net long 1,111 COMEX contracts. In October's BPR 12 non-U.S. banks were net short 245 contracts.
Of course, none of this mean anything considering how tiny these amounts are...especially when divided up between 19 banks.
And as I've been commenting on for almost forever, the COMEX futures market in palladium is a market in name only, because it's so illiquid and thinly-traded. Its total open interest in yesterday's COT Report was only 30,676 contracts...compared to 91,278 contracts of total open interest in platinum...115,584 contracts in silver -- and 399,169 COMEX contracts in gold.
Total open interest in palladium has increased quite a bit over the last ten or so years, because I remember when it was less than 9,000 contracts on average. So it's nowhere near as illiquid as it used to be -- and it's also been helped along by the fact that the bid/ask is now down to only 40 bucks. It used to be $150 at one point way back when.
As I say in this spot every month, the only reason that there's a futures market at all in palladium, is so that the Big 8 traders can control its price -- and these Big 8 are in the Managed Money category of all places!
As of this Bank Participation Report, 14 banks [both U.S. and foreign] are now net long 5.7 percent of total open interest in palladium in the COMEX futures market...down from the 0.7 percent of total open interest that 17banks were net short in the October BPR. These are meaningless numbers.
For the last 6+ years, the world's banks have not been involved in the palladium market in a material way...see its chart below. With all the world's banks basically market neutral from a COMEX futures market perspective...it's only the Managed Money traders that are net short up the wazoo...for reasons unknown.
The Big 8 shorts in palladium, none of which are bullion banks, are net short 38.4 percent of total open interest in palladium as of yesterday's COT Report...down from the 40.2 percent of total open interest they were short a month ago.
Here’s the palladium BPR chart -- and it remains to be seen if 'da boyz' return as big short sellers again at some point like they've done in the past. Click to enlarge.
Excluding palladium for obvious reasons, most likely no more than a dozen or so banks in total -- and mostly U.S. and U.K.-based...along with French bank BNP Paribas and Deutsche Bank...continue to hold meaningful short positions in the other three precious metals...although I won't let Canada's Bank of Montreal or Australia's Macquarie Futures off the hook just yet.
As I pointed out above, some of the world's commodity trading houses and hedge funds are also net short the four precious metals. They have the ability to affect prices if they choose to exercise it. But it's still the collusive Anglo/ American/Western bullion bank cartel in the commercial category that are at Ground Zero of the price management scheme in the COMEX futures market. They are -- and remain, the not-for-profit/short sellers of last resort...until further notice.
And as has been the case for several decades now, the short positions held by the Big 4/8 traders is the only thing that matters...especially the short positions of the Big 4...or maybe only the Big 1 or 2 in silver. How this is ultimately resolved [as Ted kept pointing out] will be the sole determinant of precious metal prices going forward.
Considering the current state of affairs of the world as they stand today -- and the structural deficit in silver -- and now in platinum and palladium as well, the chance that these big bullion banks and commodity trading houses could get overrun at some point, is no longer zero -- and certainly within the realm of possibility if things go totally non-linear somewhere.
But...as Ted kept reminding us...if they do finally get overrun, it will be for the very first time. And it was patently obvious that the collusive commercial traders of whatever stripe had to step in multiple times this year so far... including this past week...in order to prevent exactly that from happening. If they hadn't, Ted Butler's "Bonfire of the Silver Shorts" would have become a reality within days...if not hours...which is the scenario that was unfolding at the end of January. That's when and why the powers-that-be had to step in to prevent it.
The next Bank Participation Report for trading in November is due out on Friday, December 4.

CRITICAL READS
U.S. economy added 165,000 jobs in October, way more than expected; unemployment rate slips to 4.1%
The U.S. economy added jobs at a much stronger-than-expected pace in October, while the unemployment rate moved lower as the labor market showed surprising strength.
Non-farm payrolls increased by a seasonally adjusted 165,000 for the month, compared with the Dow Jones estimate for 59,000, the Bureau of Labor Statistics reported Friday.
The unemployment rate nudged down to 4.1%, compared with the forecast for 4.2%. A more encompassing measure that includes discouraged workers and those holding part-time jobs for economic reasons rose to 7.9%, up 0.3 percentage point, amid an increase of 421,000 in the civilian labor force.
In addition to the strong payroll gains for October, prior months were revised up substantially: The August figure moved to 186,000, an upward revision of 53,000, while the September count shifted to 60,000 following an upward revision of 31,000.
“You have to look pretty hard to find something to dislike in there,” Dan North, senior economist at Allianz Trade North America. “It’s a really, really good report, and all around I think you’d say it’s stronger than expected and the best one in a while, and it kind of fits with what I call the stable but perhaps unexciting labor market.”
This CNBC news item was posted on their Internet site at 8:31 a.m. on Friday morning EST -- and I thank Swedish reader Patrik Ekdahl for sharing it with us. Another link to it is here. The Zero Hedge spin on this is headlined "U.S. Jobs Soar By 165K Blowing Away Estimates; Unemployment Rate Drops Putting Dec Rate Hike Back In Play" -- and linked here.
Earthquakes and Chemical Reactions -- Doug Noland
The turbulence from waves, tsunamis and earthquakes. As for the week’s earthquake swarm, we’ll start with global markets. The Semiconductor Index was slammed 12.25% Thursday, the largest daily loss since the height of Covid deleveraging (March 16, 2020). Micron sank 17.5%, AMD 17.3%, Intel 10.3%, and Nvidia 9.3%. The Nasdaq100 slumped 6.35%, also the biggest loss since March 2020. MAG7 dropped 4.8%, led by Tesla’s 10.8% swoon.
For the week, South Korea’s KOSPI Index sank 11.7%, with Japan’s Nikkei 225 Index down 9.3%, and Taiwan’s TAIEX falling 12.2%.
Your choice: “blue wave” or “blue tsunami.” “Sweeping repudiation.” “Bloodbath.” “Dem-olition.”
The seismic shock registered at an 8.0. A deeply unpopular war. Inflation and affordability crises. And it’s not as though the Democrat Party cruised into the midterms with flattering approval ratings.
The American population is extraordinarily disgruntled – from coast to coast, rural and urban, wealthy, the vast middle class, and the poor. The scourge of inflationism: an explosion that was in the making over decades of insidious price inflation, wealth inequality and corruption. A rapacious tech oligarchy and piggish Wall Street hell-bent on jamming data centers down the throats of communities across the country. The super wealthy (including a notable trillionaire) with the gall to try to buy election results.
There are many messages from Tuesday’s quake. Likely lost in the pile is America’s silent majority (red, blue, black, Hispanic, young, old, wealthy and needy), all at wit’s end, determined to have its voice heard. Sick and tired of all the disrespect; depleted tolerance for all the nonsense – the lack of focus, the incompetence, graft, malice and ugliness. That’s just not us.
It’s past time for a shift back to American values and principles – including liberty, individual rights, rule of law, checks and balances, pluralism and tolerance, and common decency.
Many of us – Republican, Democrat, and Independent alike – believed our democracy was under the greatest threat in our nation’s storied 250-year history.
Doug's rant this week was posted on his website around midnight last night -- and another link to it is here.
Five informative and worthwhile video interviews
1. Will the U.S. Soon Leave the Middle East? -- Colonel Douglas Macgregor
This 32-minute video interview with the colonel was hosted by Judge Andrew Napolitano very early on Thursday afternoon EST -- and had to wait for today's column, as I was full-up in Friday's missive. It's certainly worth watching if you have the interest -- and I thank Guido Tricot, as always, for sending it our way. The link to it is here.
2. U.S.-Israel Divide Deepens After Midterm Defeat -- Alastair Crooke
This 51-minute video interview with former British diplomat and former MI6 office Crooke was hosted by Professor Glenn Diesen early on Thursday afternoon EST -- and is also worth your time if you have the interest. I thank Guido for this one as well -- and the link to it is here.
3. Who is Pointing Fingers at Whom in the White House? -- Robert Barnes
Another very worthwhile video interview...this one with Trump's former lawyer Robert Barnes...a deep insider in Washington. This one was posted on the youtube.com Internet site very early on Friday morning EST -- and also comes courtesy of Guido...as does the one that follows. The link to this one is here.
4. U.S.-Israel Alliance Faces Its Biggest Crisis in Decades -- Colonel Lawrence Wilkerson
This long 62-minute video interview with the colonel was hosted by Nima Alkhorshid over at Dialogue Works -- and was posted on the youtube.com Internet site around noon EST on Friday -- and is also worth watching if you have the interest. The link to it is here.
5. INTEL Roundtable 6-NOV with Larry Johnson & John Kiriakou -- Weekly Wrap
This 28-minute video interview with former CIA analyst Johnson -- and former CIA officer Kiriakou was hosted by Judge Andrew Napolitano late on Friday afternoon EST -- and I thank Guido Tricot for this one as well. The link to it is here.

Poland central bank chief leaves door open to more gold buying after hitting 700-tonne target
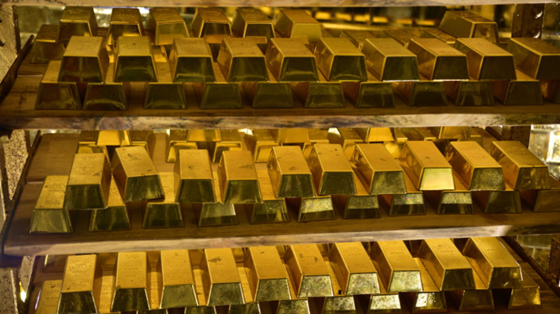
Poland’s central bank has reached its previously stated target for gold reserves of 700 metric tons, Governor Adam Glapinski said on Thursday, leaving the door open to further purchases.
National Bank of Poland (NBP) has been the largest buyer of gold among central banks reporting purchases between 2024 and 2026, according to World Gold Council data.
“We had set a target of 700 tons and we have achieved it, though the world is, of course, changing,” Glapinski told a press conference on Thursday following the bank’s unchanged rate decision on Wednesday. “We monitor what other countries are doing and monitor potential threats to Poland.”
The country’s gold holdings were currently worth 356 billion zlotys ($91.4 billion), he said. That implies that NBP bought 27 tons in October, when spot gold prices XAU= fell 7%.
“You ask what comes after these 700 tons. We need to sit down and think it through calmly. I see no reason why we should stop buying gold,” Glapinski said. “I believe that our gold reserves should grow in line with our overall reserves.”
Poland is currently the world’s 10th-largest holder of gold reserves, according to WGC. Gold accounted for 31% of its reserves at the end of September.
This mining.com story from Thursday is something I found on Sharps Pixley yesterday -- and another link to it is here.
China's tax crackdown drives Hong Kong gold and jewelry buying
As the Chinese government tightens taxes on the overseas assets of the wealthy and strengthens controls on capital outflows, wealthy Chinese are increasing purchases of physical assets such as precious metals in Hong Kong. With the real estate market slump compounded by a slowdown in the stock market, analysts say investors worried about asset value declines are turning to relatively safe assets like gold and jewelry.
According to Bloomberg on the 5th (local time), sales of jewelry, watches and luxury gifts in Hong Kong from January to September reached HK$45.8 billion (about 7.9216 trillion won), up 22.4% from a year earlier. It was the largest for the same period since 2019, far outpacing Hong Kong's overall retail sales growth rate (8.3%). These items accounted for about 15% of Hong Kong's total retail sales. This contrasts with a more than 10% decline in mainland China's luxury consumption in the third quarter.
The backdrop is cited as China's tougher taxation on overseas assets. Since the start of this year, authorities have strengthened enforcement of tax rules on the overseas trust income of the wealthy. Since July, authorities have expanded related probes and required some taxpayers to report overseas trust-related income by Oct. 22. In particular, wealthy individuals who hold large stock assets through overseas trusts, such as founders of companies listed in Hong Kong or on U.S. stock exchanges, are mentioned as key targets of the investigation. A 20% tax rate applies to income subject to taxation.
This Bloomberg story from Friday was picked up by the biz.chosun.com Internet site -- and another link to it is here.
QUOTE of the DAY

The WRAP
"Understand this. Things are now in motion that cannot be undone." -- Gandalf the White
Today's pop 'blast from the past' was composed by Kurt Weill with lyrics by Bertolt Brecht for their 1928 German music drama The Threepenny Opera/Die Dreigroschenoper -- but it was Louis Armstrong who first introduced the vocal version to the United States in 1955.
The song, however, is most closely associated with Bobby Darin, who recorded his version on 19 December 1958 for his album That's All. However, even before it was recorded, Darin offered it to Frank Sinatra, as Sinatra was looking for a theme song for himself...but turned it down...a decision he regretted within months.
The song was released as a single in August 1959, even though Darin was reluctant to do so. Dick Clark had advised Darin not to record the song because of the perception that, having come from an opera, the song might not appeal to a rock and roll audience; he subsequently acknowledged his error.
And the rest, as they say, is history. The song reached number one on the Billboard Hot 100, Darin's only number 1 hit on that chart. It was listed as a Cash Box Top 100 number one single in 1959 for eight weeks. I remember it all too well -- and here's the man himself performing it. In those days, TV was still in black & white -- and the link is here.
Today's classical 'blast from the past' is the first time I've featured this work -- and for the life of me I can't remember the kind subscriber who pointed it out...but I thank him profusely, as I'd forgotten all about it.
It's Joseph Haydn's Trumpet Concerto in E♭ major which he composed in 1796 for the trumpet virtuoso Anton Weidinger. Haydn was 64 years of age at the time.
Anton Weidinger had developed a keyed trumpet, but of limited sound quality, which could play chromatically throughout its entire range. Before this, the trumpet was valveless and could only play a limited range of harmonic notes by altering the vibration of the lips; also called by the name of "natural trumpet". The valved trumpets used today were first constructed and used in the 1830s.
A favourite of the trumpet repertoire, it has been cited as "possibly Haydn's most popular concerto"...which is something I can vouch for.
Here's Hungarian-born Gábor Tarkövi as soloist...accompanied by the Karajan-Academy of the Berliner Philharmoniker. Maestro Marc Minkowski conducts -- and the link is here.

With the dollar index on a tear to the upside -- and a hugely positive non-farm payroll number, I was amazed that any of the precious metals were allowed to close higher on the day -- and that gold closed down as little as it did.
However, I did carefully note the fact that silver's multiple attempts to rally much above the $52 spot mark that started shortly after London open, were all turned lower...especially its multiple attempts in COMEX and after-hours trading in New York.
And even more amazing was the fact that although gold traded lower throughout the entire New York trading session on Friday, the HUI closed up 2.62% -- and the Silver Sentiment Index, which would barely move the needle on such a small price gain, closed higher by 2.96 percent.
Whoever the buyers were for all the precious metal shares yesterday, it certainly wasn't Joe Six-pack. There were strong hands in this market -- and I'd dearly love to know who they were -- and what they may know that we don't...yet.
Platinum, 'da boyz' No. 2 problem child after silver, was also allowed to close higher on the day -- and another head-scratcher. Palladium finished the day down $12 -- and like platinum, its price path was a choppy and quiet yawner all day long.
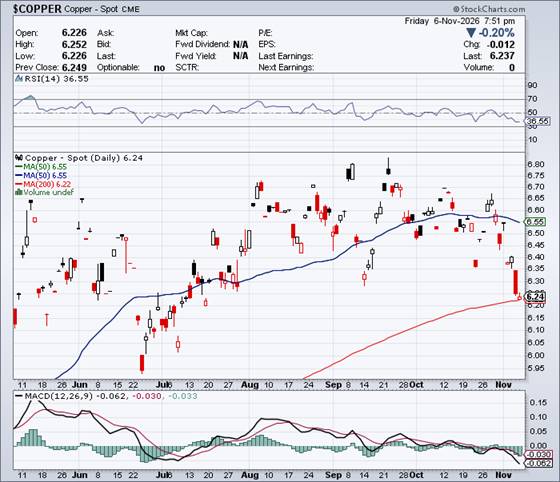
Copper closed lower by a further but tiny 1.2 cents at $6.24 spot...kissing its 200-day moving average intraday in the process.
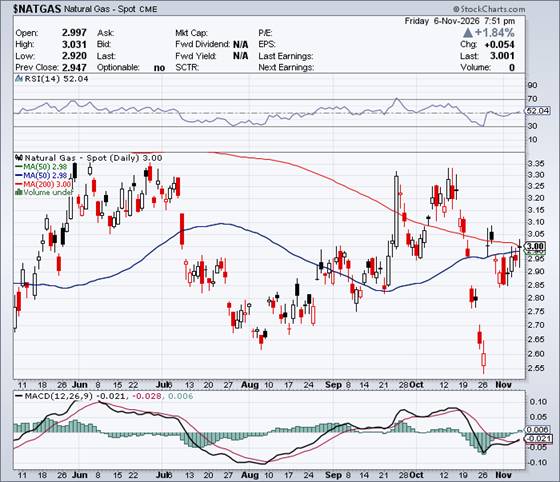
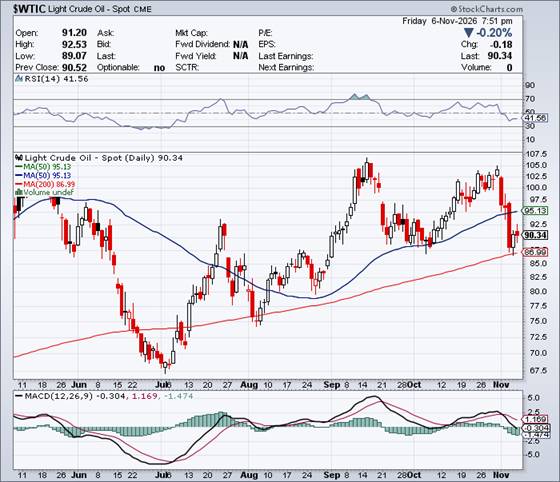
Natural gas [chart included] closed up 5.4 cents at $3.00/1,000 cubic feet. It closed back above its 50-day moving average -- and right on its 200-day moving average...not a difficult chore, considering the fact that those two moving averages are only 2 cents apart at the moment. WTIC closed lower by an inconsequential 18 cents at $90.34/barrel.
Here are the 6-month charts for the Big 6+1 commodities as of the close of trading on Friday...thanks to stockcharts.com as always -- and, as is usually the case, the silver candle doesn't contain all of yesterday's price move. Click to enlarge.
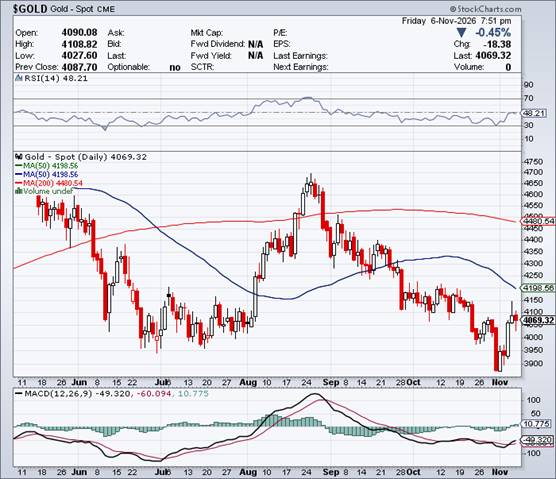
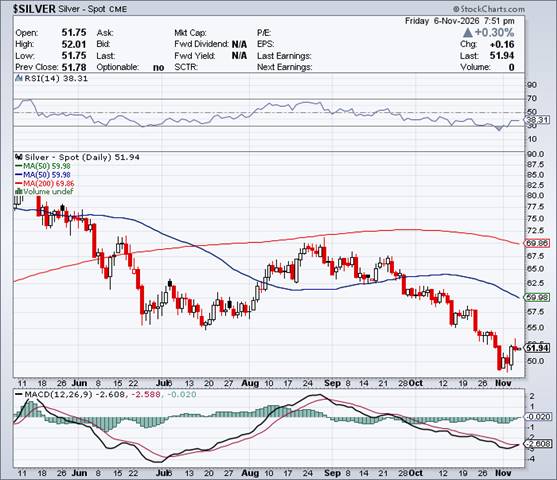
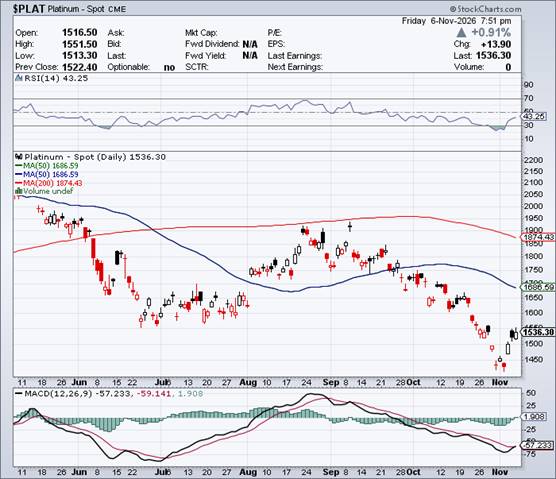
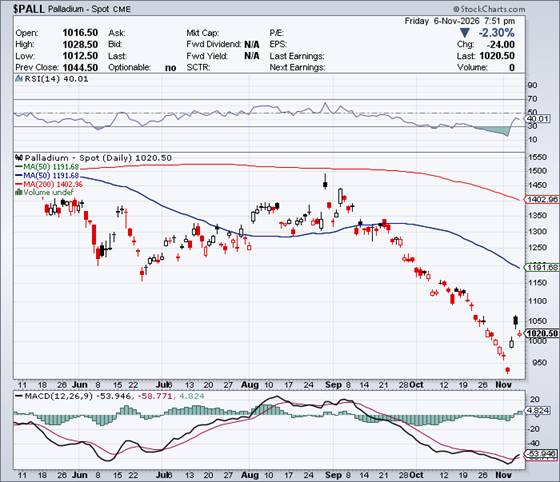
It would appear that we've seen the lows for this current iteration of the 'wash, rinse & spin' cycle. For gold and silver, it was a week ago Friday -- and for platinum and palladium, it was Tuesday...the last day of the reporting week for the current COT and companion Bank Participation Report, both of which came out yesterday.
Looking at the RSI traces in both gold and silver...the former is now back in the middle of the market neutral range -- and silver is now a goodly distance above the oversold mark. At their respective lows of a week ago, silver and gold were back to prices not seen since sometime in November of last year.
But despite the fact that gold was about $1,700 off it late January high tick at the COMEX close on Tuesday -- and silver about 70 bucks off its, the Big 8 commercial traders have yet to reduce their short positions in either of these two precious metals back to their lows of earlier in the year.
Back on May 26...the Big were short 161,898 COMEX contracts when gold was a bit north of $4,500. As of this past Tuesday, with gold about $600 lower, the Big 8 are now short 195,593 COMEX contracts.
Back on April 7...the Big 8 were short 43,407 COMEX contracts when silver was $72 the ounce. As of yesterday's COT Report, the Big 8 short position in silver was 46,117 contracts...with silver at $50 as of the Tuesday cut-off.
So no matter how much 'da boyz' have huffed & puffed, they have not been able to flush out the Managed Money and Other Reportable traders that have piled onto the long side since April 7 in silver -- and the May 26 lows in the Big 8 short positions in gold.
As I've mentioned in my COT commentary of late, I don't know if these new kids on the block are friends or foes of the Big shorts...but if foes, I know that the collusive commercial traders would love to blow them out if they could... which would allow them to cover even more of their short positions.
However, I don't rate their chances as very good, because as I pointed out in the COT Report in silver further up, despite the pounding laid on it during this past reporting week, the traders in the Managed Money and Other Reportables increased their net long positions...which is off-the-charts 'man bites dog' stuff -- and has never happened before. Under 'normal' circumstances, they would have been big sellers.
In gold, I was expecting the commercial net short position to fall by at least 25,000 contracts because the way 'da boyz' ravaged the gold price compared to the prior reporting week...but got less than half that amount...10,722 contracts...which is almost small change. Only 8,000 contracts of that amount was an improvement in the Big 8 short position -- and Ted's raptors are still short 9,309 COMEX contracts at the bottom of this price cycle. This is also deep into 'man bites dog' territory, because normally the raptors would be net long 10,000+ contracts in gold at this point...like they're net long silver by 11,361 COMEX contracts currently.
You couldn't make this stuff up.
So whoever is left in the Non-commercial category...which is comprised of the Managed Money and Other Reportables...they've dug in their heels. The Big 8 knew they were beat, so thus the rallies since then...along with the big rallies in their shares this week.
Out in the real world, things are looking increasingly dicey for the biggest economic, financial and monetary bubble the world has ever known. The West's proxy war against Russia using the Ukraine as a battering ram, continues unabated...but is a war that is already lost. The war in West Asia against Iran is lost as well -- and now the world awaits the decision to go nuclear against them...or not.
You couldn't make this stuff up, either. However, the leaders of the western globalist power elite want these wars...no matter what the collateral damage, or to whom.
So place your bets.
As I was last week, last month -- and for at least the last 15 years...I'm still 'all in' -- and will remain so to whatever end.
See you on Tuesday.
Ed
About the author

SUBSCRIBE: https://edsteergoldsilver.com/

Ed Steer’s Daily Analysis of the Gold and Silver Markets
After eight years of writing about the precious metals for Casey Research, the folks at Stansberry & Associates—who just recently purchased controlling interest in the company—decided that my ‘niche market’ column didn’t fit into their plans.
Since the time that Casey Research was kind enough to offer me a stand-alone column, it became their most highly-rated blog almost from the outset—and has remained that way up to this date...