US Ten Year Rates
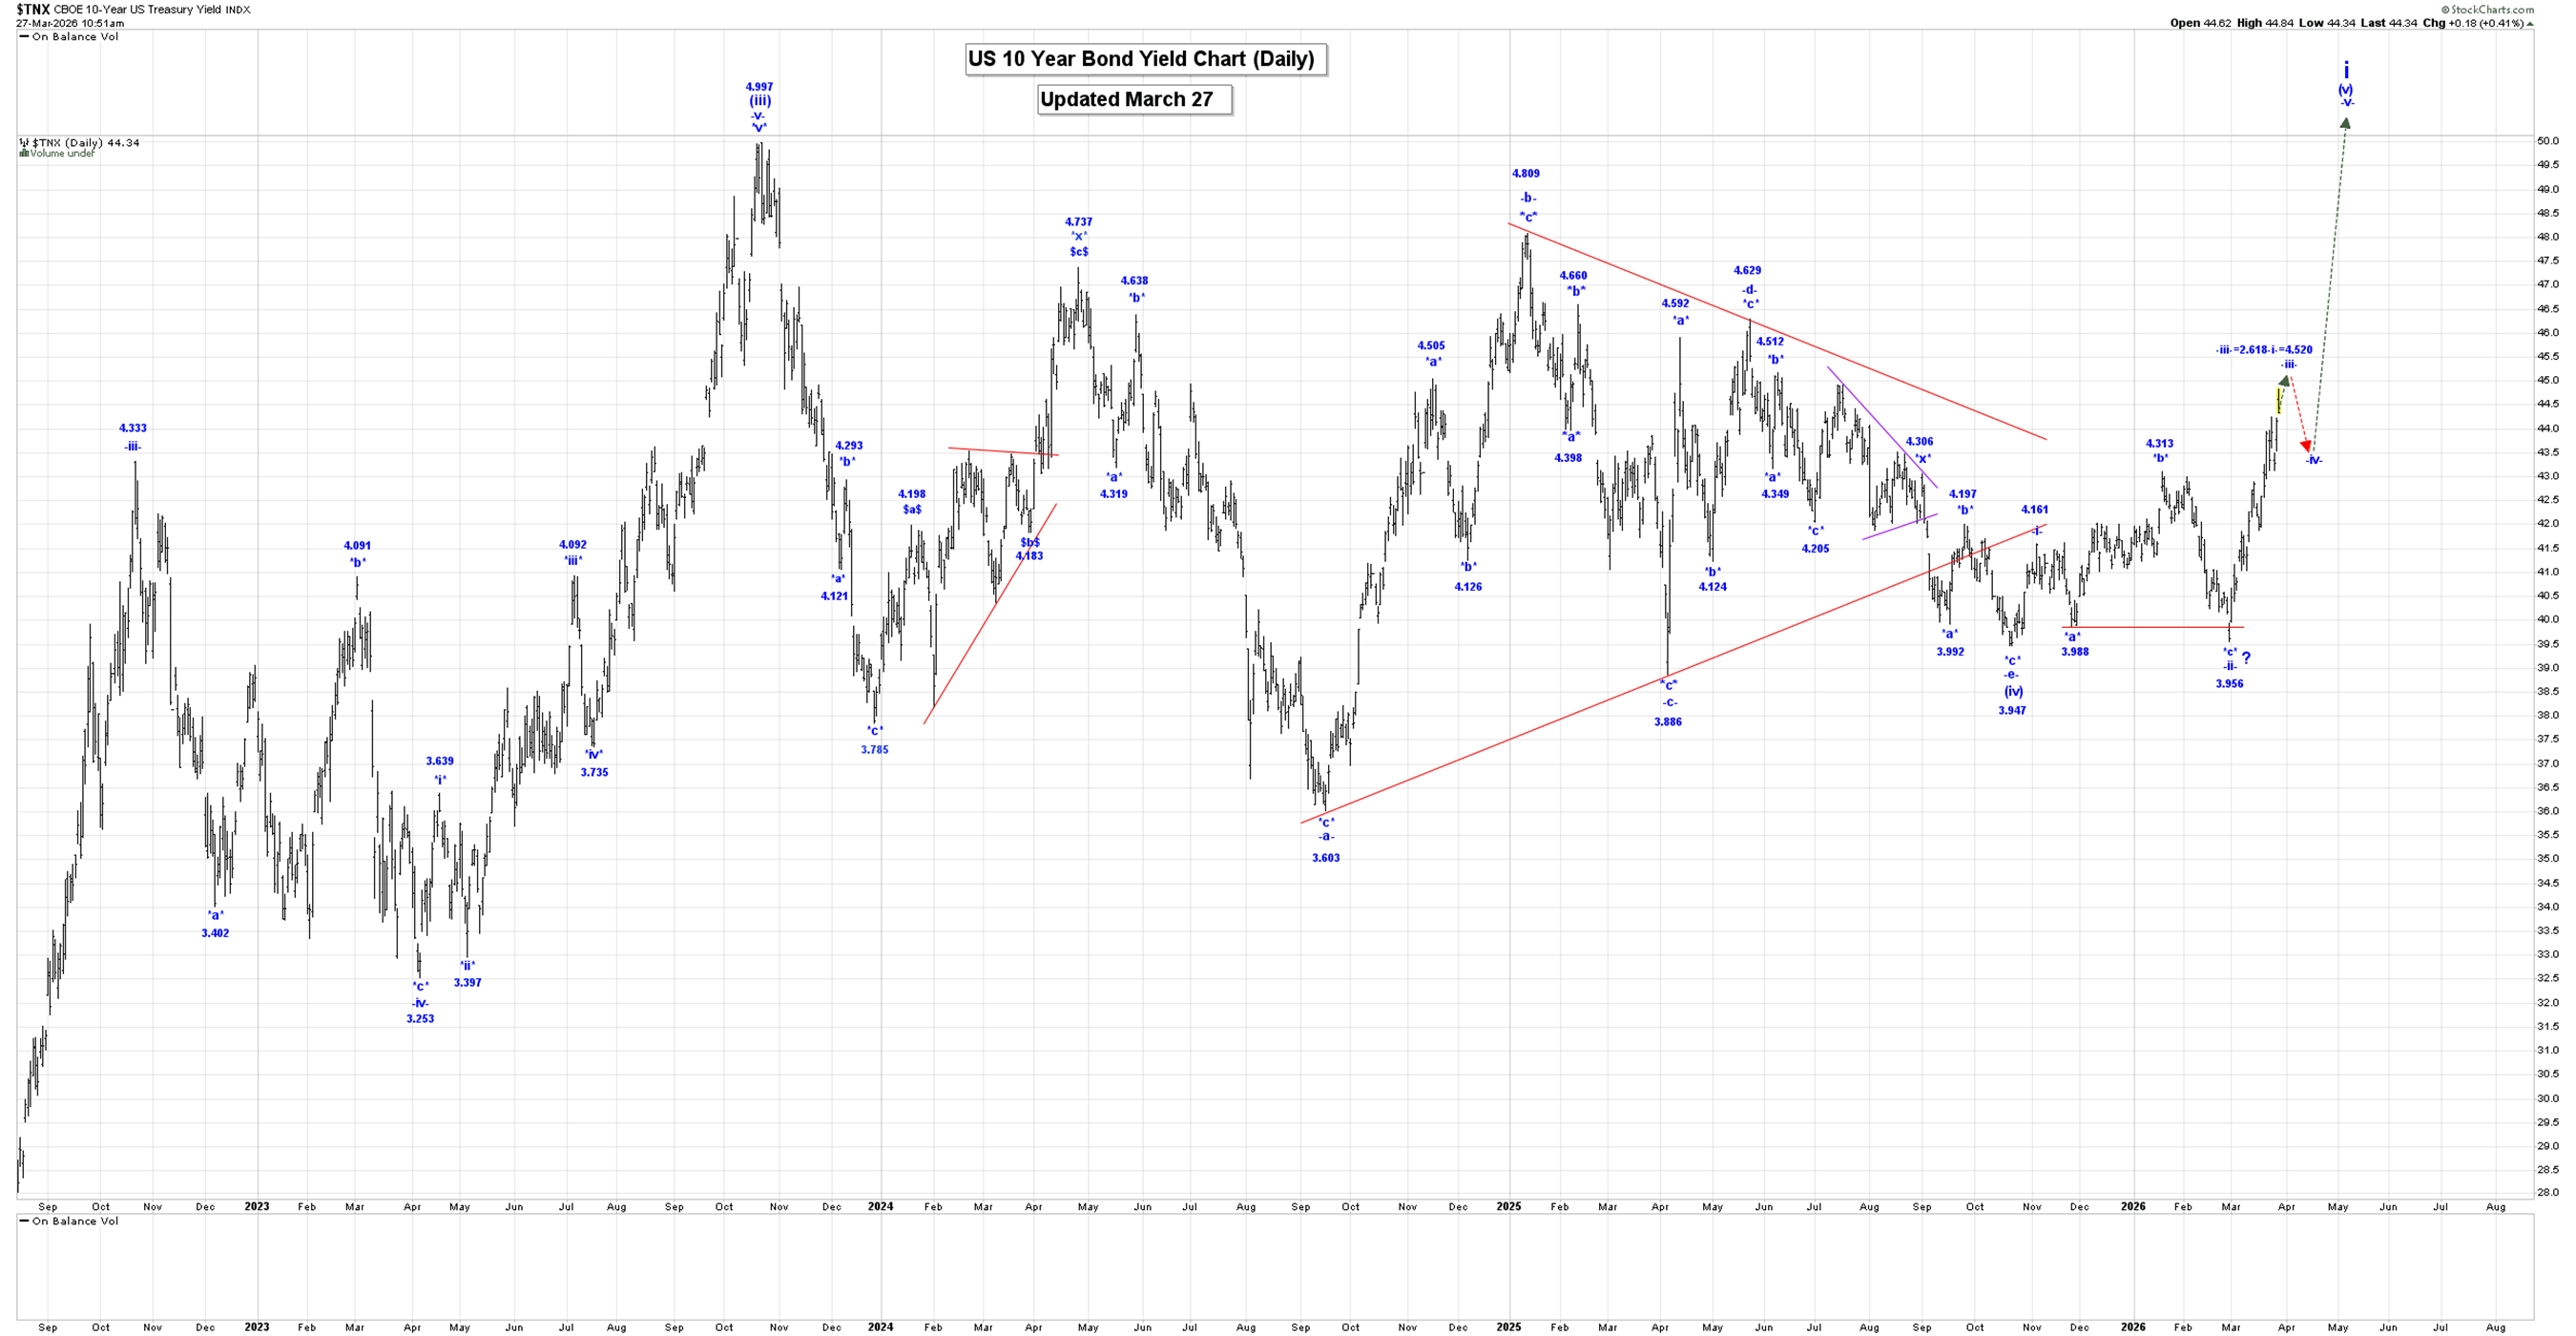
The Captain’s daily 10yr rates chart.
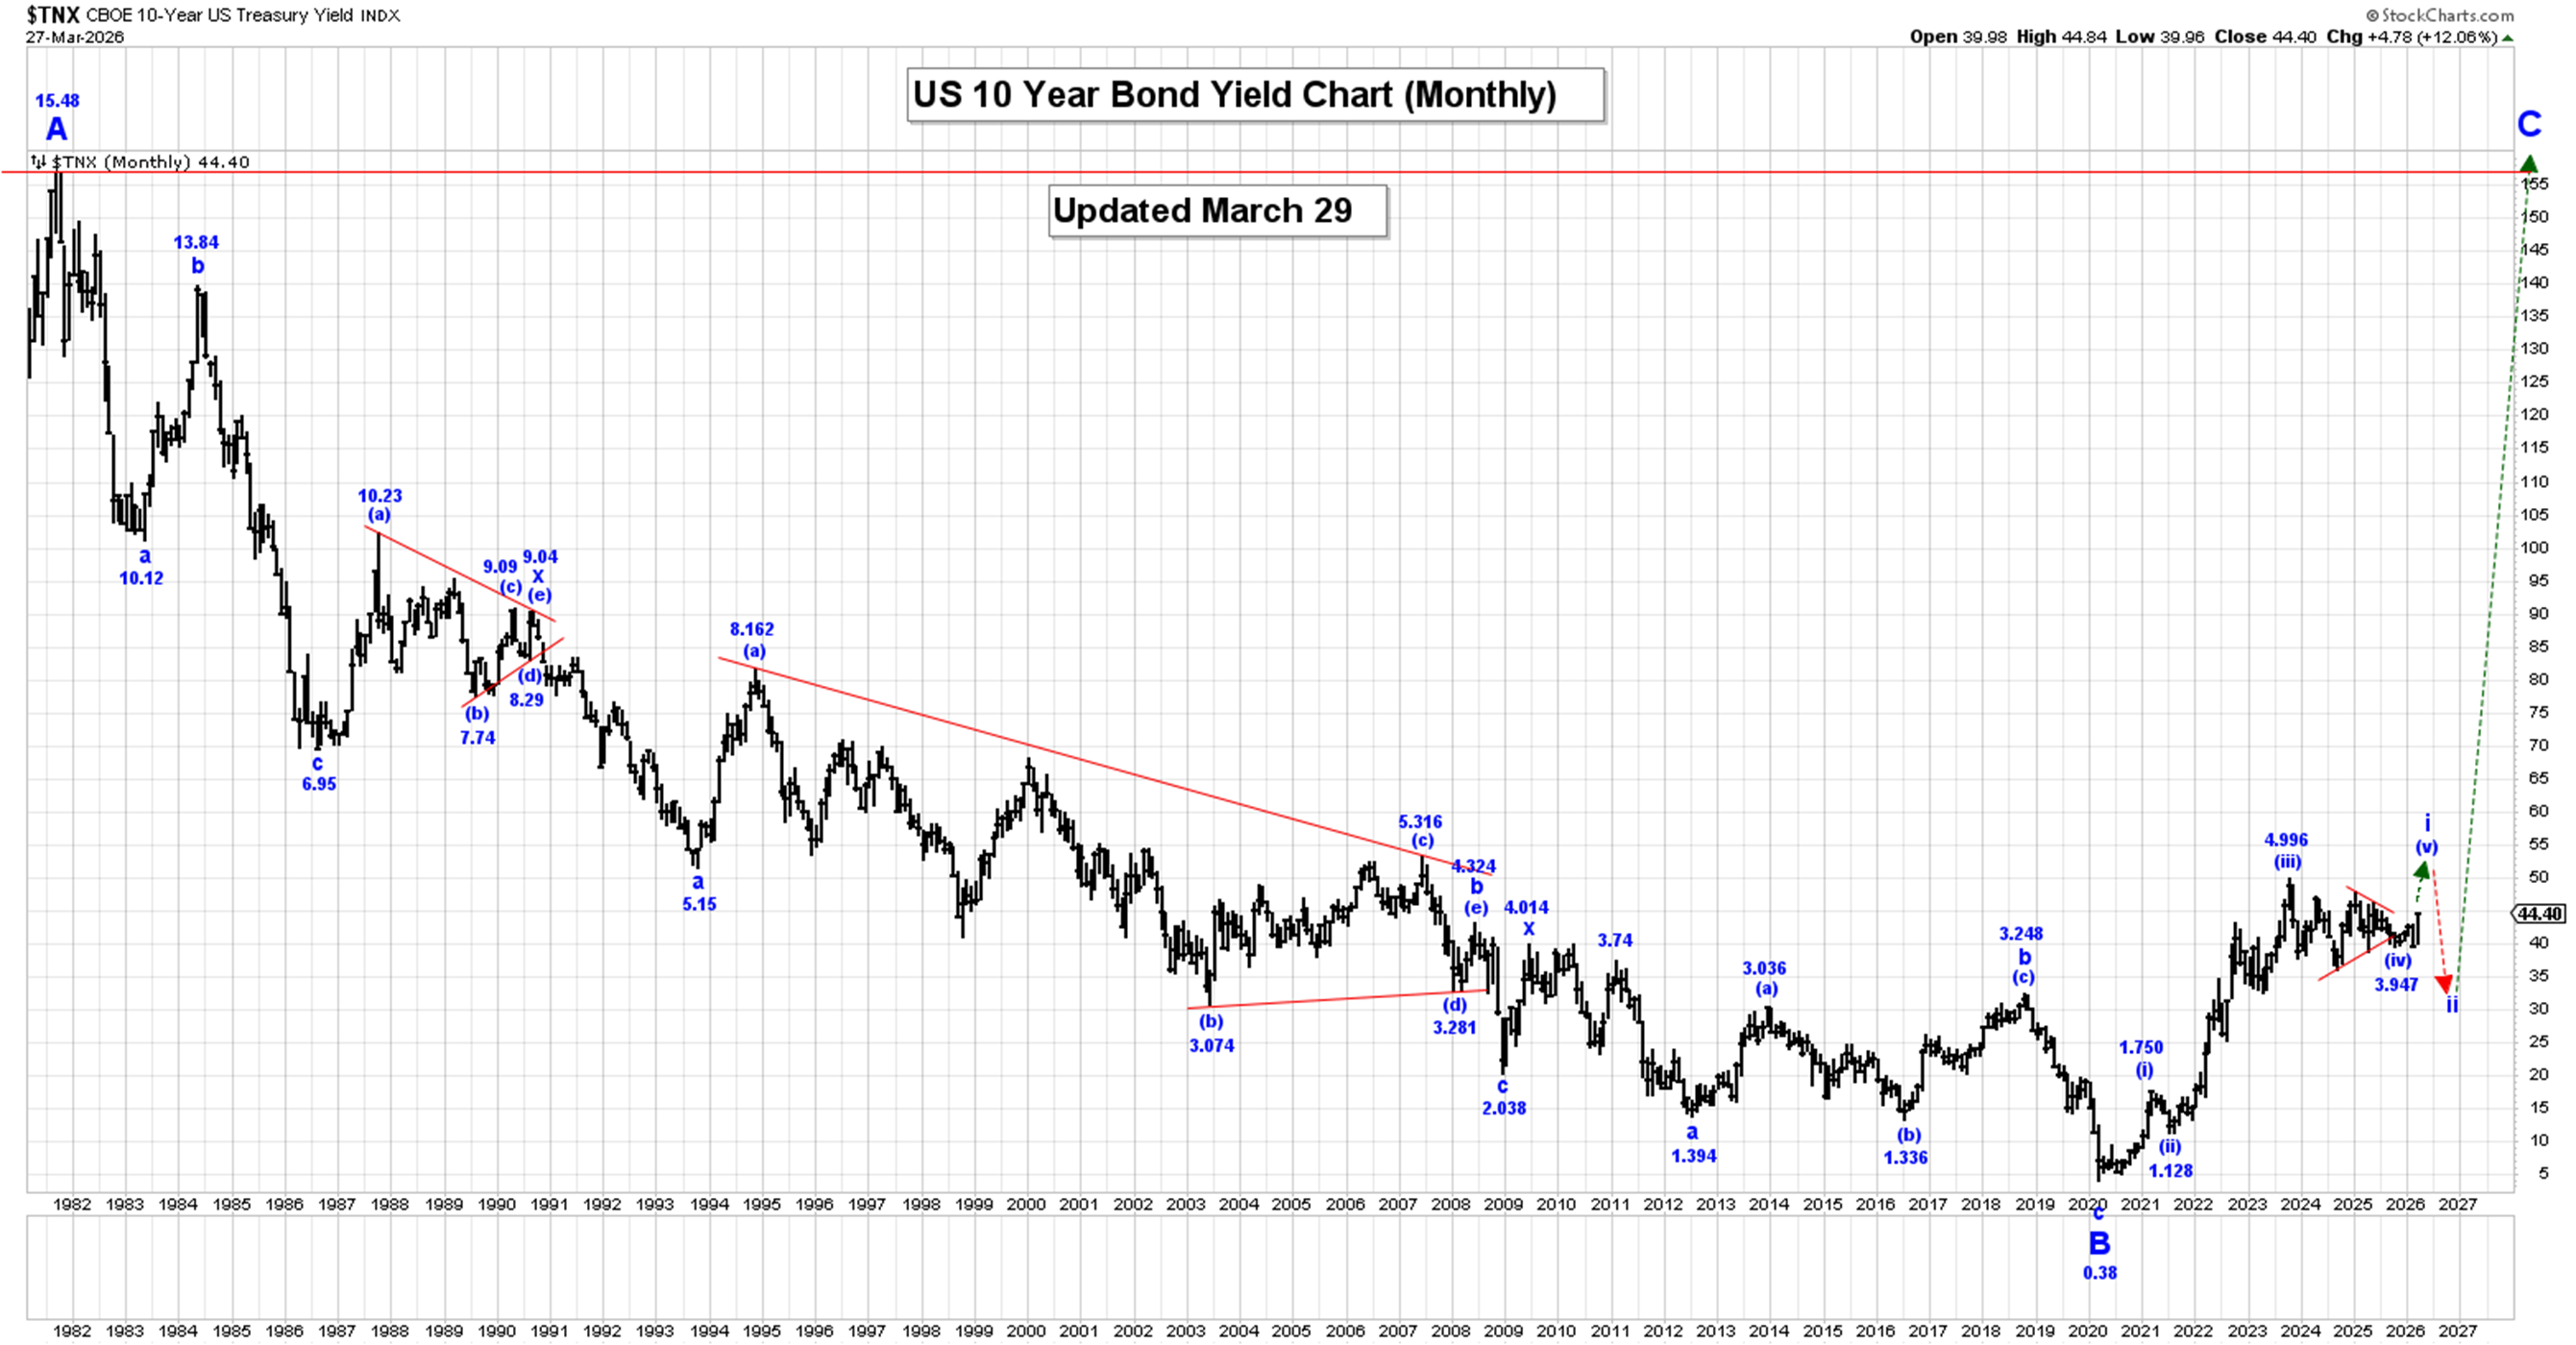
The Captain’s monthly chart.
Analysis:
Within a multi-year wave C, we are rallying in wave i, which is now still underway.
On our Long-Term Monthly Chart all of wave A ended at the 15.83 high in 1981 and since that high was made, we have fallen in a triple 3 wave correction within wave B that ended at the 0.38% level.
We are now moving higher in a multi-year wave C, that will eventually see rates reach at least the 15.83 high again!
Active Positions: Long, risking to 3.880%!
Gold
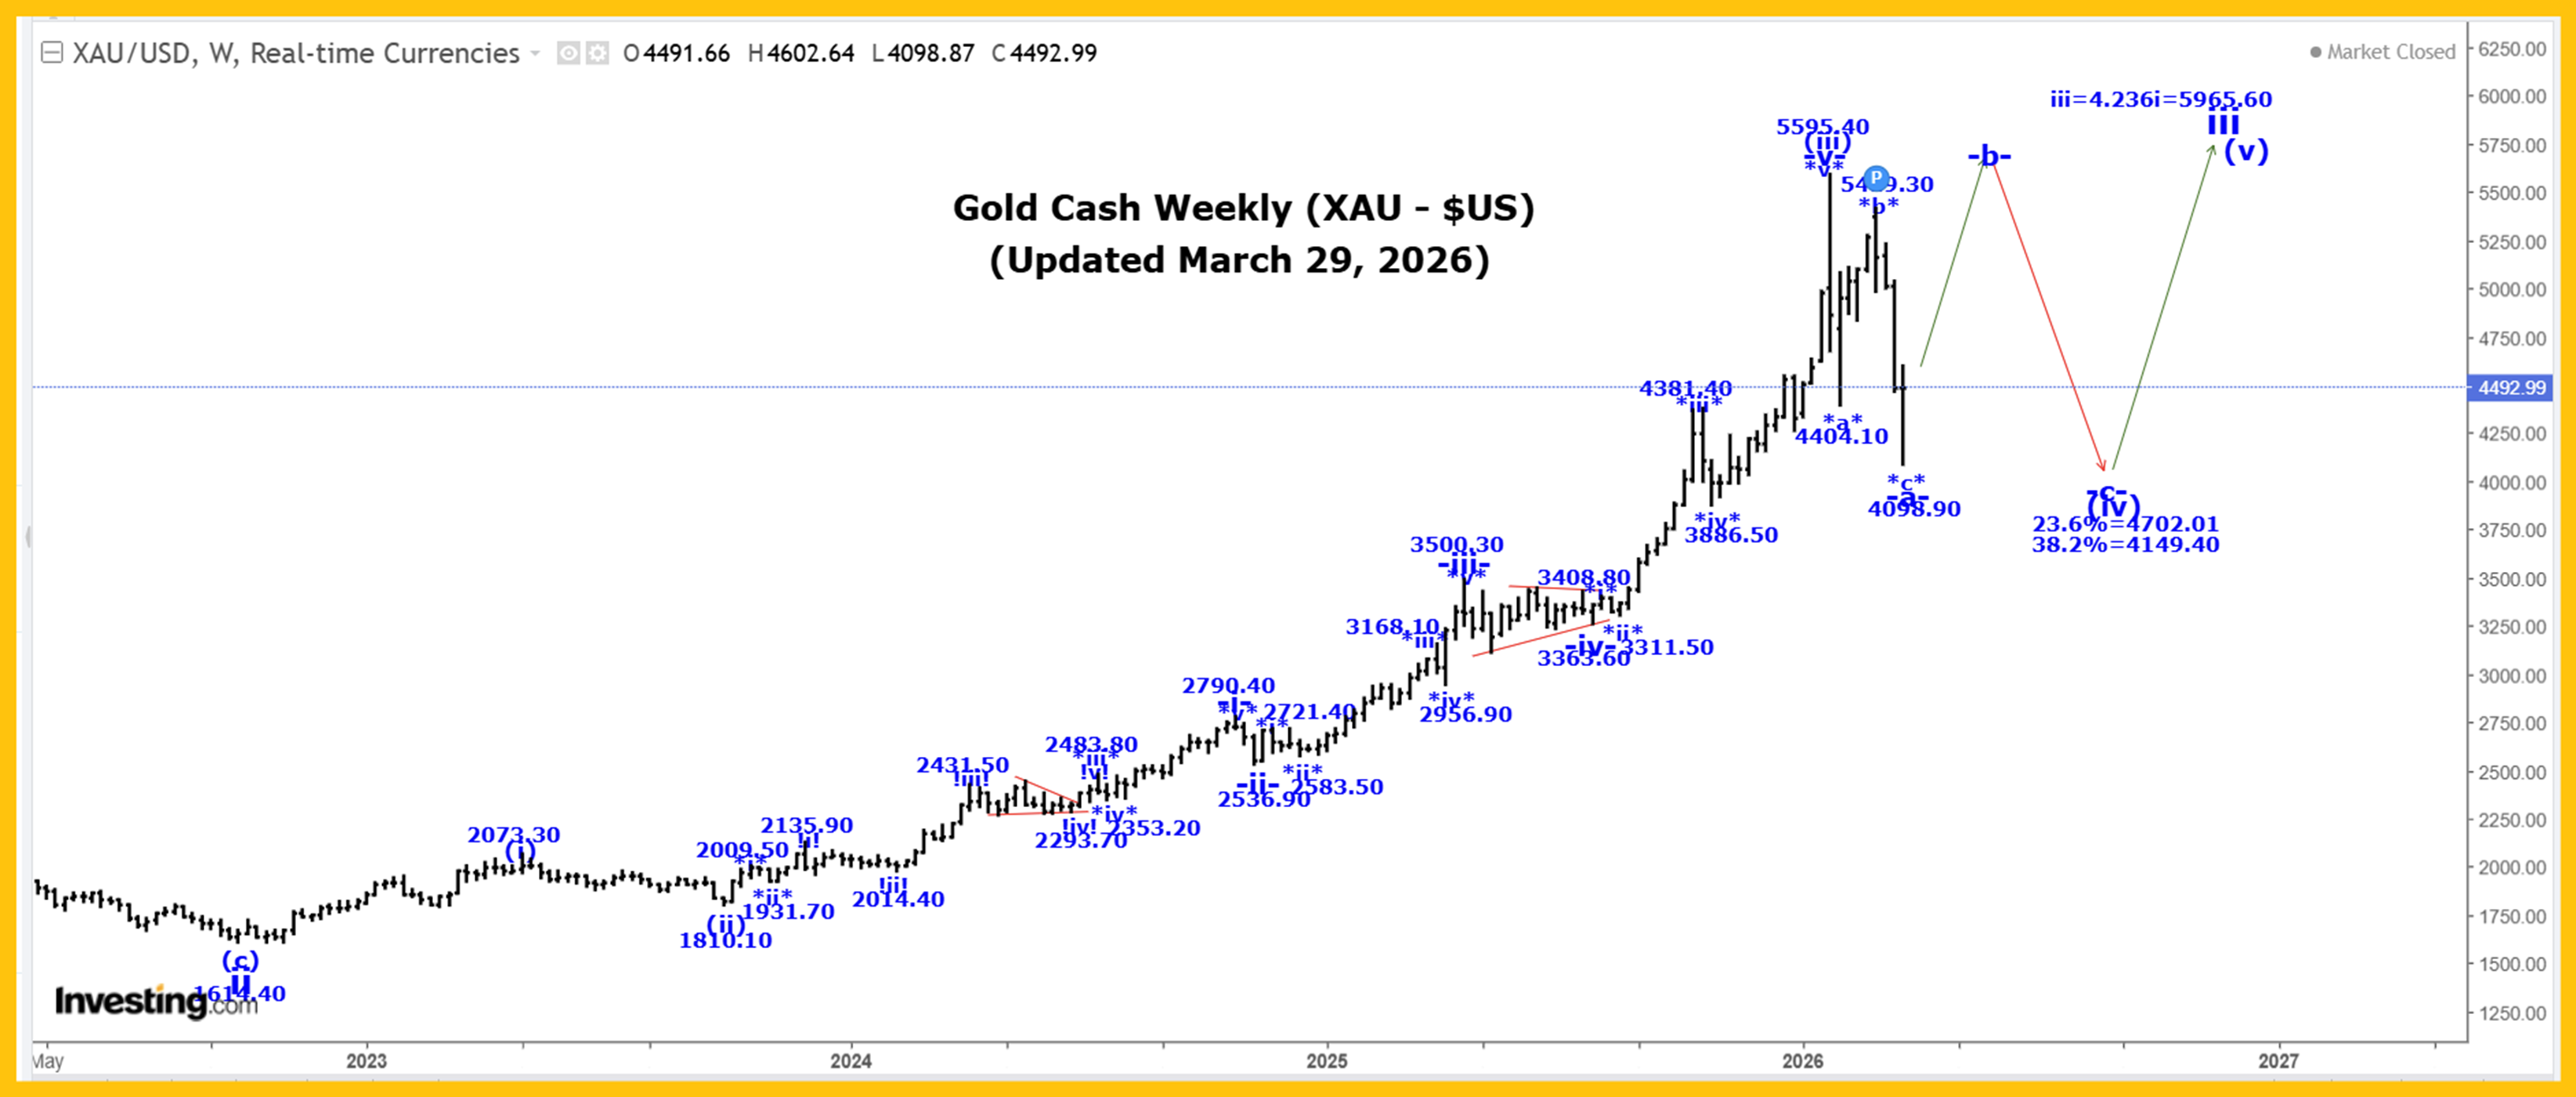
The Captain’s weekly gold chart.
Analysis:
Gold was initially sharply lower again this past week reaching a low of 4098.80, although after that low was made, we moved sharply higher, reaching a high of 4602.60, and closing almost $400 off the low, at 4492.90!
Our current long-term gold count starting from the 35.20 low made back in 1971, which remains incomplete, is as follows:
1 = 1920.80.
2 = 1046.20.
3:
i = 2073.40.
ii = 1614.40.
iii:
(i) = 2073.30.
(ii) = 1810.10.
(iii):
-i- = 2790.40.
-ii- = 2539.90.
-iii- = 3500.30.
-iv- triangle = 3363.60.
-v- = 5595.40, to complete all of wave (iii).
(iv):
-a-:
*a*= 4404.10.
*b* = 5419.30.
*c* = 4098.80, complete all of wave -a- of (iv).
A very powerful wave (iii) of iii is now complete at the 5595.40 high and we now falling in a multi-month wave (iv), correction that has the following retracement levels:
23.6% = 4702.00
38.2% = 4149.40.
Within wave (iv), we still believe that it is going to take some time for it to be complete, so we are suggesting that only wave -a- of (iv) ended at 4098.80 and if that is the case than we are starting to move higher in wave -b-.
Since wave -a- was a three-wave pattern then we expect wave -b- to rally back to at least near the all-time high or perhaps even exceed it before it ends.
If wave (iv) becomes a flat or irregular type correction than after wave -b- ends we expect a wave -c- drop back to at least the wave -a- low of 4098.80 before all of wave (iv) ends.
If wave (iv) becomes a large bullish triangle then it will consist of 5 legs, and we will NOT return to the wave -a- low, before all of wave (iv) ends.
In all cases, we should expect gold to move higher in wave -b-.
Projections for the end of wave 3 are:
3 = 2.618(1) = 5936.00.
3 = 4.236(1) = 9033.60!
Active Positions: Flat!
Silver
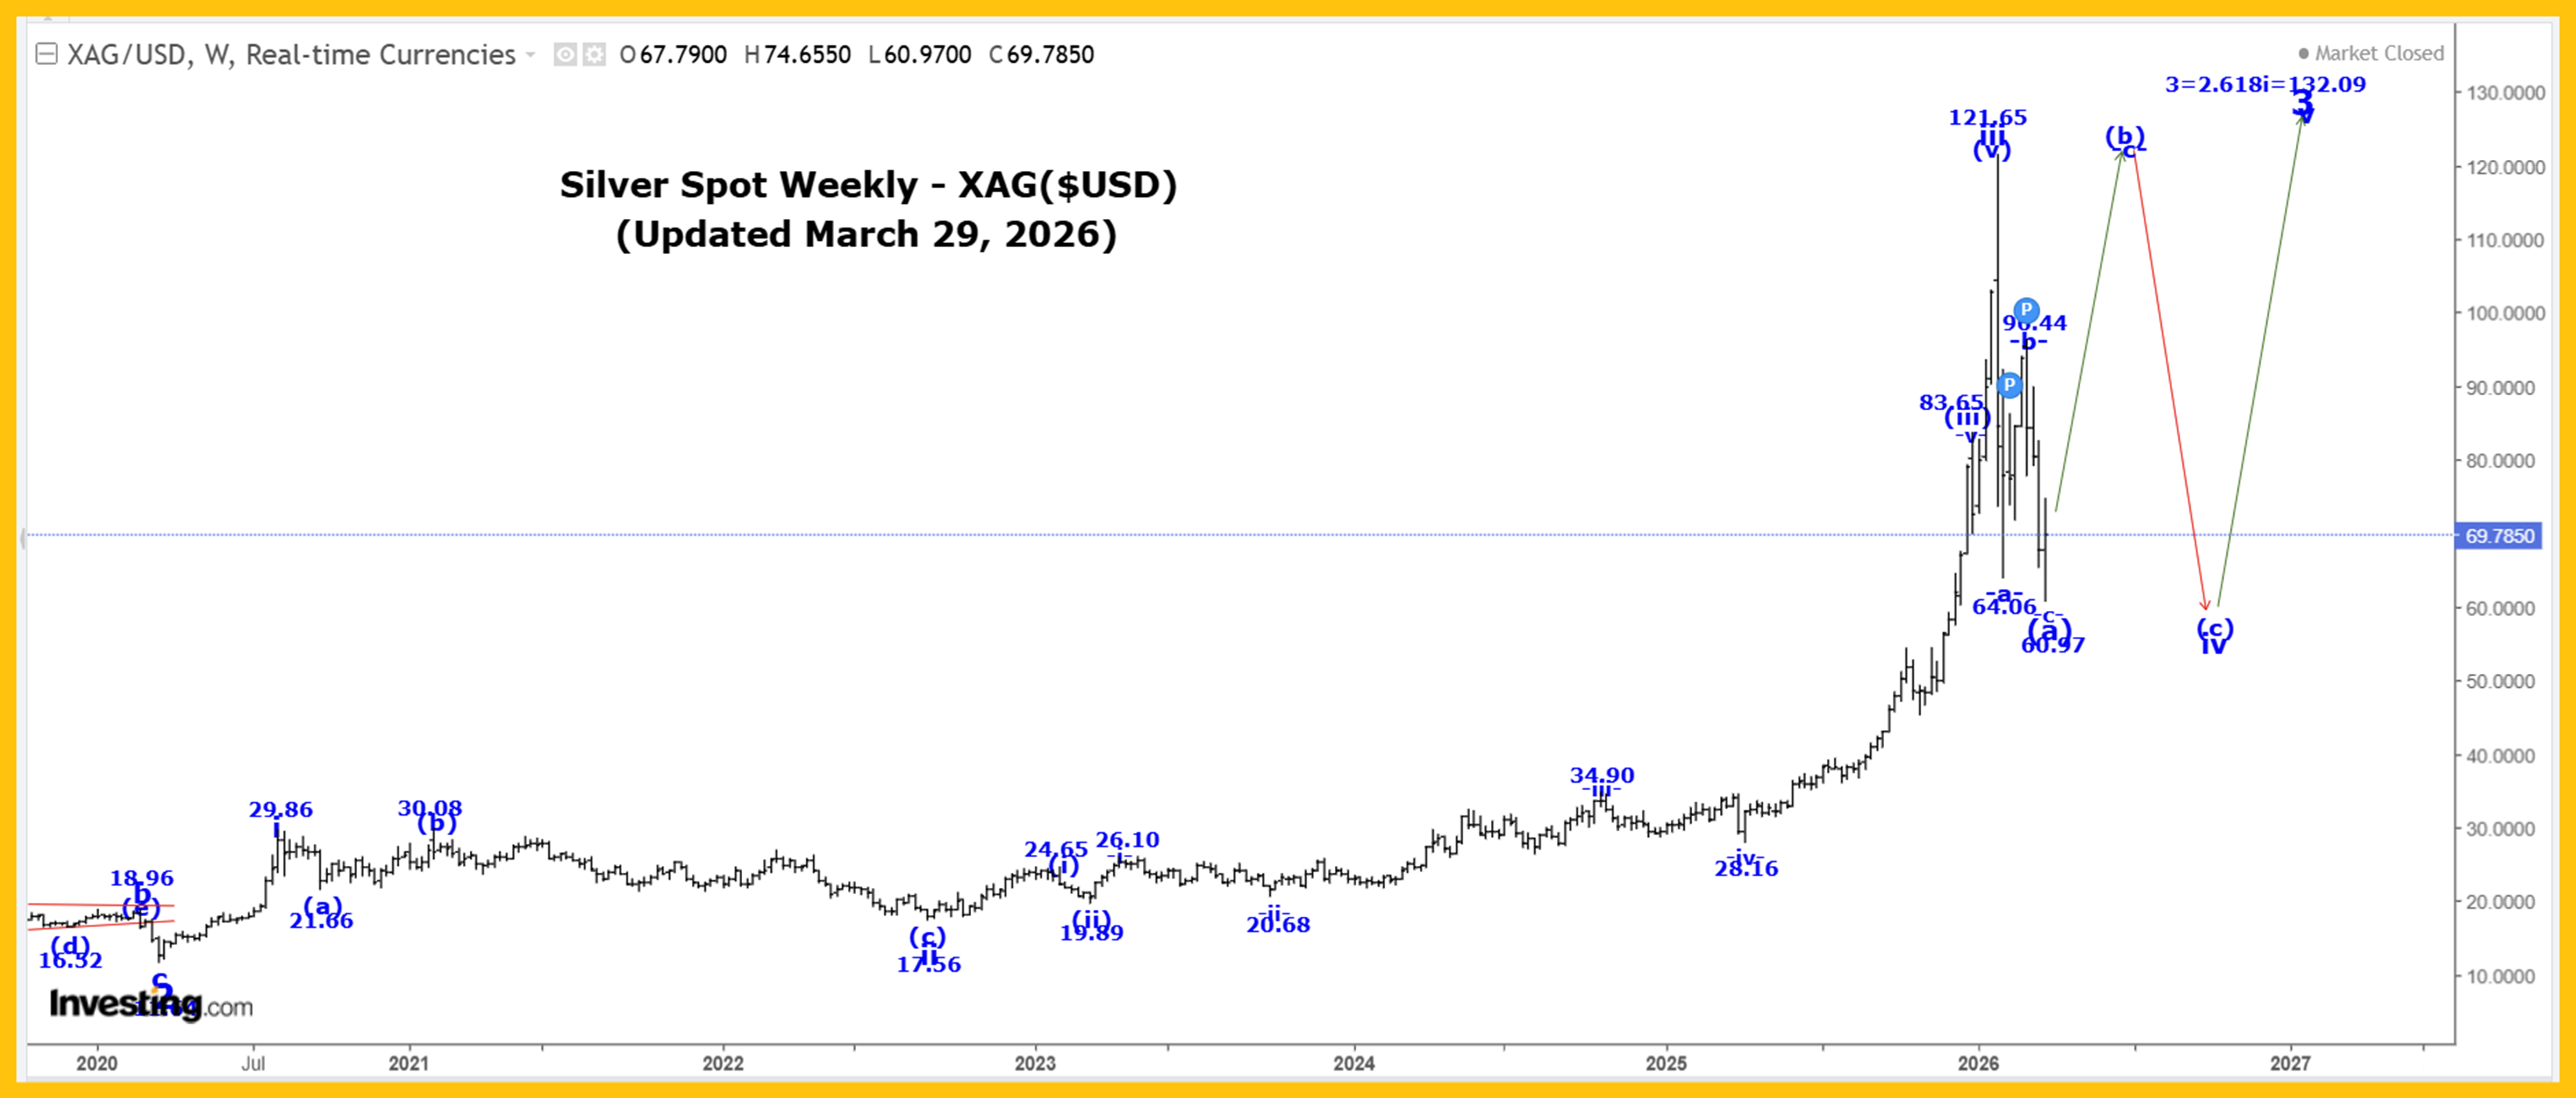
The Captain’s weekly silver chart.
Analysis:
Silver was initially sharply lower again this past week reaching a low of 60.97, although after that low was made, we moved sharply higher reaching a high 74.65, closing higher at 69.78!
A very powerful wave iii ended at the 121.65 high and we are now falling in a multi-month wave iv correction that has the following retracement level:
50% = 69.61.
Within wave iv, we still believe that it is going to take some time for it to be complete, so we are suggesting that only wave (a) of iv ended at 60.97 and if that is the case than we are starting to move higher in wave (b).
Since wave (b) was a three-wave pattern then we expect wave (b) to rally back to at least near the all-time high (or perhaps even exceed it!) before it ends.
If wave (b) becomes a flat or irregular type correction than after wave (b) ends we expect a wave (c) drop back to at least the wave (a) low of 60.97 before all of wave iv ends.
If wave iv becomes a large bullish triangle, then it will consist of 5 legs, and we will NOT return to the wave (a) low, before all of wave iv ends.
In all cases, we should expect silver to move higher now in wave (b)!
In the very long term, we completed all of wave III at 49.00 in 1980 and all of wave IV at 3.55 in 1993. We are now working on wave V and within wave V we have the following count:
1 = 49.56.
2 = 11.64,
3 projection is updated to 3 = 2.618(1) = 132.09.
Active Positions: Long, through PSLV:TSX!
Active Positions: Flat!
Thank-you!
Captain Ewave & Crew
About the author