The fundamentals for silver and gold are very strong, and with all the massive bailouts and stimulus, which have increased debt levels, they are just getting stronger. Until a significant portion of these debts is repaid or defaulted on, it would be foolish to talk about a top in precious metals.
The repayment of debt (or default on debt – which is more likely) will result in significantly reduced economic activity. Significantly reduced economic activity will have a negative effect on the stock market, which in this case, will likely result in a huge crash. For now, the stock market is defying the reality of the bleak economic outlook, but not for long.
It is these conditions (a deflating debt bubble) that will drive gold and silver prices significantly higher.
Why? Because this will not just be a normal type of reduced economic activity (recession), but one in which the monetary system as a whole is questioned and collapses (due to the excessive debt levels).
In a crisis like this, it will be all about preserving value, which will make gold and silver the most wanted goods. The excessive debt levels we have currently, mostly is represented by artificial value or promised value (in bond, stocks etc.); value that will never be realized. We now have a great opportunity to convert that soon to be destroyed value into real value, by buying gold and silver.
Silver will be the biggest winner no matter how you look at it. Just remember, silver is still trading at 36% of its 1980 high, whereas gold is more than double the 1980 peak.
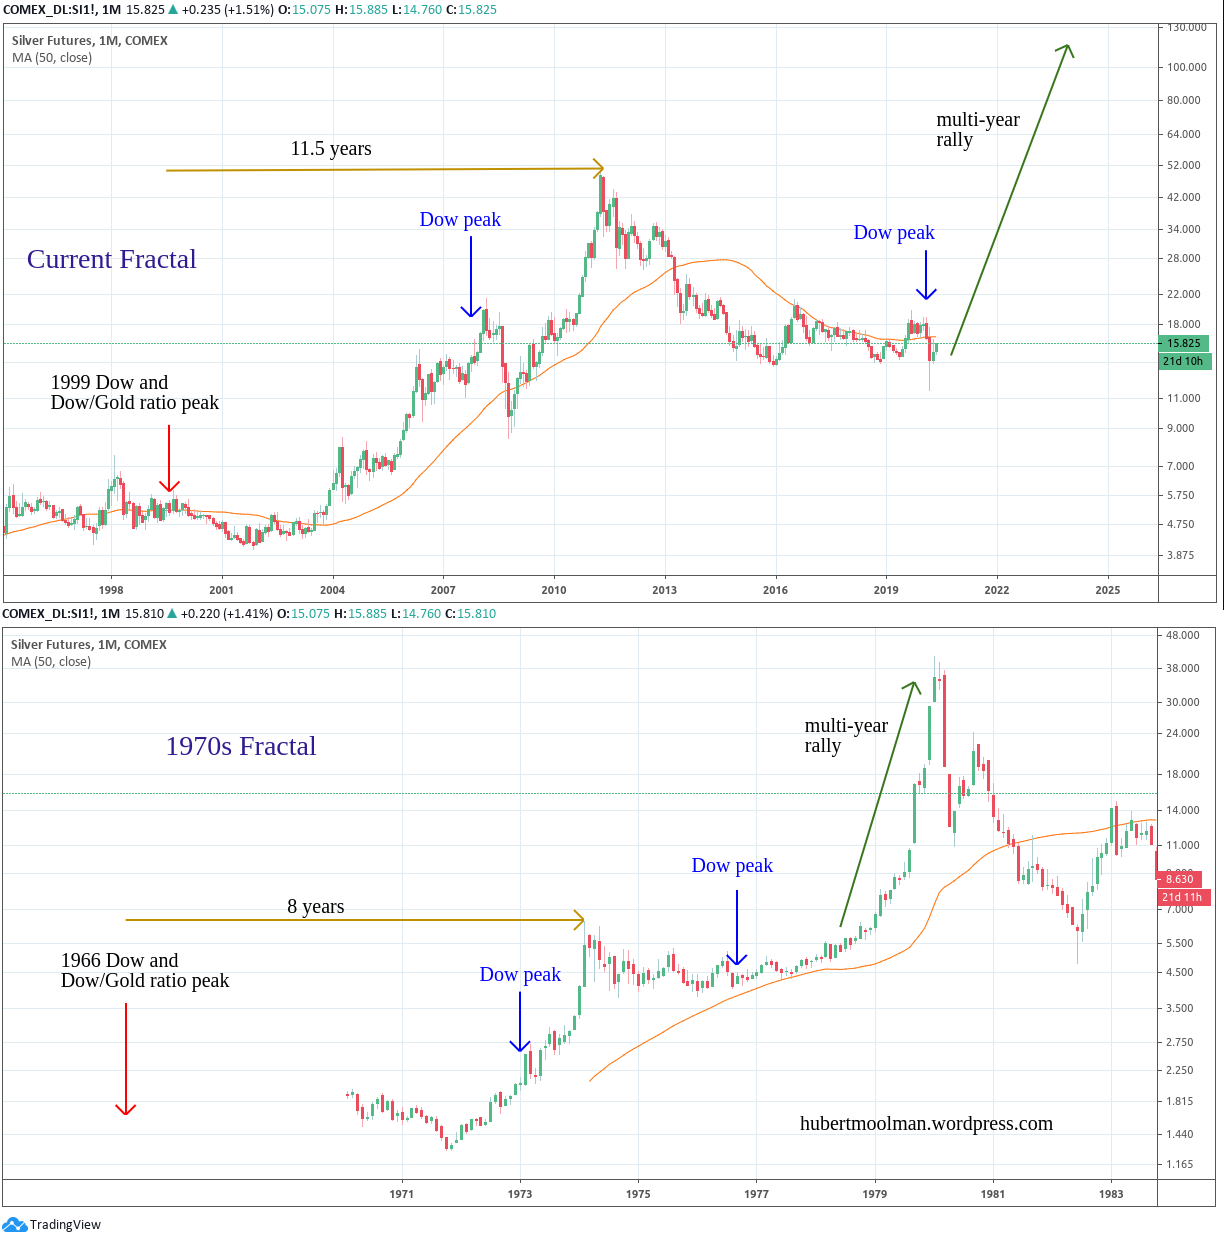
Keep tracking this 70s silver fractal, since we are close to a major market revaluation of silver:
Click on chart to ENLARGE
The bottom chart is silver from 1966 to the end of 1979 and a few years beyond, and the top is silver from 1989 to May 2020. I have highlighted key events on both charts to show how the structure of the two bull markets could be similar. The current structure is bigger in terms of time.
The Dow/Gold ratio peaked in January of 1966, before the start of the precious metals bull market. In a similar manner the Dow/Gold ratio peaked in August 1999, before the start of the silver and gold bull market.
Some time before the first important peak of the silver price in February 1974, the Dow again made a significant peak(in January 1973). This is very similar to the October 2007 peak of the Dow, which came before the April 2011 peak in silver.
Again, after the Dow peak of February 1974, there was another significant Dow peak in December 1976, some time before the peak of the silver bull market in January 1980. The Dow recently made a peak (2020), which could be its ultimate peak for its long running bull market. If this is actually the peak, then it is similar to the Dow peak of December 1976, which came some time before the peak of the silver bull market.
So, if the Dow top is actually in, we could be in the midst of a multi-year silver rally like the one from 1976 to 1980. However, this time the structure of the current financial system is likely too weak to continue in its current form, and the problems (or debt) is far too big.
The monetary system will collapse, which means the price of the debt will be paid, and will mostly be paid in the form of severe economic distress. In other words, the standard of living for many will be much lower.
For more of this kind of fractal analysis, you are welcome to subscribe to my premium service. I have also recently completed a Silver Fractal Analysis as well as a Gold Mining Fractal Analysis Report.


