Previously, I have shown how Bitcoin is leading silver higher, and vice versa.
This makes perfect sense in these times, since it is all about the US dollar. Assets that offer a “safehaven” from US dollar meltdown will go higher in some sort of related pattern.
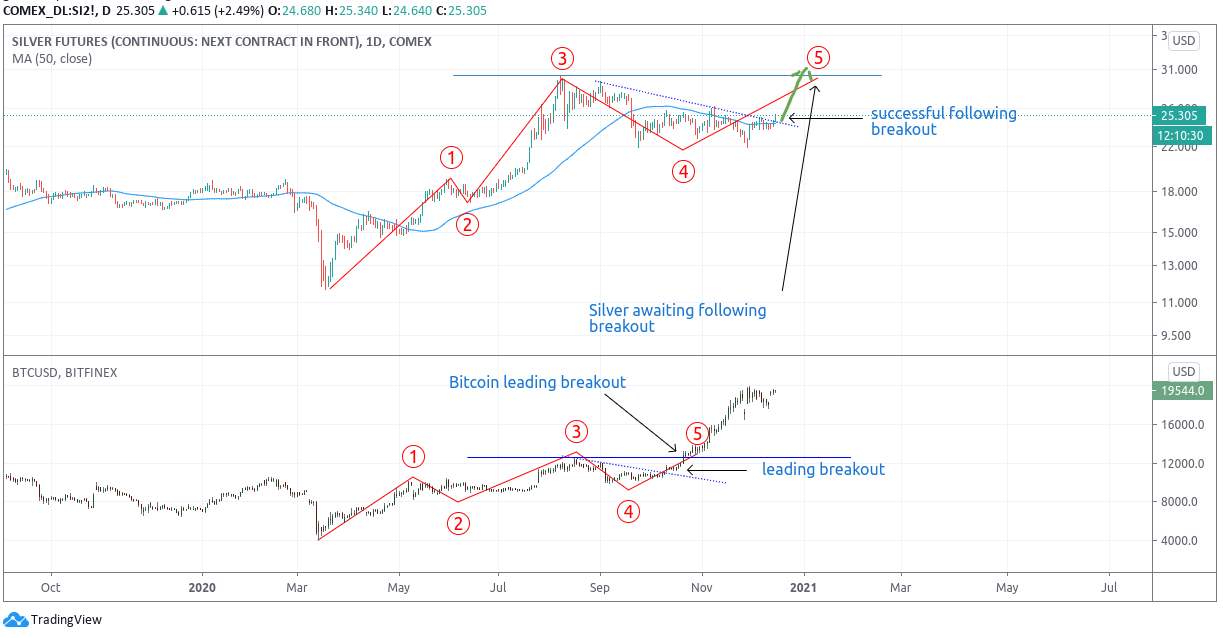
Here is an update on that analogue where Bitcoin is leading silver higher (you can find the analogue where silver is leading Bitcoin higher in the previous update):

I have marked similar patterns (1 to 5) on both charts to show how they could be similar. Bitcoin has already exceeded its point 3 high.
Silver is still lagging below the recent high (point 3 high), and will eventually follow Bitcoin higher than point 3 in this comparison.
Since the previous update, silver has followed Bitcoin by breaking out at the dotted blue line. This now clears the way for a run to the blue line (point 3 high), and eventually a breakout there.
We could see silver catching up over the coming weeks and months, now that Bitcoin has set the bar even higher since the last update (as expected).
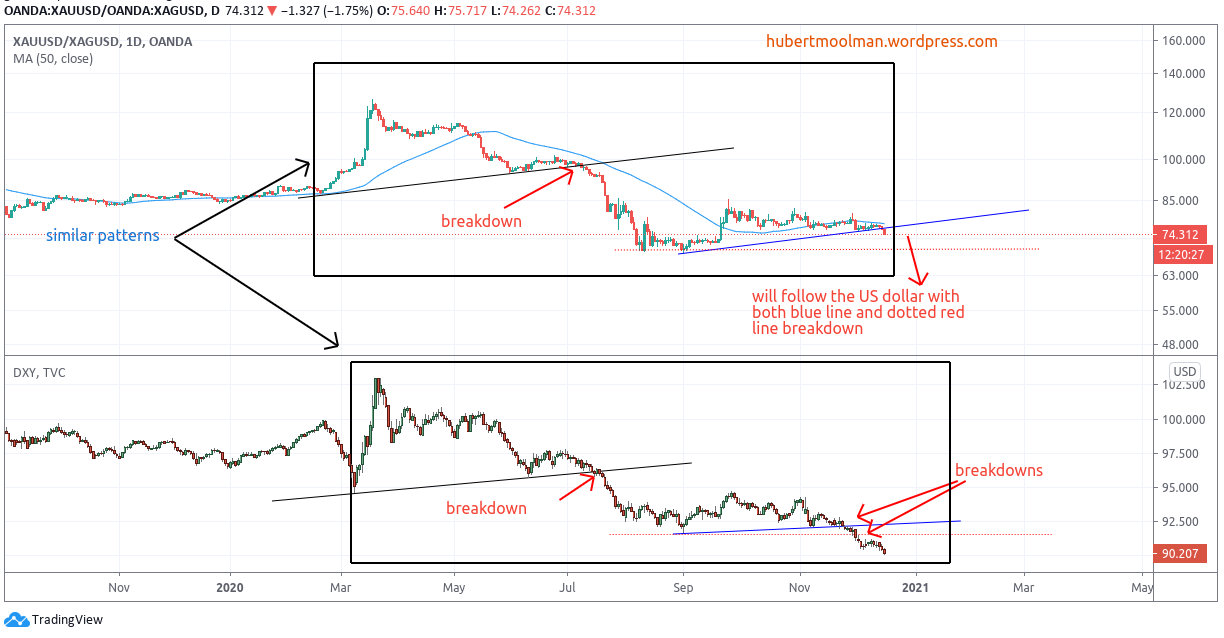
US dollar (US Dollar Index) price action also confirms that a big silver rally is on the way. Below is a comparison of the Gold/Silver ratio and the US dollar:

Since the March, the US Dollar index and the Gold/Silver ratio has been forming similar patterns. The one is often a leading indicator for the other one, by way of similar breakdowns following one another on the relevant charts.
The US dollar has made two significant breakdowns recently (at the blue line and the dotted red line). The Gold/Silver ratio is in process of following those breakdowns.
This could be a catalyst for a massive silver rally over the coming weeks and months, especially since the US Dollar is likely to remain under severe pressure.
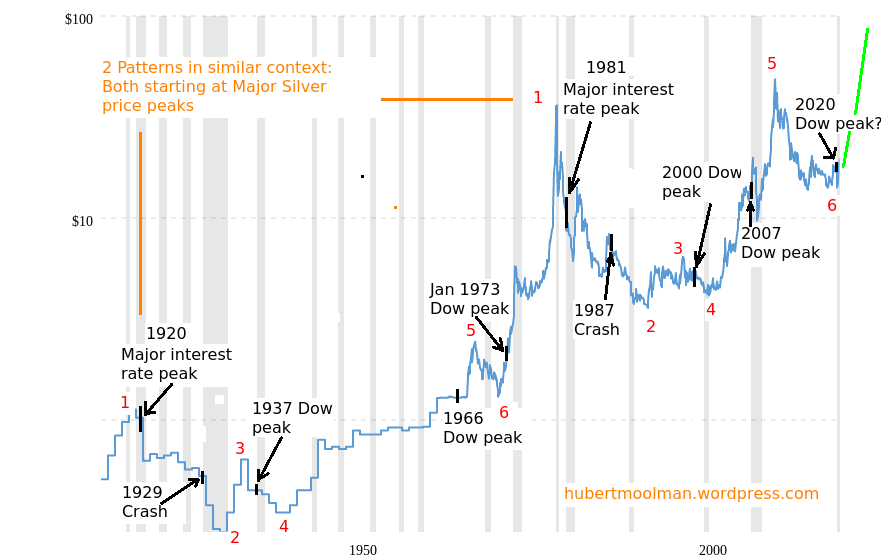
Just keep the big picture in mind:

For more on this, and this kind of fractal analysis, you are welcome to subscribe to my premium service. I have also recently completed a Silver Fractal Analysis Report as well as a Gold Fractal Analysis Report.

