It was another very volatile week in the SP500, as we moved sharply lower, reaching a low of 6521.92, closing at 6602.99!
 The Captain’s 120-minute SP500 chart.
Here’s our take on the action:
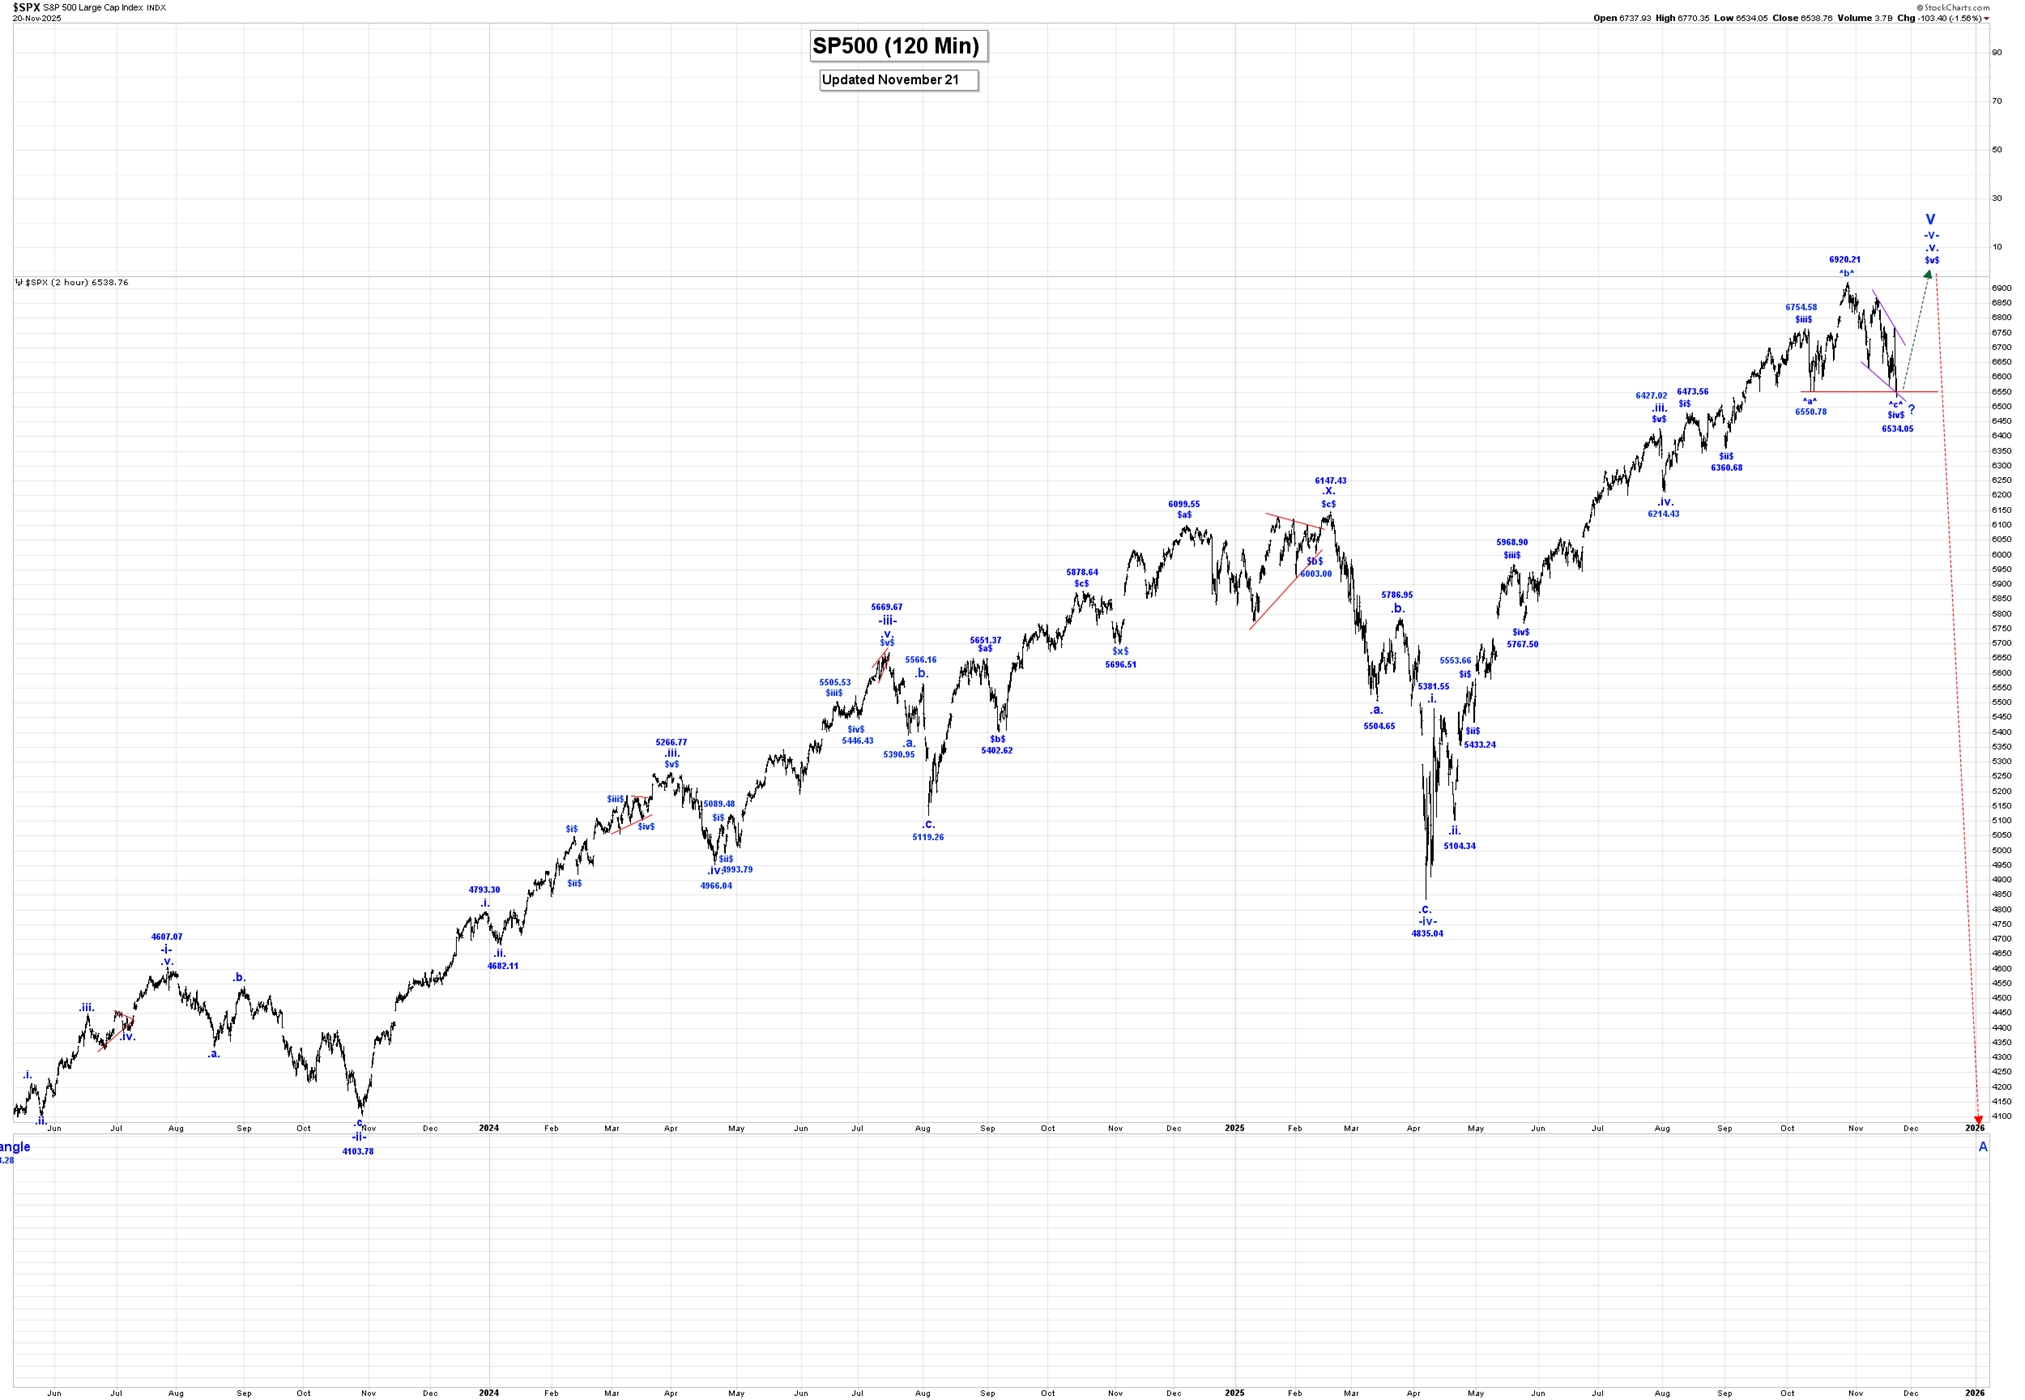
Our internal wave count for wave -v- has been updated as follows:
.i. = 5381.55.
.ii. = 5104.34.
.iii. = 6427.02.
.iv. = 6214.43
.v., with an internal wave count of:
$i$ = 6473.56.
$ii$ = 6360.68.
$iii$ = 6754.58.
$iv$ is still underway?
$v$ rally after wave $iv$ ends.
Our wave $iv$ bullish triangle option has been eliminated, but we are still not convinced that wave $iv$ is complete, as shown on our 60-minute SP500 Chart.
If our short-term analysis is correct, then we should expect the Sp500 to move higher from these levels in wave $v$ to make a new all-time high in wave $v.$
We still suspect the completion of wave V will be marked by a key reversal day and a historic single-day drop in the SP500 of likely 500 points drop more.
After wave V ends, we expect a large drop in wave A to begin.
 The weekly chart.
Within v of V, wave (iv) ended at 4835.04, and we are moving higher in wave (v), which has the following updated internal wave count:
.i. = 5381.55.
.ii. = 5104.34.
.iii. = 6427.02.
.iv. = 6214.43.
.v. is still underway.
Our bullish wave $iv$ triangle option was eliminated, but we still think the current volatility is all part of a complex wave $iv$ correction, which may have ended at the 6521.92 low.
If that is the case, then we should see one more rally in wave $v$ to all-time new highs before this market really moves sharply lower, at the start of a multi-year correction.
The other option is that all of wave V ended at the all-time high of 6920.34, and we have begun the move sharply lower.
Trading Recommendation: Go short, with calls as stops.
Active Positions: Short with calls as our stops!
Silver Update
 The Captain’s weekly silver chart.
Long Term Update:
Silver was lower this past week, reaching a low of 48.06, closing at 49.66!
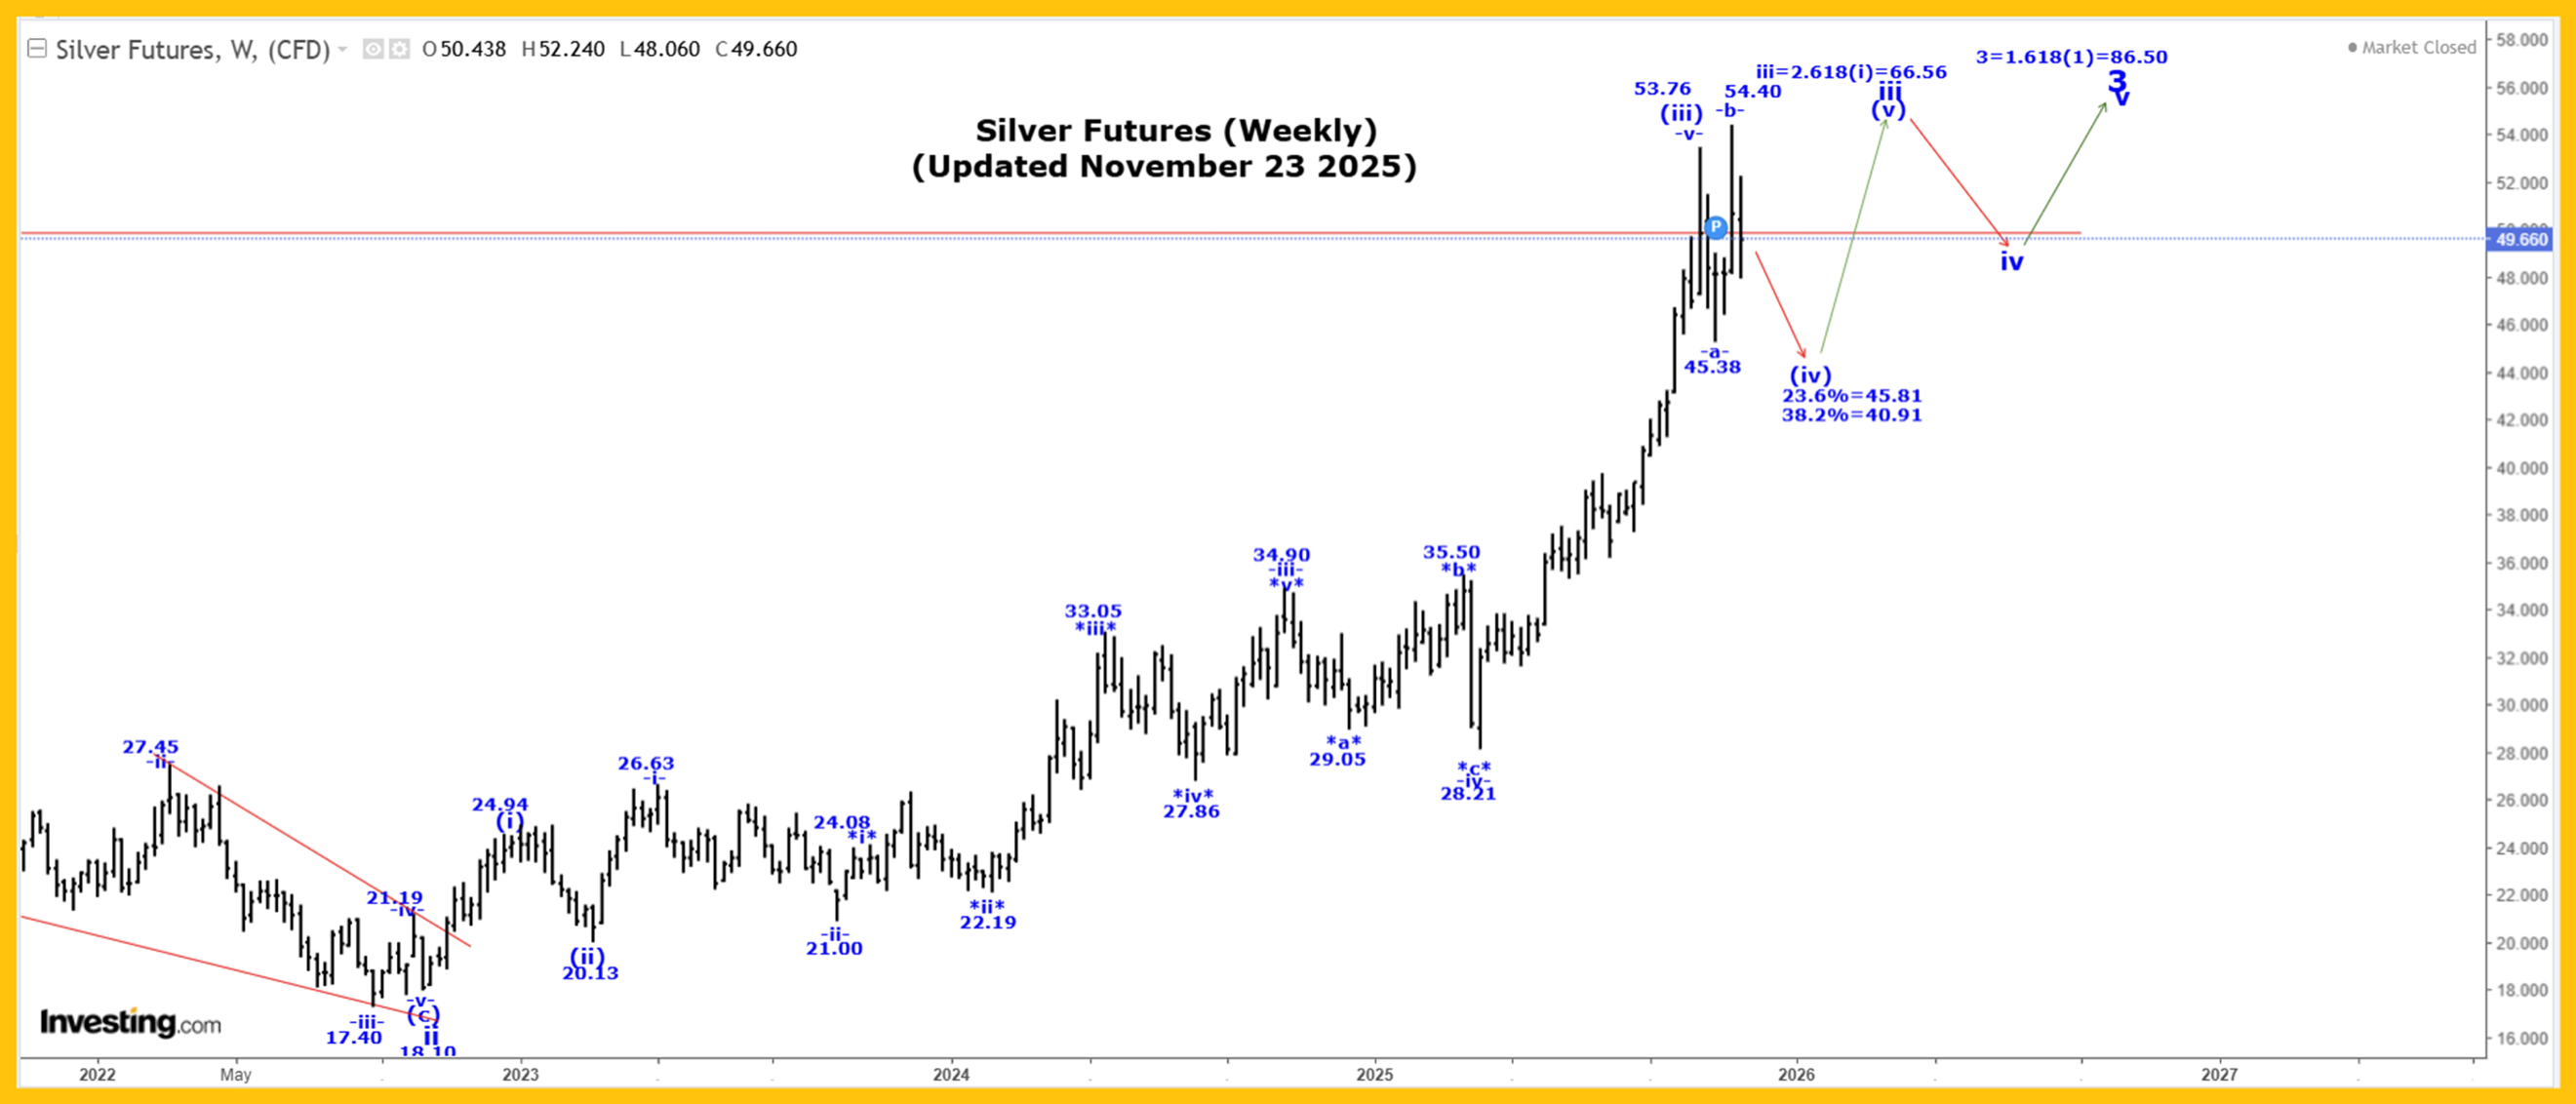
We are moving higher in wave 3, as shown on our Weekly Silver Chart. Within wave 3, we completed wave i at 29.91 and wave ii at 18.01, and we are now continuing to move higher in a subdividing wave iii. Our current and next projected endpoints for wave iii is:
iii = 2.618(i) = 66.56.
Within wave iii, we completed wave (i) at 24.39, wave (ii) at 19.94, and all of wave (iii) at the 53.76 high. We are now moving lower in a multi-month wave (iv) correction that has the following retracement levels:
23.6% = 45.81.
38.2% = 40.91.
We are now working on the assumption that wave (iv) in silver is becoming a bullish triangle formation where wave -a- ended at 45.38 and wave -b- at 54.40.
If that is the case, then we are now moving lower in wave -c-, which cannot trade below the wave -a- low of 45.38.
The other option is that wave -b- is going to become to flat or irregular type correction, where in this formation wave -c- is heading to at least the wave -a- low of 45.38, before all of wave (iv) ends.
In the very long term, we completed all of wave III at 49.00 in 1980 and all of wave IV at 3.55 in 1993. We are now working on wave V, and within wave V, we have the following count;
1 = 49.82;
2 = 11.64;
3 = First projection is 86.50!
Active Positions: Flat!
Gold Update
The Captain’s weekly gold chart.
Long Term Update:
Gold generally moved sideways this past week, although the price range was large. It closed marginally lower, at 4065.00!
Our current long-term gold count, starting from the 35.20 low made back in 1971, which remains incomplete, is as follows:
1 = 1920.80.
2 = 1046.20.
3:
i = 2073.40.
ii = 1614.40.
iii:
(i) = 2073.30.
(ii) = 1810.10.
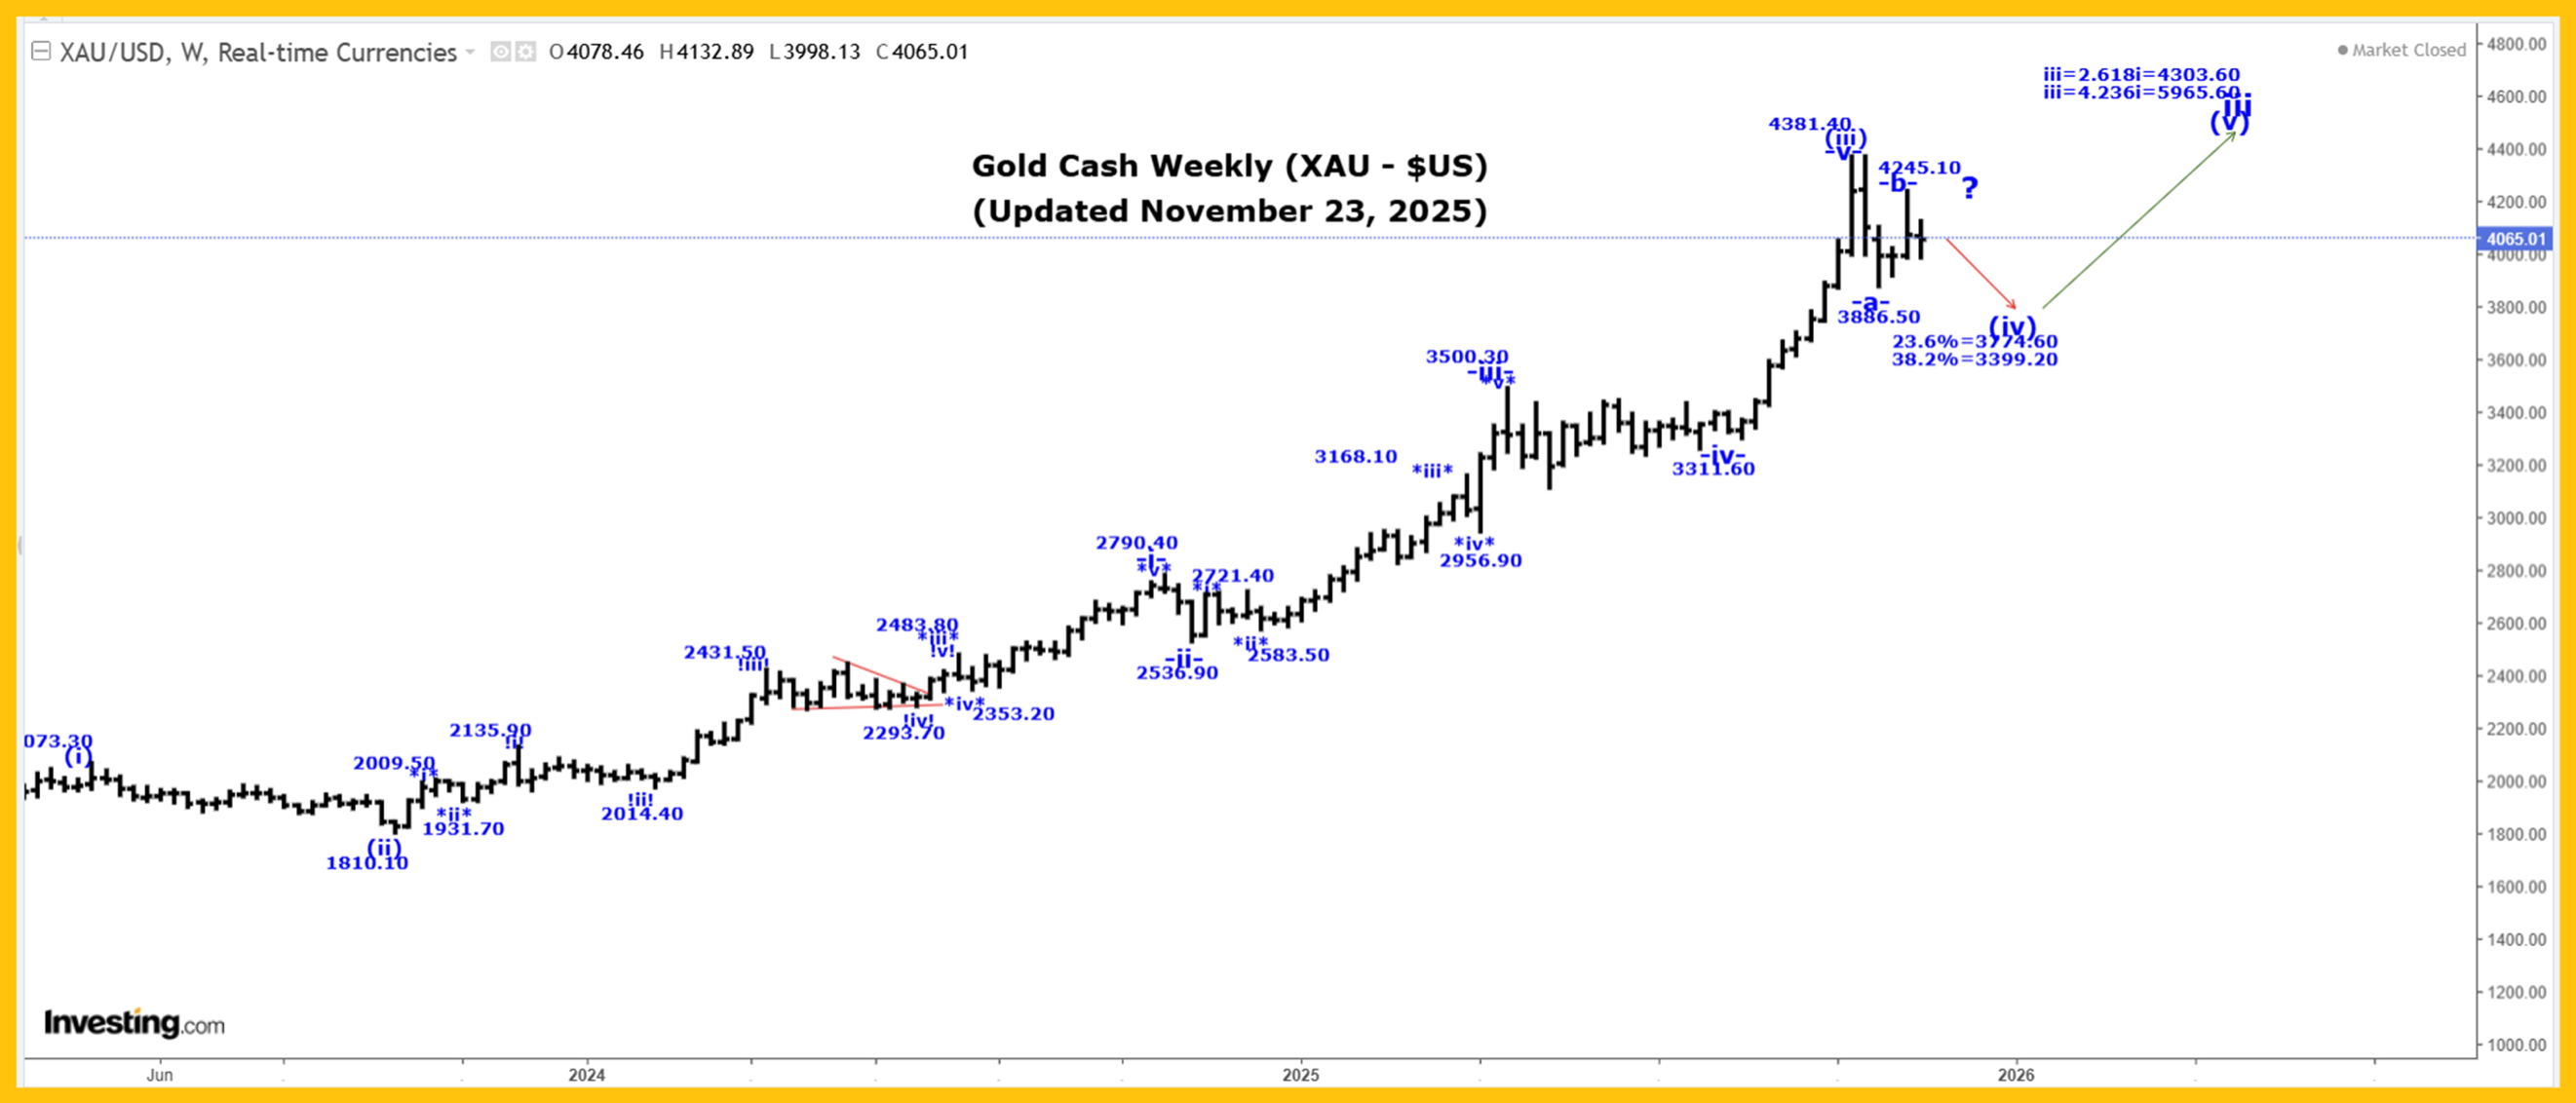
(iii):
-i- = 2790.40.
-ii- = 2539.90.
-iii- = 3500.30.
-iv- = 3280.60.
-v- = 4381.40, to complete all of wave (iii).
We are now falling into a multi-month wave (iv) correction that has the following retracement levels:
23.6% = 3774.60.
38.2% = 3399.20.
Within wave (iv), we completed wave -a- at the 3886.50 low and likely all or most of wave -b- at the 4245.10 high. If that is the case, then we should be falling in wave -c-.
For the time being, we are assuming that wave (iv) is becoming a bullish triangle, and therefore wave -c- cannot fall below the wave -a- low of 3886.05.
The other option is that wave -b- is going to become more complex, and in this case, wave (iv) could still become a flat or irregular type correction, where in the latter formation, gold will make another all-time high in wave -b-, before it falls again into our suggested retracement zone.
A projection for the end of wave iii is:
iii = 4.236i = 5965.60.
Projections for the end of wave 3 are:
3 = 2.618(1) = 5936.00.
3 = 4.236(1) = 9033.60.
Active Positions: Flat!
Thank-you,
Captain Ewave & Crew
About the author