Excerpt from this week's: Technical Scoop: Precious Recovery, Oil Plummet, Gulf Contingency
Gold and silver
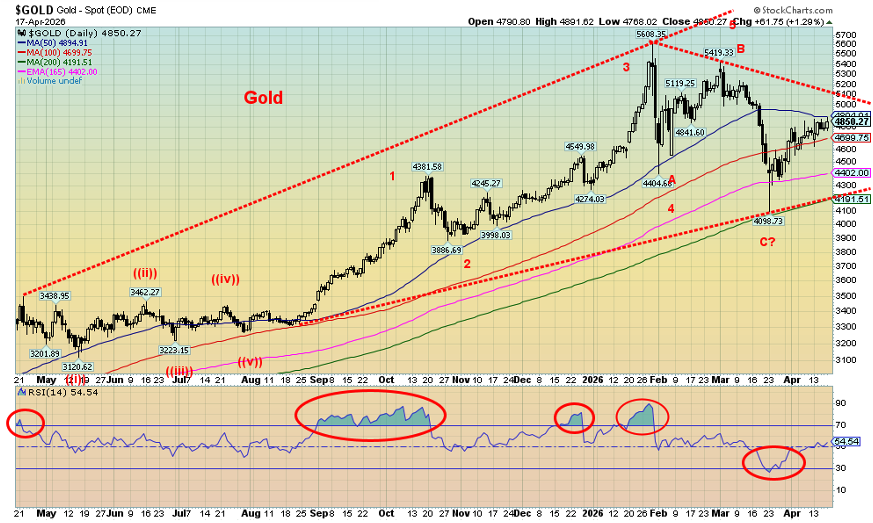
Source: www.stockcharts.com
Gold is still working its way through a prolonged corrective phase. But gold is also being battered back and forth by the news from Gulf. The Strait of Hormuz is open: gold up. The Strait of Hormuz is closed: gold down. After bottoming out in March at $4,098, gold is up 18.3% but remains down 13.5% from the all-time high of $5,608. Silver the same – up 33.2% from the March low but still down 33.3% from the all-time high of $121.64. Is the glass half full, or half empty? Overall, the trend remains up.
Also helping gold was a weaker US$ Index and slightly lower longer-dated bond yields. Then there’s the debt and the increasingly shaky private equity/credit market. Something else that is interesting is the open interest on the COMEX has been falling, even as gold prices have gone up. Usually, they go up in tandem. What this tells us is that gold prices are rising without the usual paper gold that drives speculation and leverage. If that is correct, then once we come out of this corrective period we should rise once again. Physical buying is strong buying. Paper gold buying is normally speculative and for leverage. Volume needs to pick up as well. Right now, the speculators are hesitating, but gold is rising without them.
Another positive thing we see is that the gold/silver ratio has started to fall once again in favour of silver. If we are to go higher, then we need silver to lead. Ditto with the gold stocks where the Gold/HUI ratio is also falling in favour of the gold stocks. These are all positive signs, suggesting to us gold will resume its leadership and bull market once this corrective phase is over.
Comex Gold vs. Open Interest 2015–2026
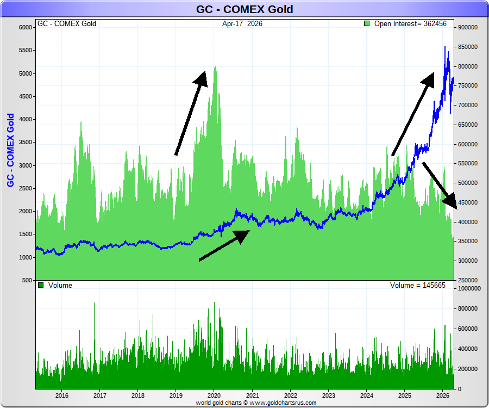
Source: www.goldchartsrus.com
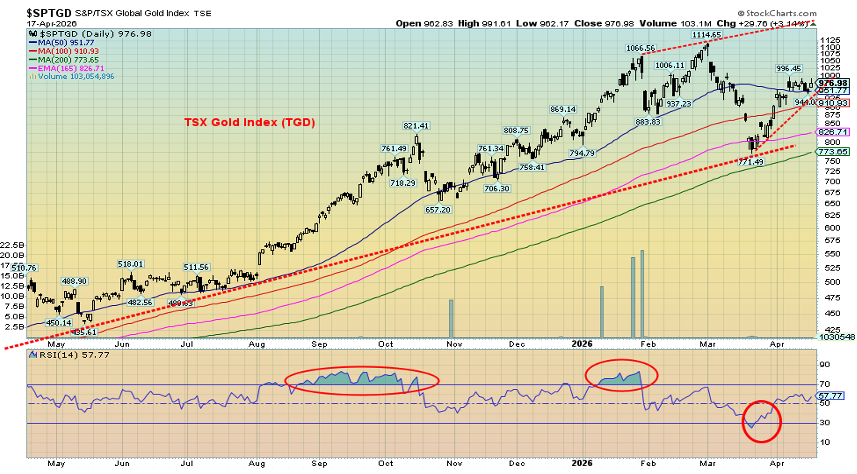
On the week, gold rose 2.1%, silver was up 6.6%, and platinum rose 3.1%. Of the near precious metals, palladium was up 2.4% and copper is once again over $6 up 3.9% on the week. The gold stocks were mixed with the Gold Bugs Index (HUI) up 1.2% and the TSX Gold Index (TGD) down 0.1%. Most of the drop for the
gold stocks was recorded early in the week, and then they struggled back to break-even.
Gold needs to break out over $5,100 to suggest a low is in and over $5,250 to suggest new highs. Silver could be on the cusp of breaking resistance at $62, but we need to get over $107.50 to suggest new highs. The TGD over 1,000 looks better and over $1,050 suggests new highs ahead.
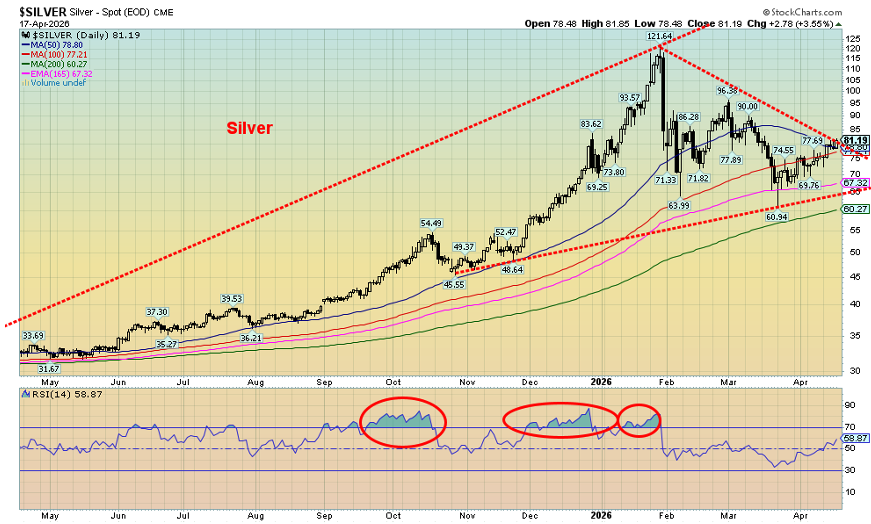
Source: www.stockcharts.com
Gold has endured a sharp correction that sent it into bear market territory. At its low gold was down 27%, silver down 50%, the HUI down 31.7%, and the TGD down 30.8%. Down over 20% is considered a bear market. None of it is unusual as in previous run-ups in 1976–1980 and in 2001–2011 we had numerous corrections, some of which slipped into bear market territory. We remain hopeful our read on the gold market is right and a new strong up wave is to come. Watch the gold/silver ratio. A break under 55 suggests we are on our way to new lows in favour of silver.
Gold/Silver Ratio
Source: www.stockcharts.com
Read the FULL story here:: Technical Scoop: Precious Recovery, Oil Plummet, Gulf Contingency
Disclaimer
David Chapman is not a registered advisory service and is not an exempt market dealer (EMD) nor a licensed financial advisor. He does not and cannot give individualised market advice. David Chapman has worked in the financial industry for over 40 years including large financial corporations, banks, and investment dealers. The information in this newsletter is intended only for informational and educational purposes. It should not be construed as an offer, a solicitation of an offer or sale of any security. Every effort is made to provide accurate and complete information. However, we cannot guarantee that there will be no errors. We make no claims, promises or guarantees about the accuracy, completeness, or adequacy of the contents of this commentary and expressly disclaim liability for errors and omissions in the contents of this commentary. David Chapman will always use his best efforts to ensure the accuracy and timeliness of all information. The reader assumes all risk when trading in securities and David Chapman advises consulting a licensed professional financial advisor or portfolio manager such as Enriched Investing Incorporated before proceeding with any trade or idea presented in this newsletter. David Chapman may own shares in companies mentioned in this newsletter. Before making an investment, prospective investors should review each security’s offering documents which summarize the objectives, fees, expenses and associated risks. Although Artificial Intelligence (AI) may be deployed from time to time, AI output is monitored and adjusted, if necessary, for accuracy. David Chapman shares his ideas and opinions for informational and educational purposes only and expects the reader to perform due diligence before considering a position in any security. That includes consulting with your own licensed professional financial advisor such as Enriched Investing Incorporated. Performance is not guaranteed, values change frequently, and past performance may not be repeated.
About the author


Website: https://www.enrichedinvesting.com
Disclaimer: David Chapman is not a registered advisory service and is not an exempt market dealer (EMD) nor a licensed financial advisor. We do not and cannot give individualised market advice. David Chapman has worked in the financial industry for over 40 years including large financial corporations, banks, and investment dealers. The information in this newsletter is intended only for informational and educational purposes. It should not be considered a solicitation of an offer or sale of any security. The reader assumes all risk when trading in securities and David Chapman advises consulting a licensed professional financial advisor before proceeding with any trade or idea presented in this newsletter. David Chapman may own shares in companies mentioned in this newsletter. We share our ideas and opinions for informational and educational purposes only and expect the reader to perform due diligence before considering a position in any security. That includes consulting with your own licensed professional financial advisor.