
Excerpt from this week's: Technical Scoop: Warsh Era, Precious Struggle, Inflation Tenacity
Gold and silver
Source: www.stockcharts.com
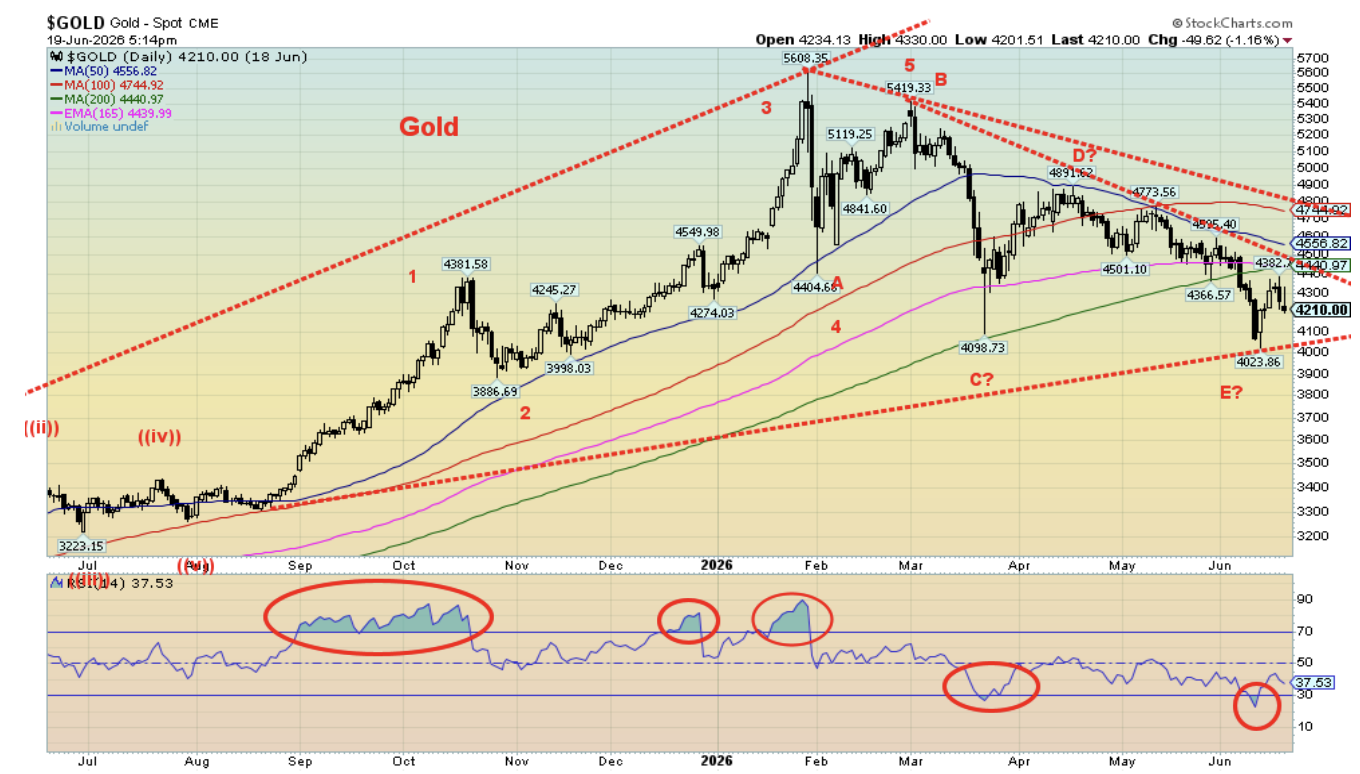
Gold and silver don’t like thoughts of higher inflation and higher interest rates. Gold earns nothing. Bonds at least yield an interest rate and that rate has been rising. New Fed Chair Kevin Warsh and a hawkish June FOMC didn’t help things with a negative outlook for inflation and interest rates. The rising US$ Index doesn’t help gold either. The potential for a more hawkish Fed is not positive for gold.
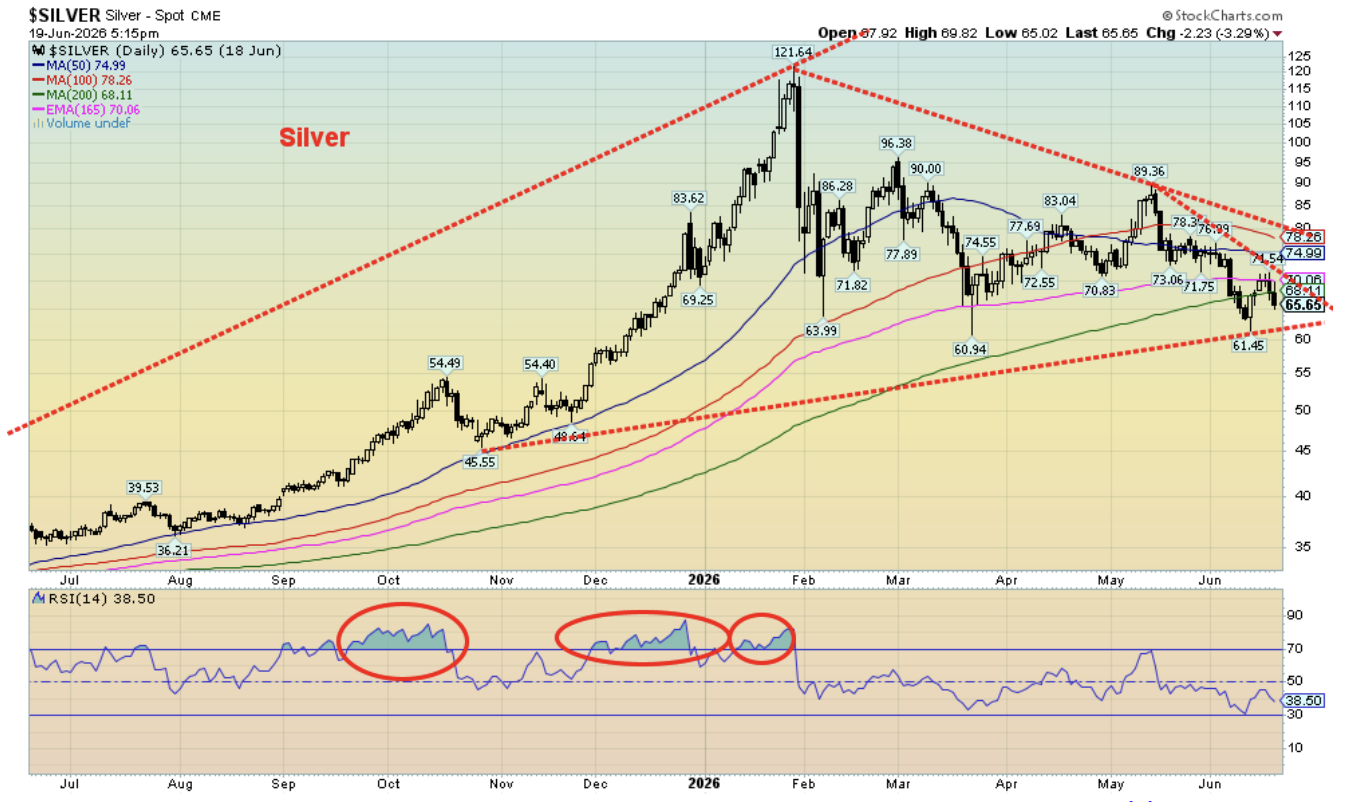
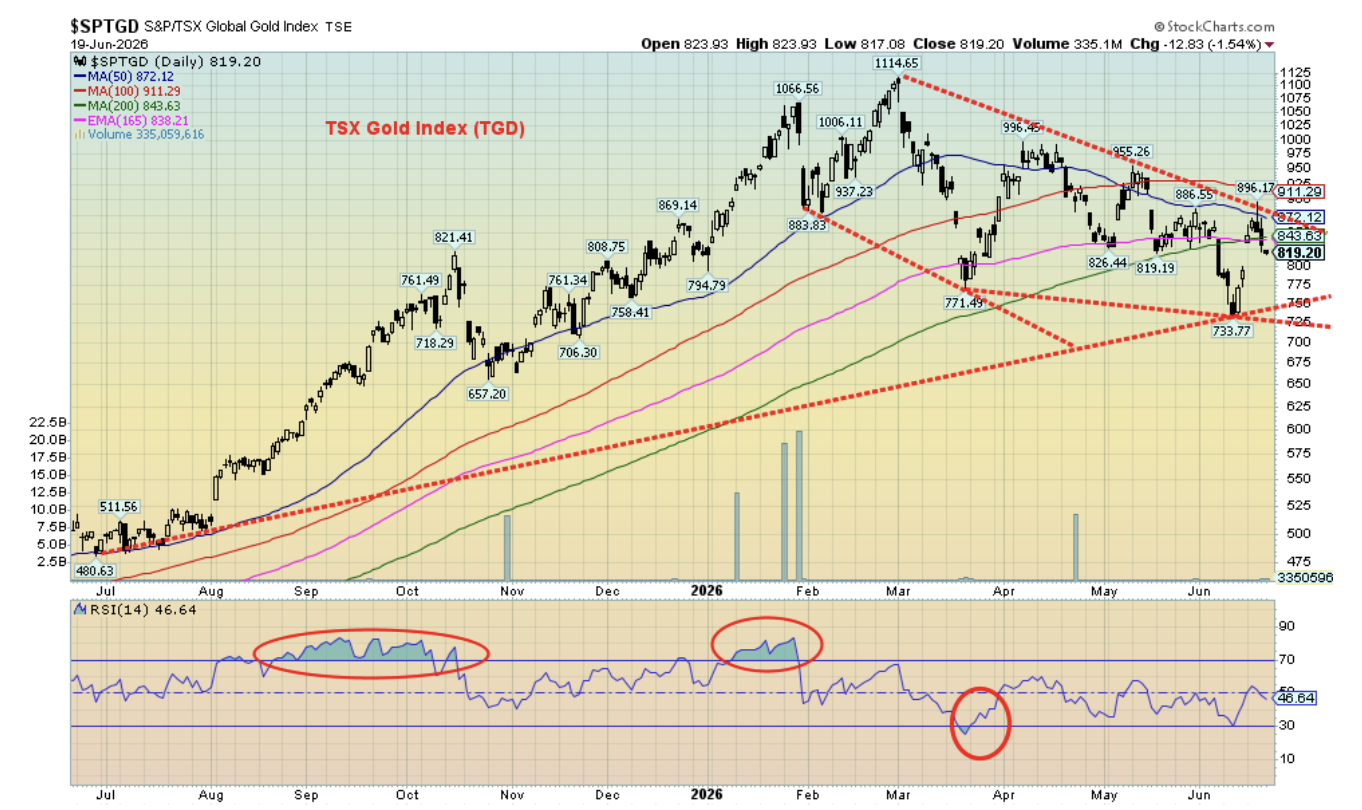
The US$ Index rose 1.0% this past week; however, bond yields fell marginally, thanks to the fall in oil prices. We should note that the Canadian dollar fell 1.1% this past week, hitting fresh 52-week lows. As we noted, the 2-year Treasury note rose, resulting from thoughts of a Fed rate hike later this year. Gold fell for the third straight week, down a tiny 0.1%. Silver was hit harder, off 3.4%. Platinum also fell 0.7%. It continued with the near precious metals as palladium fell 0.4% and even copper was down 1.4% (more on copper to follow). But a funny thing happened on the way to another lousy week for gold and silver: the gold stock indices were up. The Gold Bugs Index (HUI) gained 3.1% while the TSX Gold Index (TGD) was up about 3.0%. We couldn’t help but notice a couple of articles that cited selling AI stocks and buying gold stocks.
By most measures, gold had become oversold while silver touched on being oversold. No, that doesn’t guarantee a rebound but selling when it’s oversold is most likely a losing game. However, since making new
lows for the move hitting $4,024 gold has rebounded, even as it pulled back at the end of the week resulting in a small loss.
Source: www.stockcharts.com
What has been encouraging is that silver, unlike gold, did not make new lows for the down move. Yes, the gold stock indices did but the non-confirmation of silver could signal a potential low for gold. The word then is to accumulate, even as one might not expect instant gratification. Gold still has considerable work to do. Gold needs to break up over $4,400/$4,500 before we can signal that a low might be in. We need to get over $4,800 to confirm a low. For silver, the break point is initially over $70 but over $80 to confirm a low. The gold stock indices follow the same pattern.
The TGD needs to get over 870, then over 955 to confirm a low. For the HUI, the points are 760 and 850. In other words, there is work to be done before we can consider a low is in and a new up-trend may be under way. Gold bugs, we note, tend to get ahead of themselves and take any sign that could signal a low and a new uptrend. The action since the recent $4,024 low is positive, but we can’t declare victory just yet.
The July/September period tends to be seasonally positive for gold. After a lengthy correction it would be welcomed. The period October to December can be negative, but the big gains usually come in the December to February period. Gold bugs can keep their fingers crossed.
Source: www.stockcharts.com
Source: www.stockcharts.com
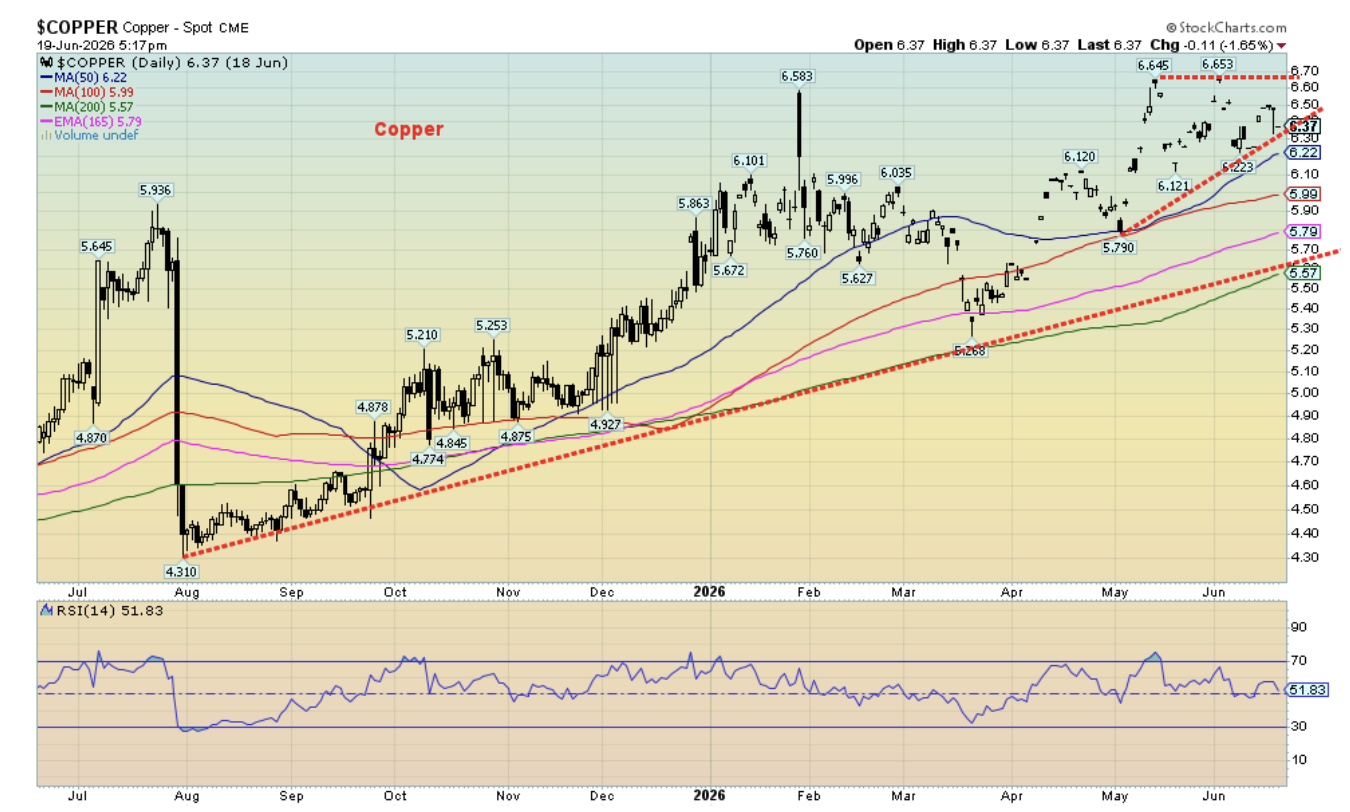
Copper has been a leader in 2026. Unlike struggling gold and silver, copper prices are up 12.9% so far in 2026. Copper demand is soaring because of AI, EV, and other demands. There are also shortages. Adding to the demand is defense procurement. The question we ask is, why isn’t it even higher? That gold and silver have struggled also leads to copper struggling. But copper is clearly leading the way and eventually that’s positive for gold and silver as they will follow. Copper rising is risk-on for industrial growth whereas gold rising is risk-off for safe-haven demand.
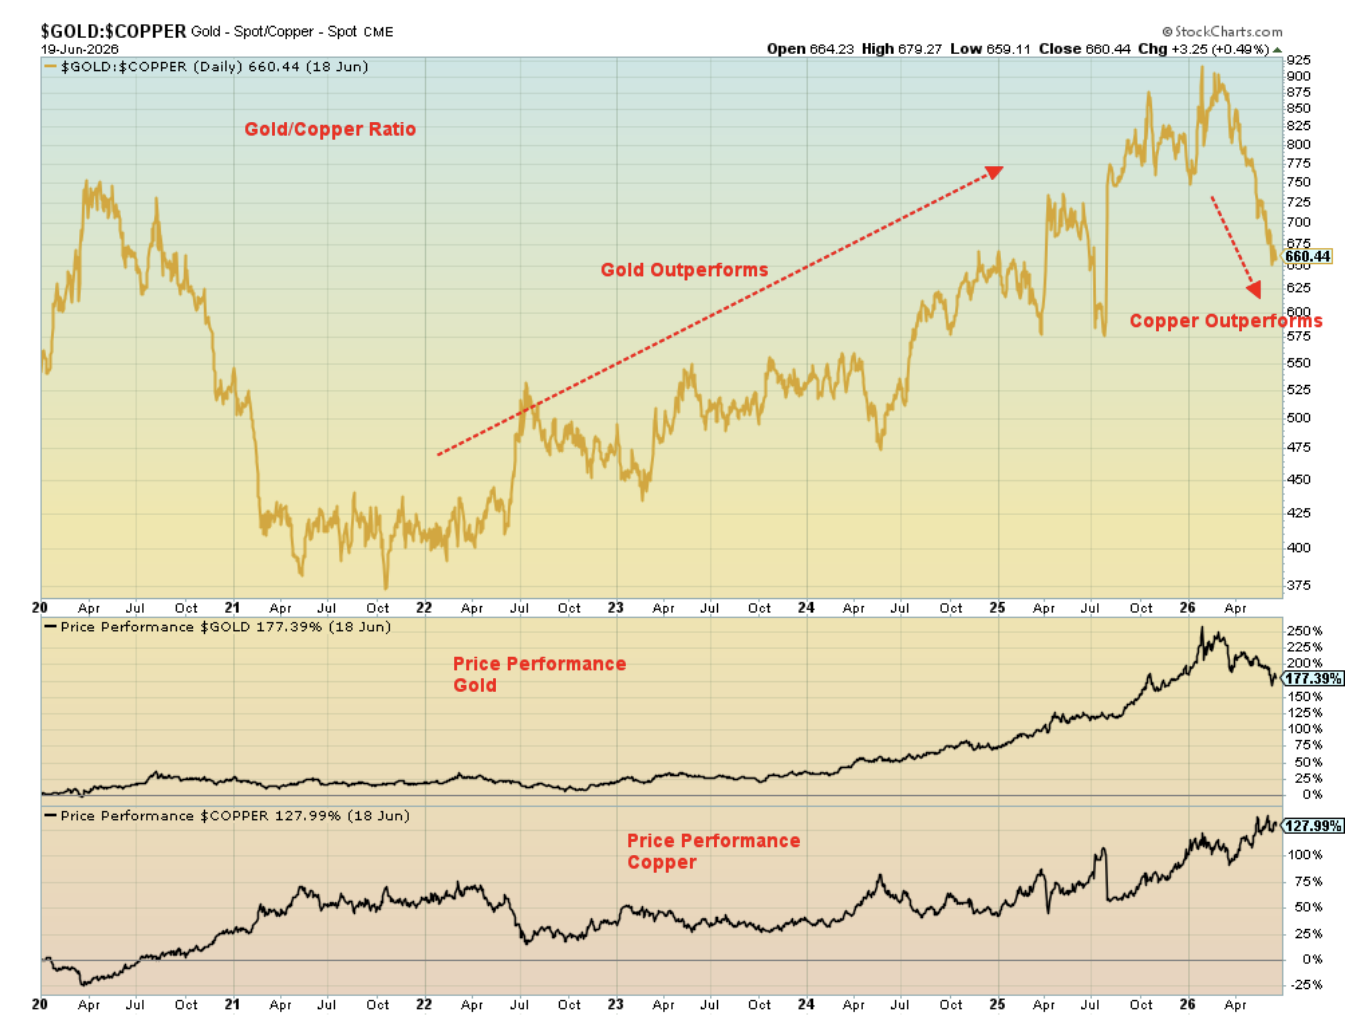
Since 2020, copper is up 128% while gold is up 177% despite the recent pullback. Gold led the way from 2020 to recently as safe-haven demand grew and central banks were stockpiling. However, that has shifted in 2026 as copper shortages and rising demand have outstripped gold, which is going through a significant correction.
The two generally go in lock step with each other, but there can be periods where one is outperforming the other. Note how things went in 2021–2022 when copper demand began to soar, but gold was falling thanks to rising inflation and interest rates. Currently, copper has the edge, but we don’t expect that to last forever.
Copper is currently forming a triangle pattern that should break to the upside. Targets could then become at least $7.50 once firmly through $6.65. A break under $6.20 would be negative and under $5.80 we question the copper rally.
Gold/Copper Ratio and Performance 2020–2026
Source: www.stockcharts.com
Read the FULL report here: Technical Scoop: Warsh Era, Precious Struggle, Inflation Tenacity
Copyright David Chapman 2026
Disclaimer David Chapman is not a registered advisory service and is not an exempt market dealer (EMD) nor a licensed financial advisor. He does not and cannot give individualised market advice. David Chapman has worked in the financial industry for over 40 years including large financial corporations, banks, and investment dealers. The information in this newsletter is intended only for informational and educational purposes. It should not be construed as an offer, a solicitation of an offer or sale of any security. Every effort is made to provide accurate and complete information. However, we cannot guarantee that there will be no errors. We make no claims, promises or guarantees about the accuracy, completeness, or adequacy of the contents of this commentary and expressly disclaim liability for errors and omissions in the contents of this commentary. David Chapman will always use his best efforts to ensure the accuracy and timeliness of all information. The reader assumes all risk when trading in securities and David Chapman advises consulting a licensed professional financial advisor or portfolio manager such as Enriched Investing Incorporated before proceeding with any trade or idea presented in this newsletter. David Chapman may own shares in companies mentioned in this newsletter. Before making an investment, prospective investors should review each security’s offering documents which summarize the objectives, fees, expenses and associated risks. Although Artificial Intelligence (AI) may be deployed from time to time, AI output is monitored and adjusted, if necessary, for accuracy. David Chapman shares his ideas and opinions for informational and educational purposes only and expects the reader to perform due diligence before considering a position in any security. That includes consulting with your own licensed professional financial advisor such as Enriched Investing Incorporated. Performance is not guaranteed, values change frequently, and past performance may not be repeated.
About the author


Website: https://www.enrichedinvesting.com
Disclaimer: David Chapman is not a registered advisory service and is not an exempt market dealer (EMD) nor a licensed financial advisor. We do not and cannot give individualised market advice. David Chapman has worked in the financial industry for over 40 years including large financial corporations, banks, and investment dealers. The information in this newsletter is intended only for informational and educational purposes. It should not be considered a solicitation of an offer or sale of any security. The reader assumes all risk when trading in securities and David Chapman advises consulting a licensed professional financial advisor before proceeding with any trade or idea presented in this newsletter. David Chapman may own shares in companies mentioned in this newsletter. We share our ideas and opinions for informational and educational purposes only and expect the reader to perform due diligence before considering a position in any security. That includes consulting with your own licensed professional financial advisor.