When the next financial crash occurs, investors need to understand which of the top four precious metals are the best to invest in. Unfortunately, there has been a great deal of faulty analysis that has mislead many investors about the fundamentals of gold, platinum, palladium and silver.
I will provide information in this article on the top four precious metals that has not been covered correctly by the majority of analysts. While some may have touched on individual aspects, very few have put together an in-depth analysis on these metals to properly educate investors.
However, before I get into the details of these top four precious metals, I would like to share some very important information.
When I wrote my article (few weeks ago) titled, THE COMING BREAKDOWN OF U.S. & GLOBAL MARKETS EXPLAINED: What Most Analysts Missed, it generated the most interest and commentary of any of my previous articles. It seemed to have hit a nerve in my followers and new readers.
In that article, I posted some of the charts by Louis Arnoux and the Hills Group. These charts explained the coming “Thermodynamic Collapse” of the oil price and global oil industry… in a relatively short period of time. Since then, I have had several long conversations with Louis on the science and math of their work.
Let me tell you all, any doubts I have had about the accuracy and legitimacy of their work… IS COMPLETELY GONE.
Folks… we are in a real mess. And the damned thing of it all, the world has no clue. While I have been pessimistic about the ramifications of peak oil and the Falling EROI – Energy Returned On Investment for many years, now I understand there is a TIME CLOCK. And, we don’t have much time.
I have mentioned in a few interviews and articles that I was planning to have these gentlemen on for an interview to explain their work on the “Thermodynamic Oil Collapse.” I’d planned to have them on already, but it took more time to understand the science behind their work. Basically, it took more time for me to wrap my mind around the ramifications of this work.
Furthermore, it is extremely important to present this information in a way in which individuals can “GET IT’ or “CONNECT THE DOTS.” Because, once an individual understands this information, it’s like taking the ULTIMATE RED PILL. Once you comprehend it, you can’t go back. Thus, it will force you to look at the world in a completely different way.
I will be wrapping up the discussion between Louis and the Hills Group, and we will have them on in the next few weeks to discuss their work. Moreover, I have decided that we will likely do several interviews to get the point across as well as discuss the dire ramifications.
Lastly, my article THE DEATH OF THE BAKKEN OIL FIELD HAS BEGUN: Means Big Trouble For The U.S., went viral on many sites a week ago. It received nearly 100,000 views on Zerohedge. However, a really bizarre event took place on the peakoil.com website. When it was posted on the peakoil.com site, it received the most comments ever (from what the members stated). Normally, there are only about 35 diehard members that leave comments. Most articles only received between 10-30 comments.
However, my DEATH OF THE BAKKEN article received nearly 300 comments on the peakoil.com site, and the majority of them came from 100+ new members that day. What was really bizarre, was that the comments from these new members were all negative and may have been generated by what is called, a TROLL BOT ATTACK . This is what some of the members of the site were discussing.
The peakoil.com site has been discussing peak oil for years, so the information in my article wasn’t anything new. Although, the way it was presented or the title must have hit a nerve to generate such a large barrage of negative comments. So, it seems as if the global oil industry is in a much bigger trouble than I realized.
Please stay tuned for our upcoming interview on the Thermodynamic Collapse of Oil. It will be the most important information for individuals and investors to understand.
The Important Fundamentals Of the Top Four Precious Metals
Mine Production:
As I mentioned in the beginning of the article, there is a lot of incorrect analysis on the top four precious metals that has confused investors to no end. I will try to clear this up.
Let’s look at the annual mine production of silver, gold, palladium and platinum. According to the Gold, Silver & Platinum Group Surveys provided by GFMS (Thomson Reuters), the world produced 877 million oz (Moz) of silver, 101 Moz of gold, 6.7 Moz of palladium and 6.1 Moz of platinum in 2015:
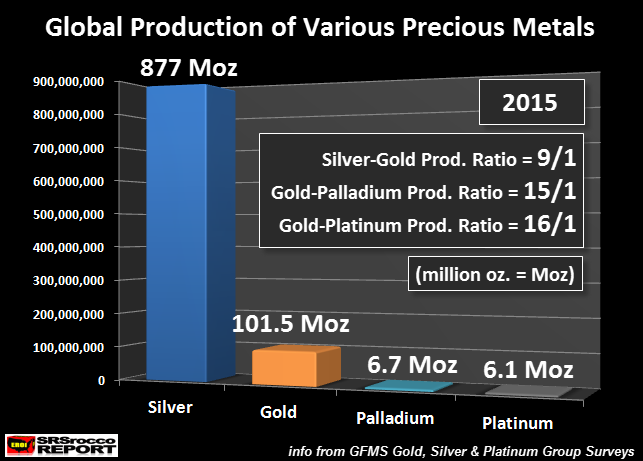
As we can see, there are 9 times more silver produced than gold, 15 times more gold than palladium and 16 times more gold than platinum. Many analysts have erroneously stated that due to the rarity of platinum or palladium, its value should be much higher than gold. Furthermore, other analysts believe the value of silver should be much higher than its current 69/1 price ratio to gold, due to there being only nine times more silver produced than gold.
The silver to gold production ratio may have been more a representation of the market value of these two precious metals hundreds of years ago or in ancient times, due to the way it was extracted from the earth (by human and animal labor). However, this has changed since the late 1800’s, as the energy sources of coal and oil replaced human and animal labor.
Gold, Platinum & Silver Estimated Production Cost:
The current values of the top four precious metals are based on their cost of production, not their production ratio. The chart below shows the estimated cost of production of gold, platinum and silver. I omitted palladium in my cost analysis below, because the largest producers of the metal are a by-product of nickel and platinum production. Regardless, I would imagine the few primary palladium producers probably produce palladium at the similar cost margins as gold, platinum and silver shown below:
My estimated breakeven for gold was based on using the mining companies of Barrick and Newmont. For platinum, it was Anglo American Platinum and Impala Platinum, and for silver,it was Pan American Silver and Tahoe Resources. These where the two largest primary metal producing companies for each metal.
NOTE: This was not my normal in-depth approach using many different formulas, but rather more of a simple cost approach using the mining companies net or adjusted income divided by total primary metal production. While the calculations could be more accurate, the figures above represent a pretty good estimated breakeven for these precious metals.
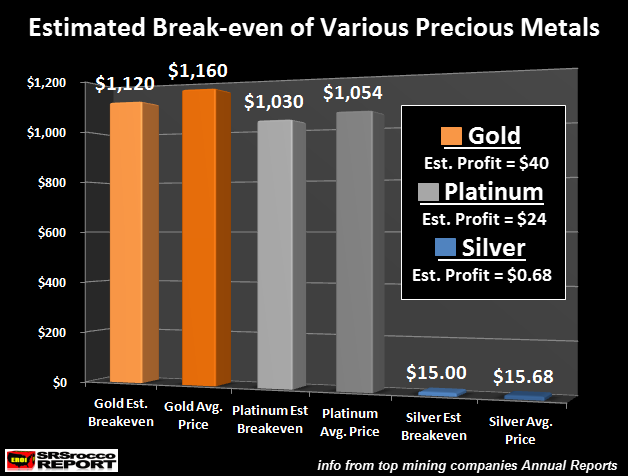
If we look at the chart above, we can see that the estimated break even for gold (Barrick & Newmont) in 2015 was $1,120 an ounce. The average price of gold in 2015 was $1,160. Thus, these top two gold mining companies made a $40 per ounce profit.
For platinum, the estimated breakeven was $1,130 in 2015, while the average price was $1,054. So, these top two platinum miners made a profit of $24 per oz. I believe this estimated platinum breakeven is a good estimate for the platinum industry as these two top companies produced 2.9 Moz of the total 6.1 Moz of platinum in 2015.
Now for silver. The top two primary silver mining companies estimated breakeven for 2015 was $15.00, while the average spot price was $15.68. Which means, these two primary silver miners made a profit of $0.68 an ounce. Actually, Tahoe Resources reported a very large profit, while Pan American Silver stated a loss in 2015. However, if we average these two companies, we come up with a $0.68 profit.
Basically, the profit margins of these three metals, based on my estimated breakeven, were 2.2% for platinum, 3.4% for gold and 4.5% for silver. These are very thin margins. These production cost profiles of these metals are what I believe the traders and or algorithms use to value gold, platinum and silver. I would imagine the same would be true for palladium, even though I did not construct a breakeven analysis.
So, the value of these metals are not based on their production ratio, but rather their cost of production. Which means, any precious metal analyst who says, “gold is the key monetary store of value metal”, doesn’t understand that it is currently being valued as a MERE COMMODITY, just like platinum, palladium and silver.
However, my analysis suggests the current gold and silver “commodity priced mechanism” will change to a high quality store of value when the worst financial crash in history takes place in the near future.
The Top 4 Precious Metals Investment:
While most precious metals websites focus on promoting gold and silver investment, several are touting the benefit of owning platinum and palladium. Unfortunately, the majority of the reasons stated to own platinum or palladium may turn out to be incorrect or untrue in the future. That being said, let’s take a look at the percentage of physical retail investment versus total demand for each metal in 2015:
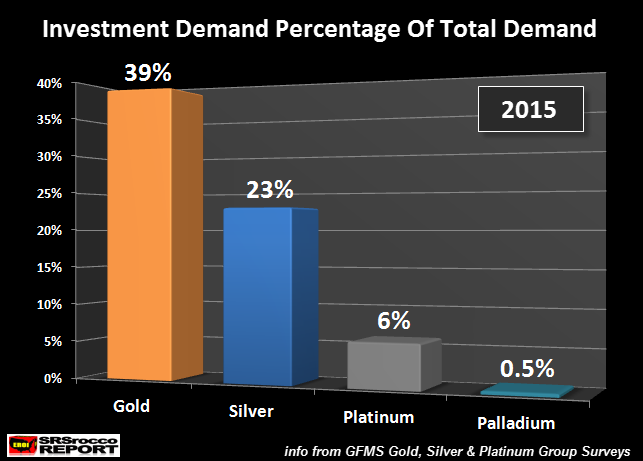
Gold was the clear winner as 39% of total demand was in physical retail and Central Bank investment. Gold was the only metal in which I included net Central Bank purchases. I excluded all investments (flows in or out) of ETF’s in each metal. Basically, the figures above represent physical retail investment (including Central Bank for gold).
Silver came in second as 23% of total demand was in bar and coin investment. As we can see, platinum investment was 6% of total demand, while palladium investment was only 0.5% (half percent) of total demand. All figures came from GFMS Gold, Silver & Platinum Metals Group Surveys.
I decided to take a longer view of physical investment of these metals, so the chart below shows the average over a five-year period (2011-2015):
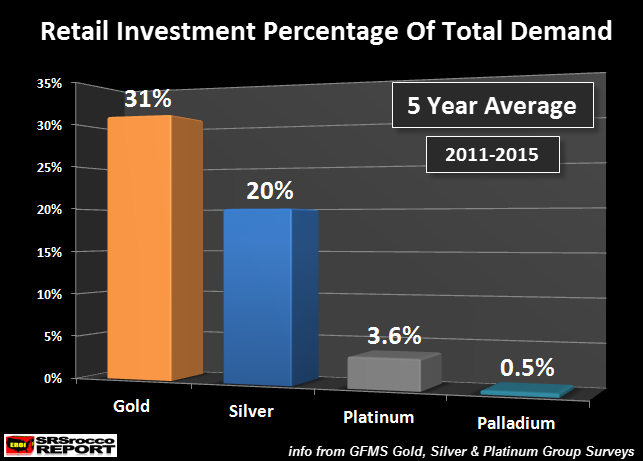
We can clearly see, gold and silver retail physical investment represent the highest percentages of total demand in the group. For whatever reason, investors innately understand the 2,000+ year history of gold and silver as money or a high quality store of value.
Even though gold enjoys a much higher investment percentage (31%) of total demand in the five-year period, silver is the clear winner when it comes to total amount of metal (in ounces) invested by the public:
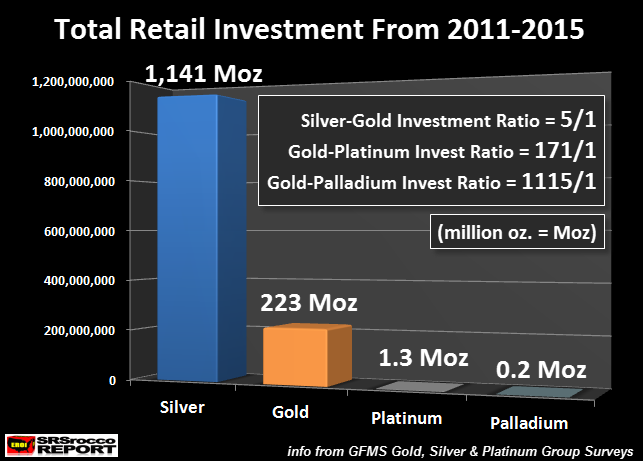
Investors purchased a total of 1,141 Moz (1.14 billion oz) of silver 2011-2015, while gold investment was 223 Moz, platinum was 1.3 Moz and palladium at a distant fourth at 0.2 Moz.
These figures reveal a very significant “mindset” or “psychology” of investor preference. Of course, the total Dollar amount of gold investment of the 223 Moz is much higher than the 1,114 Moz of silver, but the volume of metal purchased, proves that investors have a real affinity for silver.
Why Gold & Silver, Not Platinum & Palladium Will Be The Key Precious Metals To Own During The Next Financial Crash
Looking at these figures, I would suggest that gold and silver will be the go to assets during the next financial crisis, not platinum and palladium. While platinum and palladium could provide the investor with some relative store of value properties in the future, the upcoming Thermodynamic Oil Collapse will destroy the market’s ability to produce or consume platinum and palladium at anywhere near the current volumes.
Unfortunately, most of the public has no clue about investing in platinum or palladium or realizing these metals as a store of value. Most of the investment into these (true) industrial metals are a hedge or bet on future supply shortages or price spikes. Rather, gold and silver are known more to the public as money and true stores of value.
While silver is PIGEON-HOLED by the Mainstream media and by many of the precious metals analysts to be more of an industrial metal, it is still an excellent store of value as gold. The only difference is its cost of production. However, the cost of production will become less of a driver for the value of gold and silver in the future as the $250 trillion in Global Bonds, Stocks, Real Estate and Insurance Funds evaporate in the future.
Again, this will be due to the coming Energy Pearl Harbor, shown in one of Louis Arnoux’s charts below:
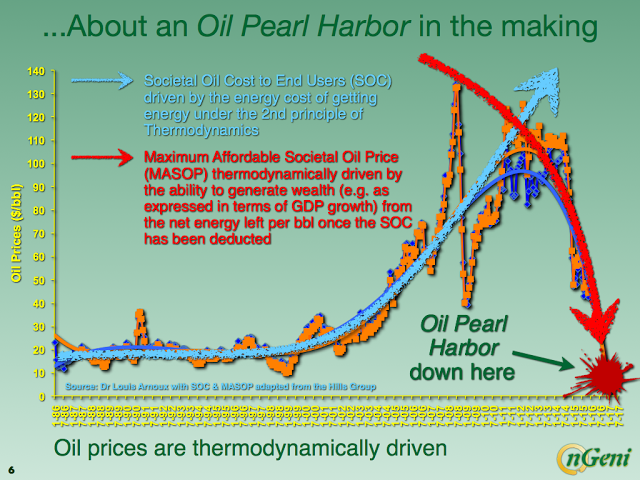
Unfortunately, very few people understand the energy cliff that is heading our way. Instead, they cling to a notion that while a financial crash will be difficult, once the dust settles, we will begin growing and expanding our economy based on real money. Folks, growth as we know it, will be over for good.
This is why it is important to understand the ramifications of this energy cliff. Investors who understand the implications of this energy cliff will consider moving out of most stocks, bonds and real estate and into physical gold and silver.
Check back for new articles and updates at the SRSrocco Report.
About the author


Independent researcher Steve St. Angelo (SRSrocco) started to invest in precious metals in 2002. Later on in 2008, he began researching areas of the gold and silver market that, curiously, the majority of the precious metal analyst community have left unexplored. These areas include how energy and the falling EROI – Energy Returned On Invested – stand to impact the mining industry, precious metals, paper assets, and the overall economy.
Steve considers studying the impacts of EROI one of the most important aspects of his energy research. For the past several years, he has written scholarly articles in some of the top precious metals and financial websites.
You can find many of Steve’s articles on noteworthy sites, such as GoldSeek-SilverSeek.com
WEBSITE: https://srsroccoreport.com/