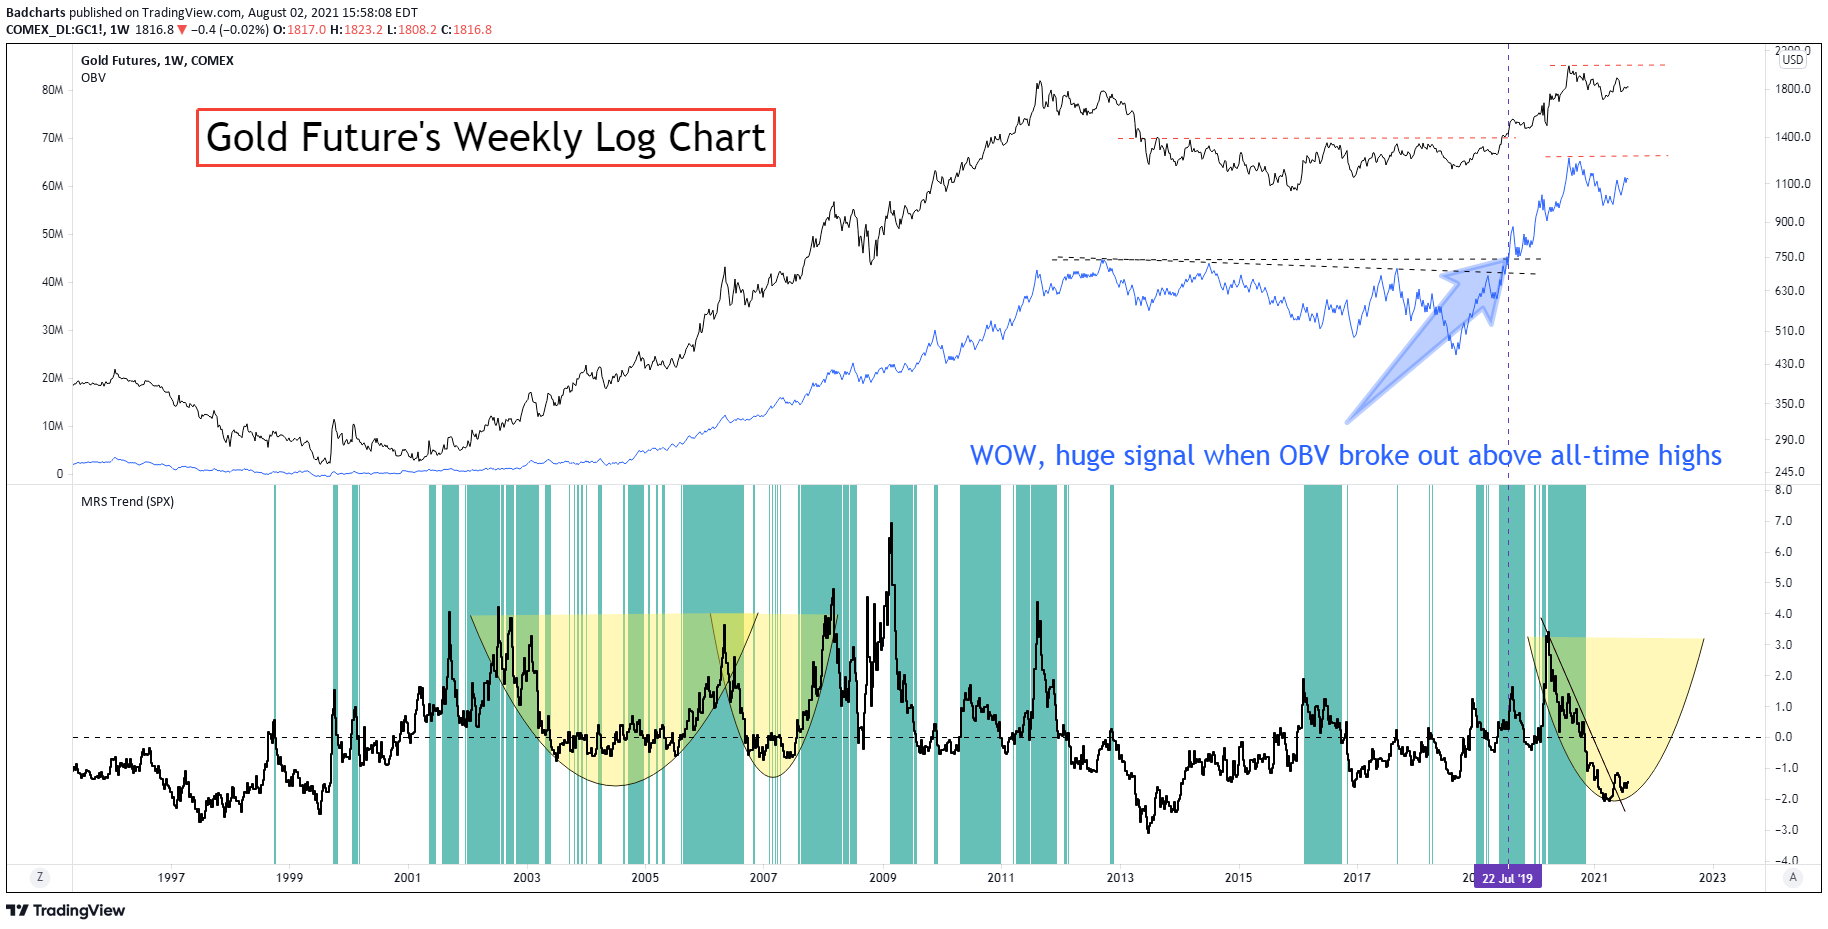
Let’s start with gold’s OBV (on balance volume).
(For those curious how the OBV is calculated.. see this https://www.investopedia.com/terms/o/onbalancevolume.asp)
The key takeaway is how gold behaved once it cleared it’s OBV all-time highs. This can yield clues on what to expect from silver.
Notice also gold is severely under performing $spx as seen on the lower MRS (Mansfield Relative Strength Indicator). Looking for a turn around on that possible arc.

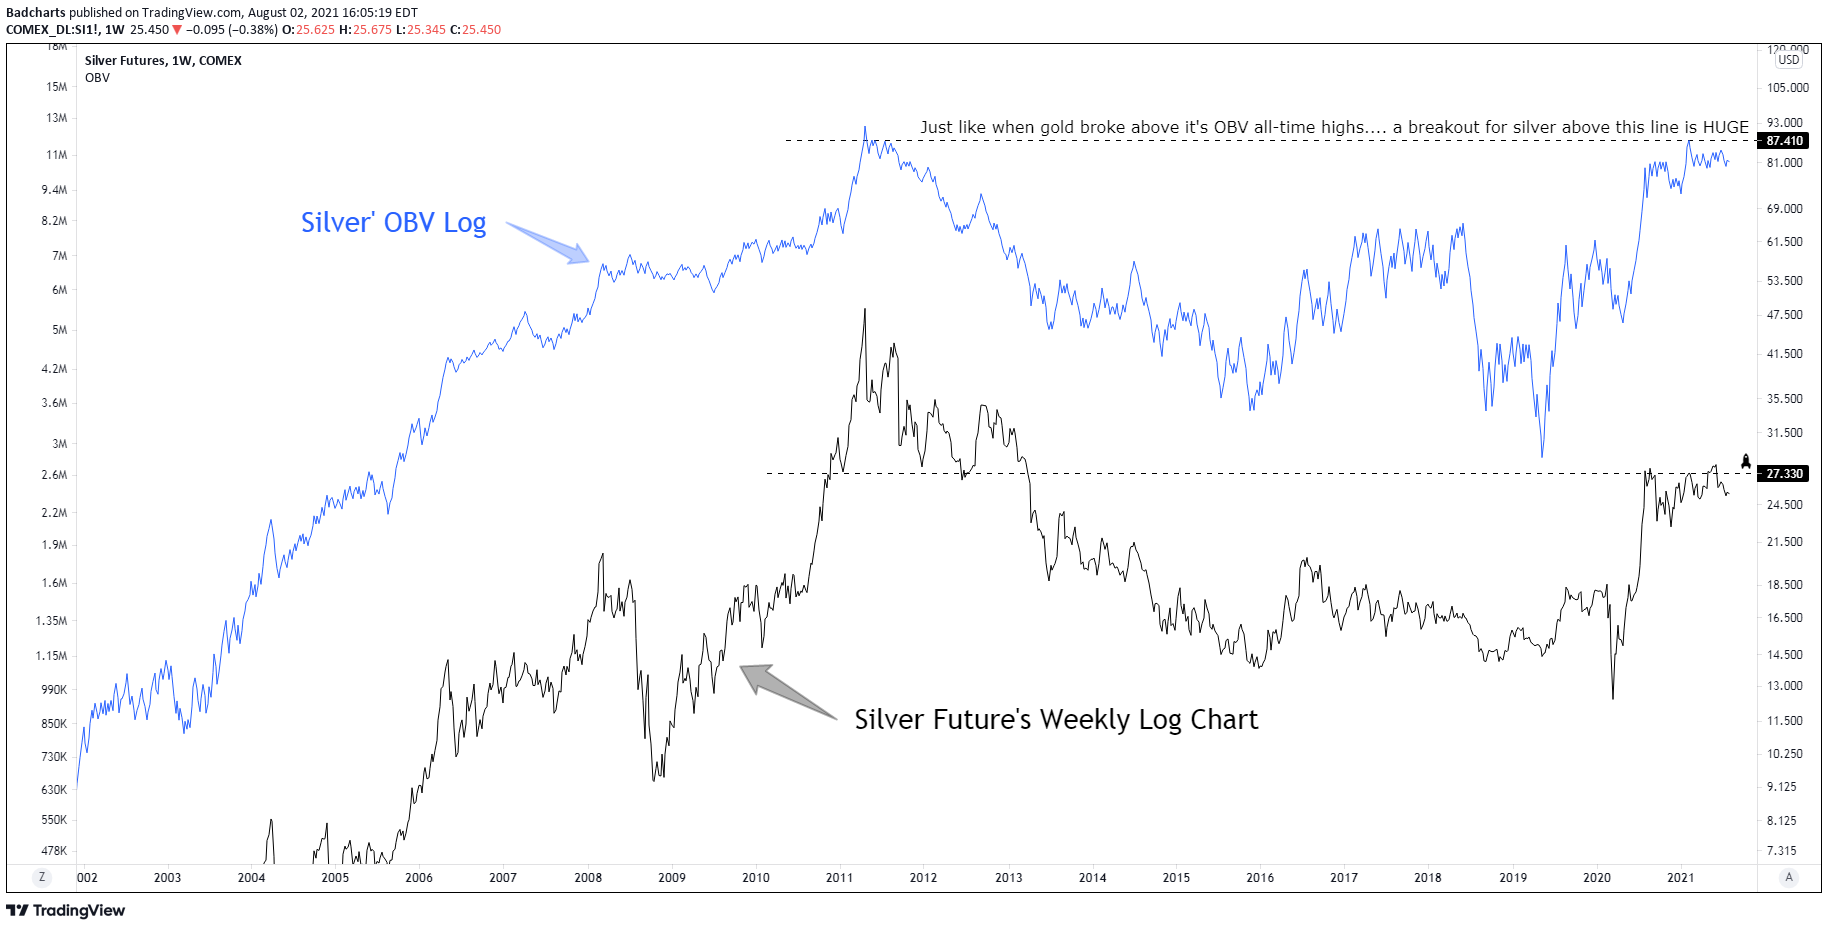
Okay, now for silver. I simply over layed the OBV with silver itself. Check out how it also is about to have all-time highs in OBV… Oh man. This lead gold to all-time highs in price. Expecting the same for silver.

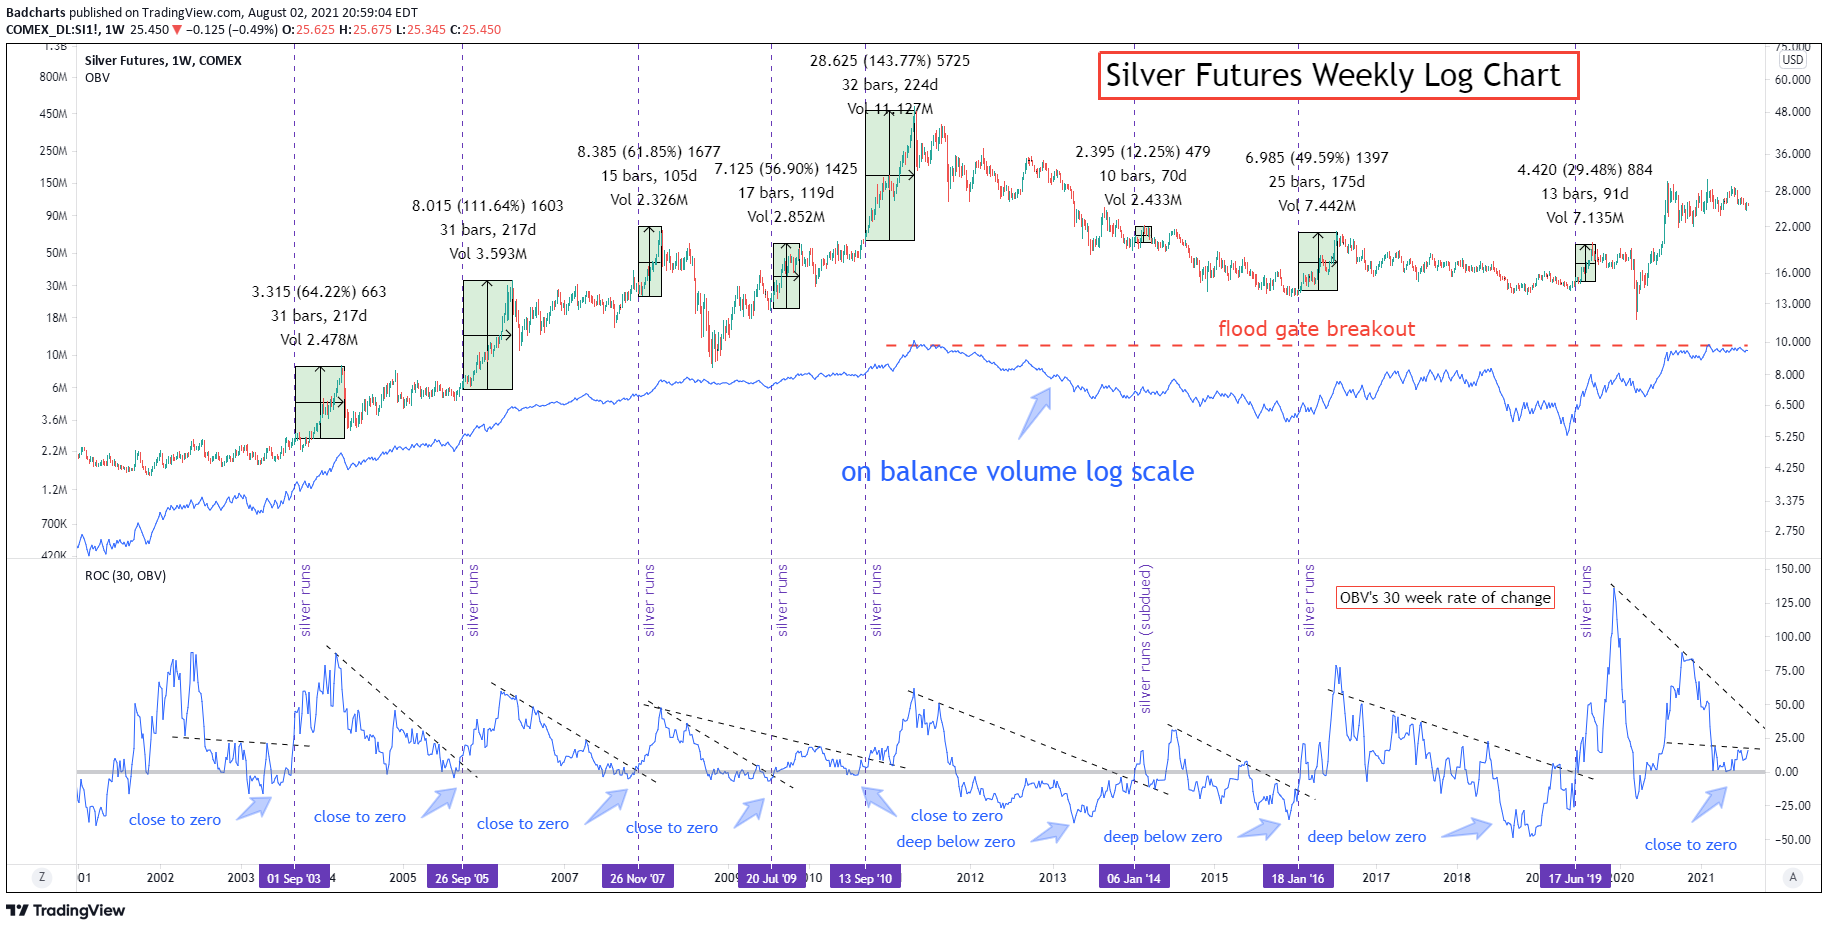
Now, let’s see if momentum can give us any clues. Are they extended, over excited and in fomo? or in a calm coiled state, before the next explosive move?
See the bottom indicator for that answer. It’s the 30 week period rate of change for OBV. Looks pretty calm to me, and turning upwards!

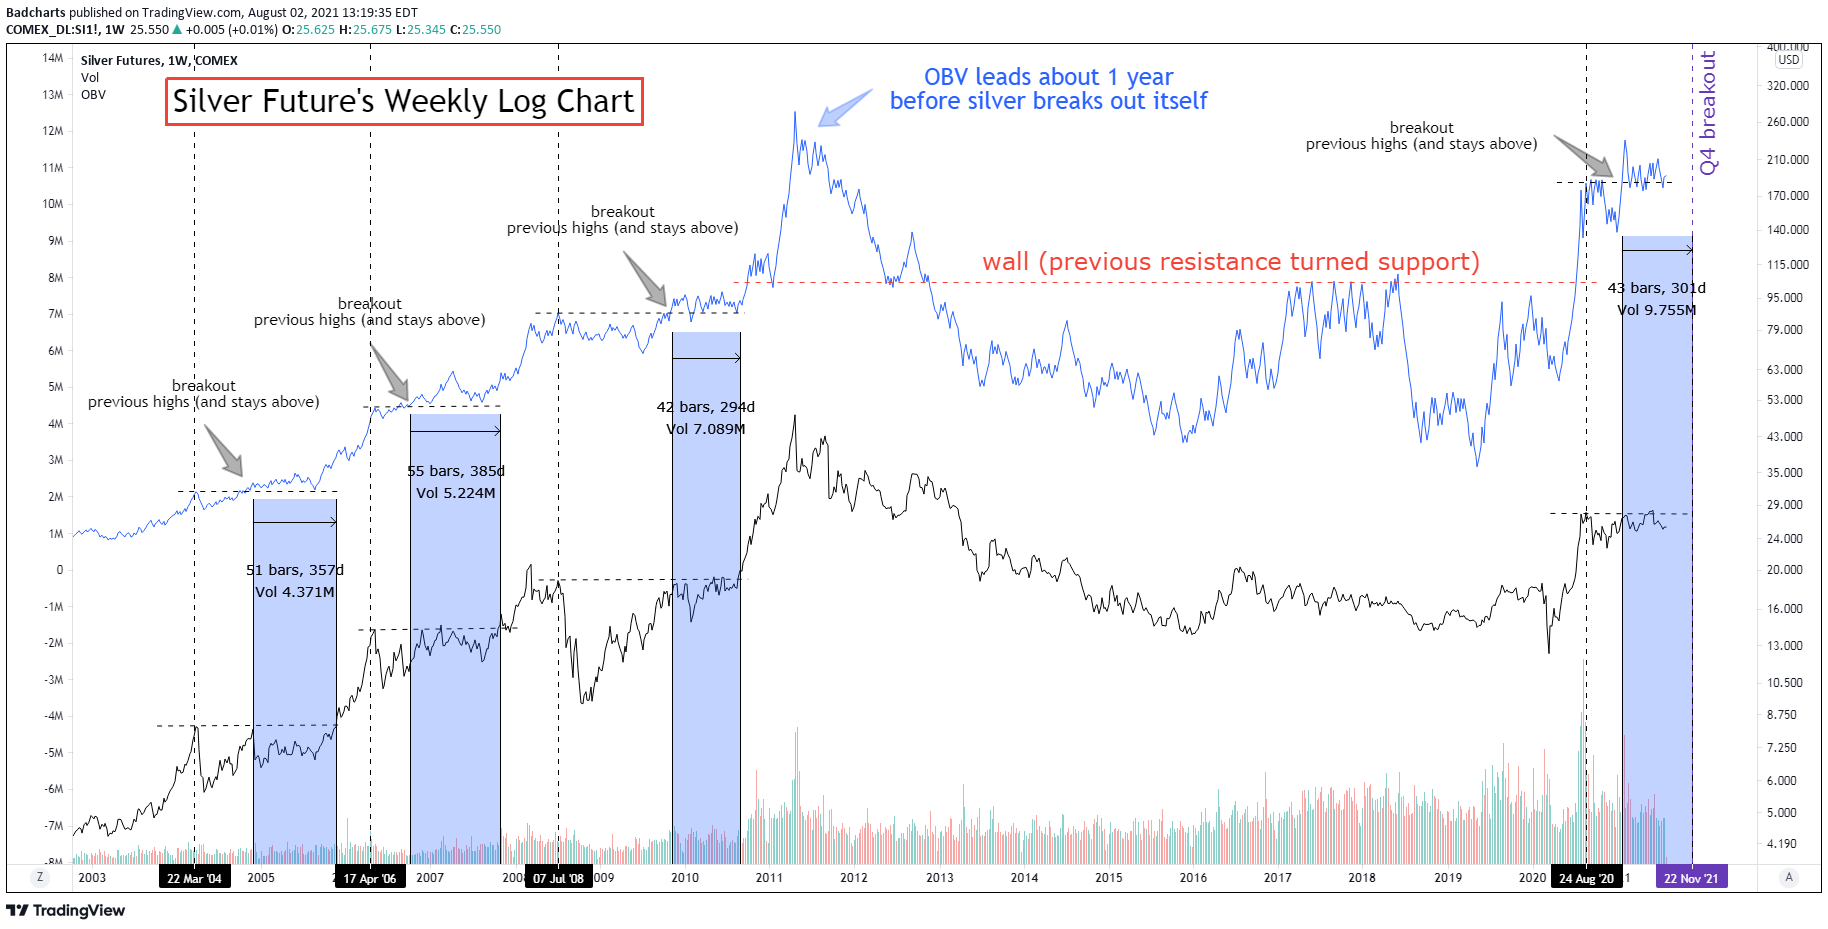
Final chart for silver. How much time before this breaks out?
For the past 3 times OBV broke out above previous highs (sync’d at silver rally highs).. and stayed above that high, it was a matter of time for silver to explode. About 1 year. Q4 looks like a reasonable target for that move.

My Twitter https://twitter.com/badcharts1
All these INSANE charts at https://www.northstarbadcharts.com/
And our YouTube will cool guests https://www.youtube.com/northstarbadcharts

