The USD/ZAR chart has been a good predictor for silver rallies. Similar to the US Dollar index, but a bit more accurate or precise. Very important silver bottoms tend to coincide with tops of the USD/ZAR chart.
Below, is a chart of silver as compared with the USD/ZAR chart, to demonstrates this fact:
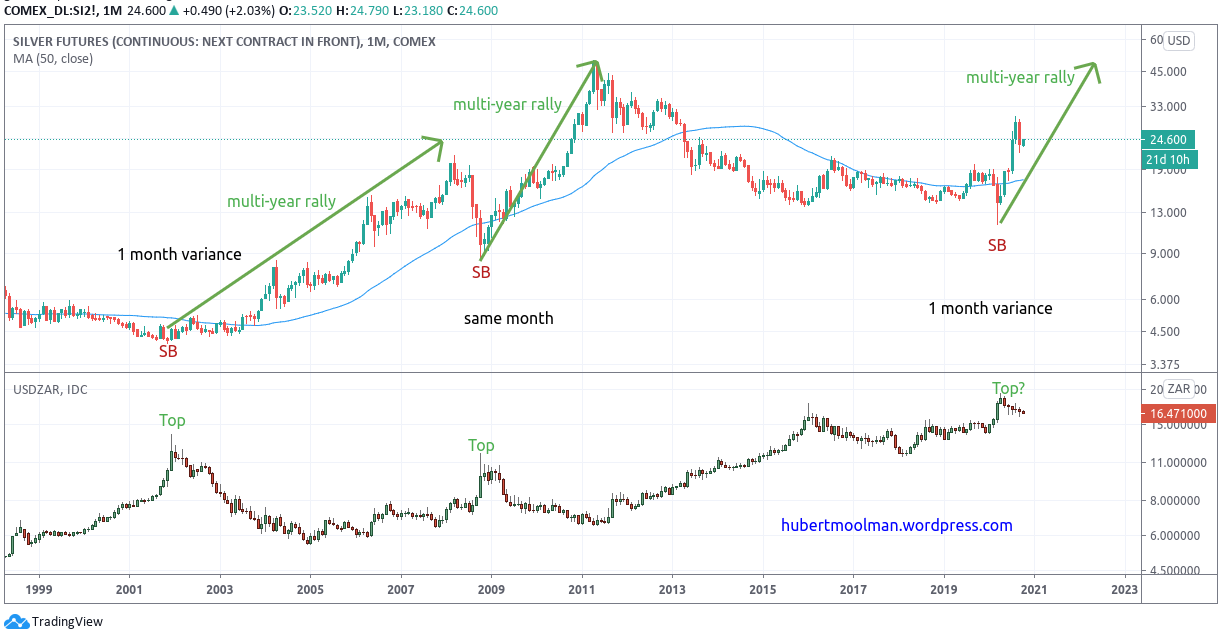
The 2001 silver bottom(SB) occurred one month before the key 2001 USD/ZAR bottom. This was followed by a multi-rear silver rally.
The 2008 silver bottom occurred in the same month (October) as the 2008 USD/ZAR top. Again, it was followed by a multi-year rally.
The 2020 silver bottom occurred one month before the April 2020 USD/ZAR top (a similar setup to 2001). Since then, we have had a multi-month silver rally which is very likely just the beginning of a multi-year rally.
October into November tend to also be a key month for this relationship, as it was the case in 2002 and 2008. It is often the turnaround time or the period where silver really starts accelerating.
The USD/ZAR ratio is actually looking tired from a long-term and short-term view, and this is consistent with the outlook for the US Dollar index.
We have to keep our eyes on this ratio:
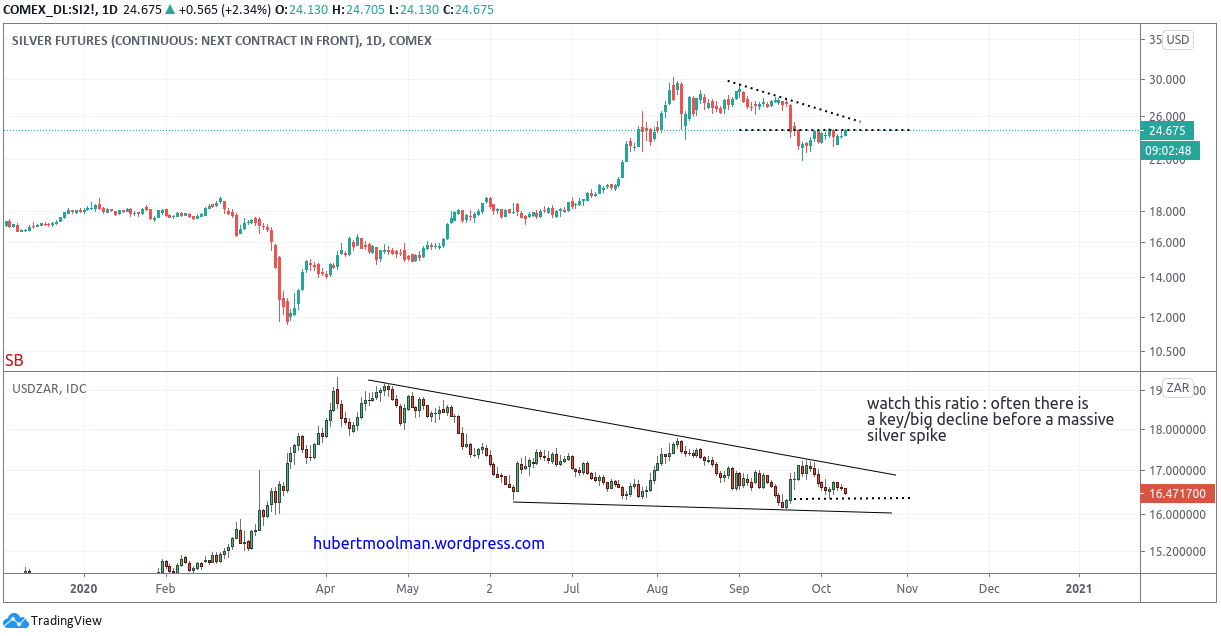
Often we see a key or big decline in the USD/ZAR ratio just before a massive silver spike. Here, possibly a move (lower) out of the wedge. Also, silver does seem ready to move much higher soon.
This is all still consistent with the greater silver cycle as shown in this chart:
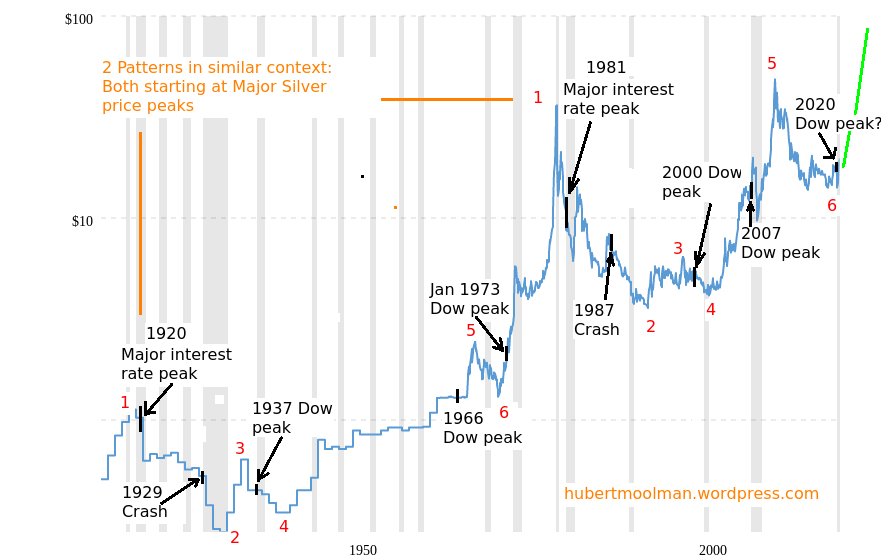
For more on this and this kind of fractal analysis, you are welcome to subscribe to my premium service. I have also recently completed a Silver Fractal Analysis Report as well as a Gold Fractal Analysis Report.