Although silver has been quiet in recent weeks, leaving investors puzzled, a bullish chart pattern now appears to be taking shape—indicating that the rally may soon resume.
For context, both gold and silver have been in healthy sideways consolidations, taking a breather after strong runs earlier this year. This kind of pause is typical in financial markets, especially during the quieter summer months when trading activity slows as traders head off on vacation. Let’s take a closer look at the charts.
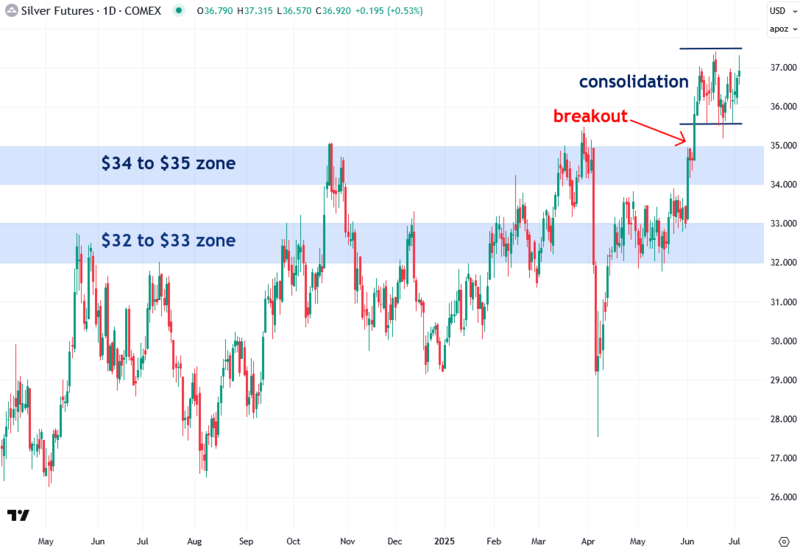
About a month ago, silver finally broke out above two key resistance zones that had capped its gains for the past year: first the $32–$33 zone, and then the $34–$35 zone. This breakout is a strong indication that silver’s bull market is gaining momentum.
While silver has spent the past few weeks in a healthy consolidation, it has managed to hold onto its gains — a very constructive sign. I’m now watching for a breakout from this consolidation, which I believe will set the stage for a rapid move to $40 an ounce and beyond.
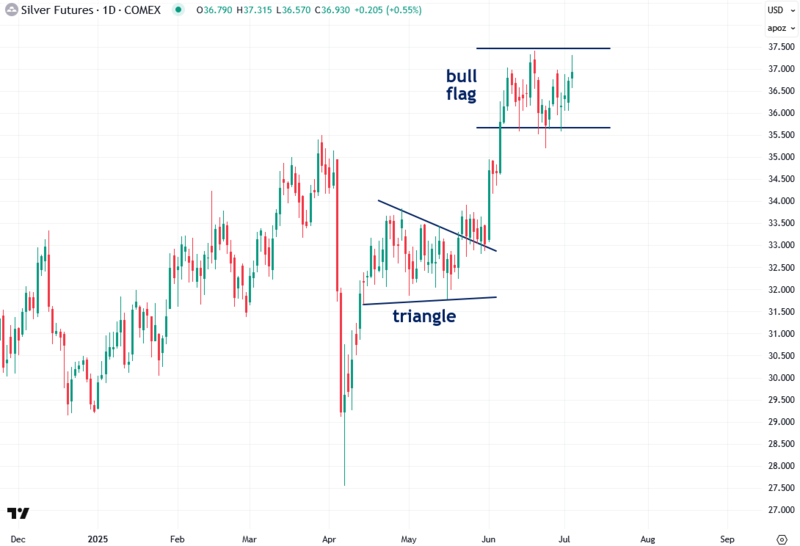
Interestingly, if you take a closer look, the recent consolidation actually resembles a classic bull flag pattern — exactly what you want to see in a strong uptrend. This pattern indicates further gains are likely on the horizon, though a decisive breakout to the upside with strong volume is needed for confirmation.
It’s also worth noting that silver often rallies in this step-like fashion, moving from one technical pattern to the next.
For example, last month’s $4.50 per ounce surge was preceded by a well-defined triangle pattern that formed in April and May. The current bull flag appears to be continuing this pattern of behavior, making it an exciting setup to watch for us silver bulls.
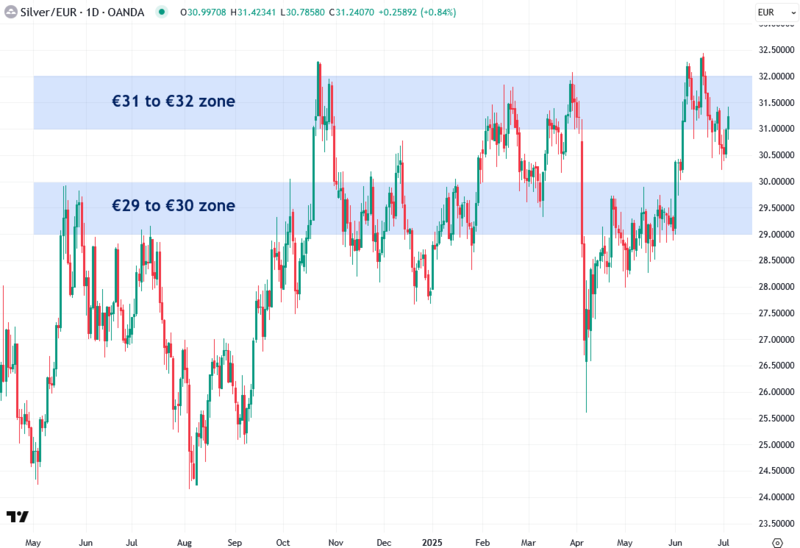
In addition to tracking COMEX silver futures, I also closely monitor silver priced in euros. This helps strip out the influence of U.S. dollar fluctuations and often provides a clearer view of the underlying trend. Euro-denominated silver also tends to respect key €1 increments—such as €30, €31, and €32—which often act as support and resistance levels.
Similar to COMEX silver futures, silver priced in euros has struggled with two major resistance zones: €29–€30 and €31–€32. Recently, it managed to break through the €29–€30 level, but its first attempt to clear €31–€32 was short-lived, as silver retreated in tandem with a strengthening euro.
The encouraging news is that silver is once again pushing into the €31–€32 zone and looks poised for another breakout attempt — especially if U.S. dollar-priced silver futures (as shown in the earlier charts) break out of its bull flag pattern. Ideally, I’d like to see a confirmed breakout in euros as well, which would signal that silver’s bull market is broad-based and not merely a result of recent dollar weakness.
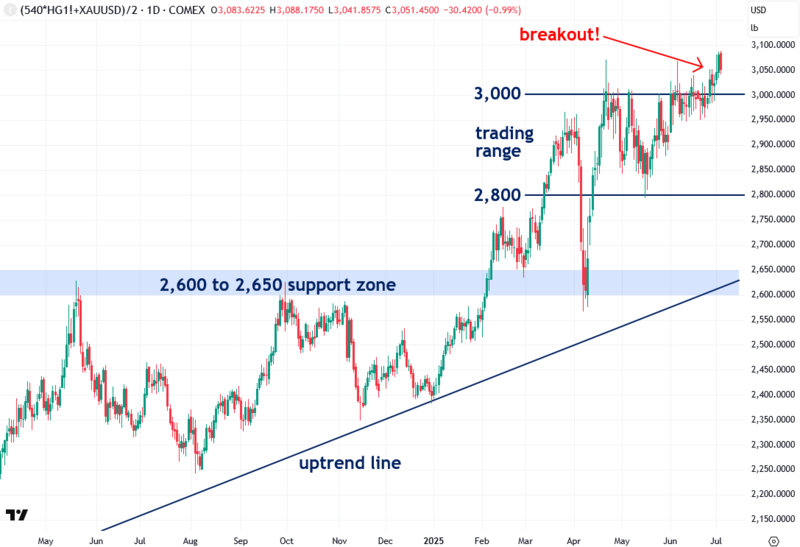
I’ve also developed a proprietary indicator called the Synthetic Silver Price Index (SSPI), designed to help validate silver’s price action and filter out potential false breakouts.
The SSPI is calculated as the average of gold and copper prices, with copper scaled by a factor of 540 to prevent gold from dominating the index. Interestingly, even though silver isn’t part of the calculation, the SSPI closely tracks its movements.
Excitingly, the SSPI finally broke out of its 2,800–3,000 trading range over the past few days, where it had been stuck since March — a promising sign for silver.
This breakout suggests a new tailwind for silver, as strong performances in both gold and copper tend to put pressure on arbitrage trading algorithms to buy silver in sympathy.
The move in the SSPI was one of the key confirmations I had been watching for, along with a breakout in silver priced in euros, which I’m still waiting to see.
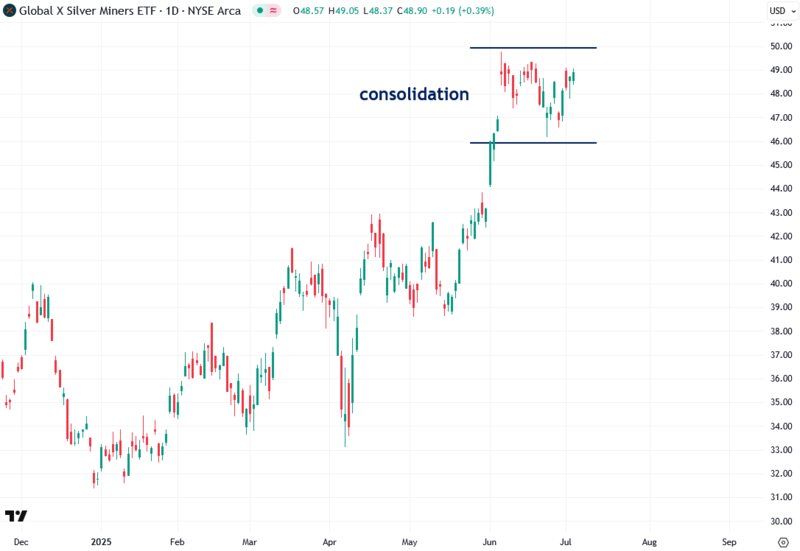
The consolidation — or bull flag — pattern forming in silver is also clearly visible in silver mining stocks, as reflected in popular exchange-traded funds (ETFs) like SIL, which tracks large silver miners.
A decisive breakout from silver’s bull flag, combined with a high-volume breakout in SIL, is likely to ignite a powerful rally in the silver mining sector. I personally invest in both silver bullion and select mining stocks.
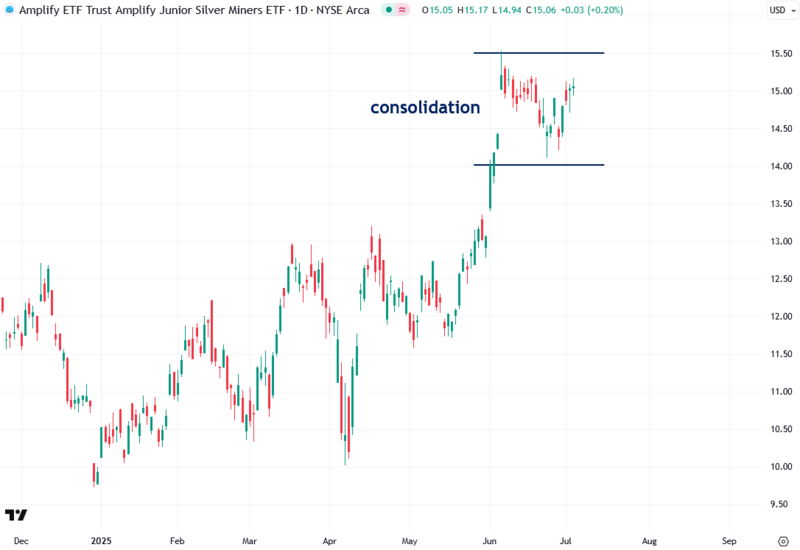
A bull flag pattern is also clearly visible in SILJ, the popular ETF that tracks junior silver mining stocks:
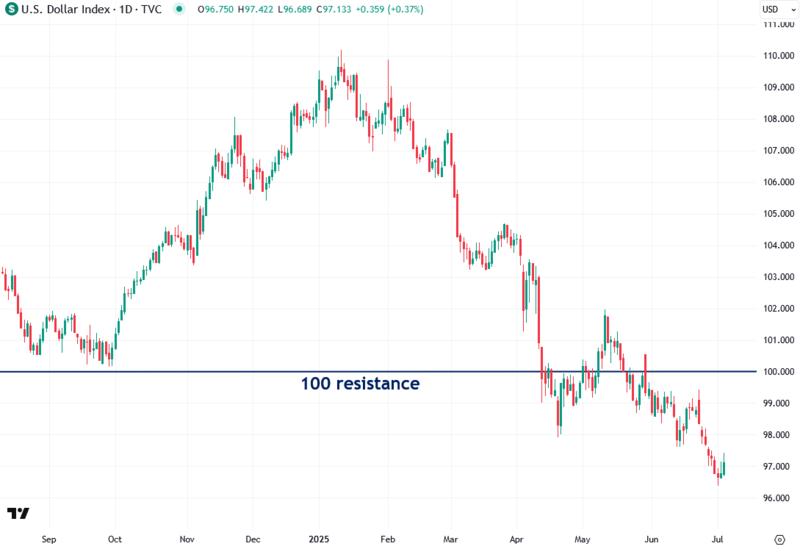
Another key asset I closely monitor to better understand the broader commodity landscape is the U.S. dollar—specifically the U.S. Dollar Index, which has historically moved inversely to commodities, including precious metals. As I’ve recently noted, the Dollar Index broke below the critical 100 support level, which has now flipped into resistance.
This marks a significant technical breakdown that tilts the outlook for the dollar decidedly bearish—while reinforcing a strong bullish backdrop for commodities like gold, silver, platinum, and copper.
Notably, the dollar’s weakness amid recent Middle East turmoil—an environment that typically strengthens safe-haven assets like the dollar—signals deeper underlying fragility.
To summarize, I’m encouraged by the bull flag pattern forming in silver right now, as this classic continuation pattern indicates even further upside ahead — potentially mirroring last month’s sharp $4.50-per-ounce surge in just a few days.
Of course, I always wait for confirmation through a decisive breakout on strong trading volume, which is what I’m watching for now. I’m feeling optimistic and, as always, I’ll keep you all updated.
If you found this report valuable, click here to subscribe to The Bubble Bubble Report for more content like it.
About the author