Gold has been soaring all year, while silver has spent the past nine months languishing, leaving long-suffering investors wondering: Will silver always play second fiddle to gold, or is it finally ready to shine? Like many, I’ve been frustrated by silver’s lackluster performance, but in this report, I’ll highlight a growing number of reasons to believe its rough patch may soon be over. Silver may finally step out of gold’s shadow and embark on a sustained bull market of its own.
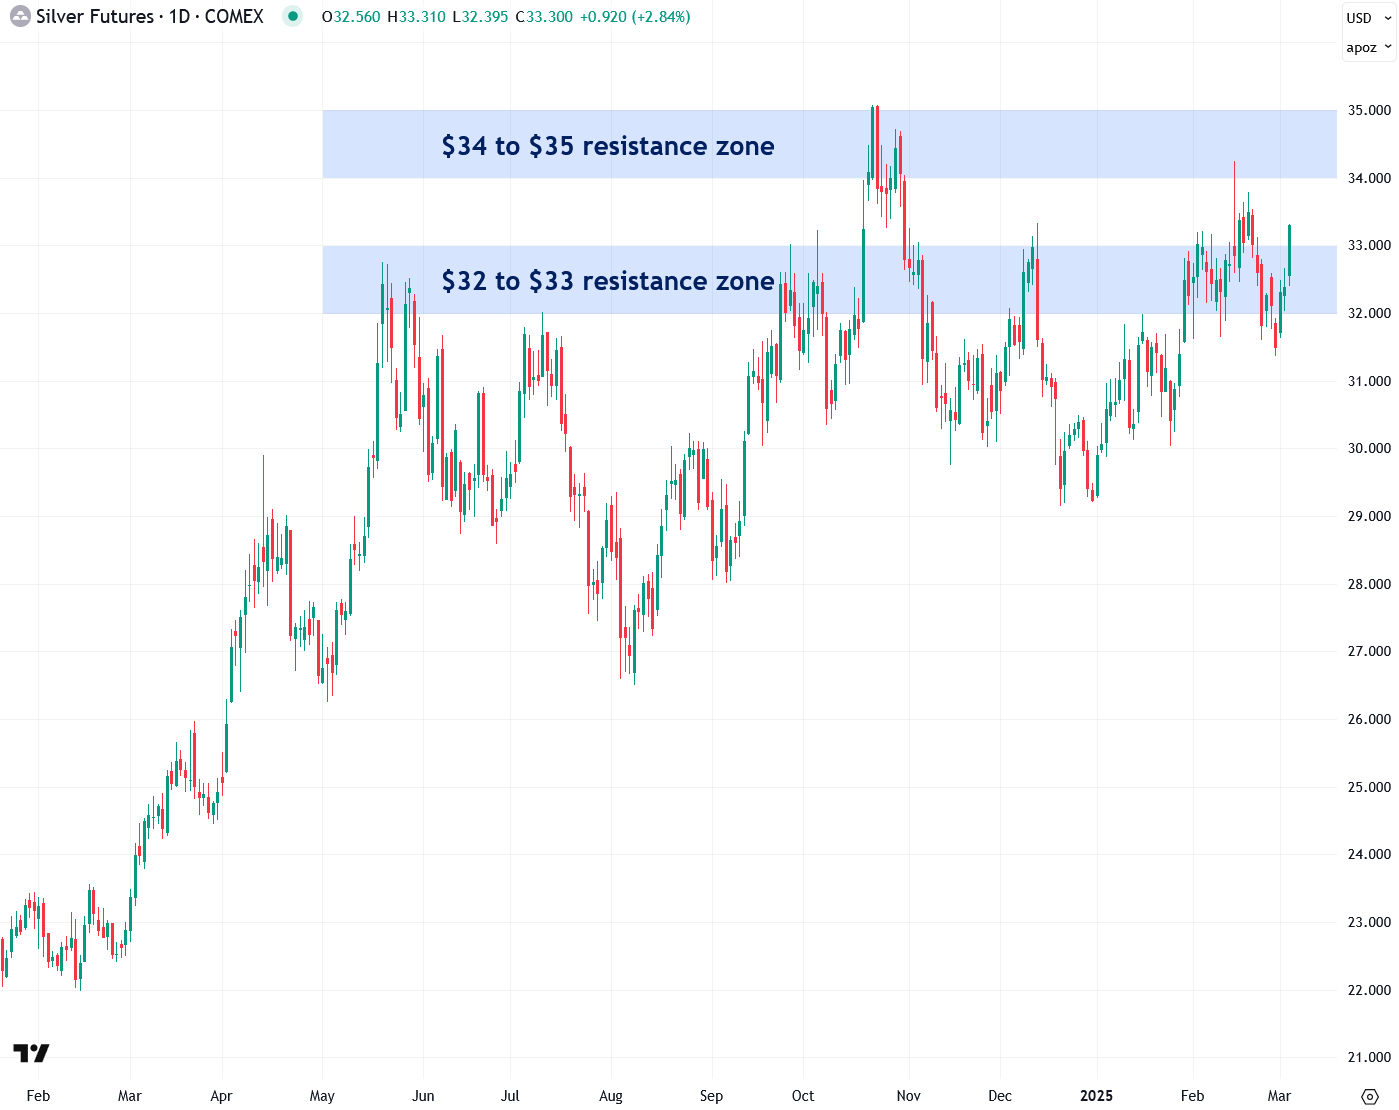
The first key sign that silver is ready to surge is its decisive move above the $32 to $33 resistance zone, which has acted as a stubborn ceiling for much of the past year. This breakout is an encouraging signal, but the next crucial confirmation will be a strong, high-volume close above the $34 to $35 resistance zone—the same level that halted the late-October rally in its tracks. Once silver clears both barriers, the path should be wide open for the powerful bull market I’ve anticipated since April 2024. However, for this breakout to remain valid, silver must close and hold above both resistance zones; otherwise, all bets are off.
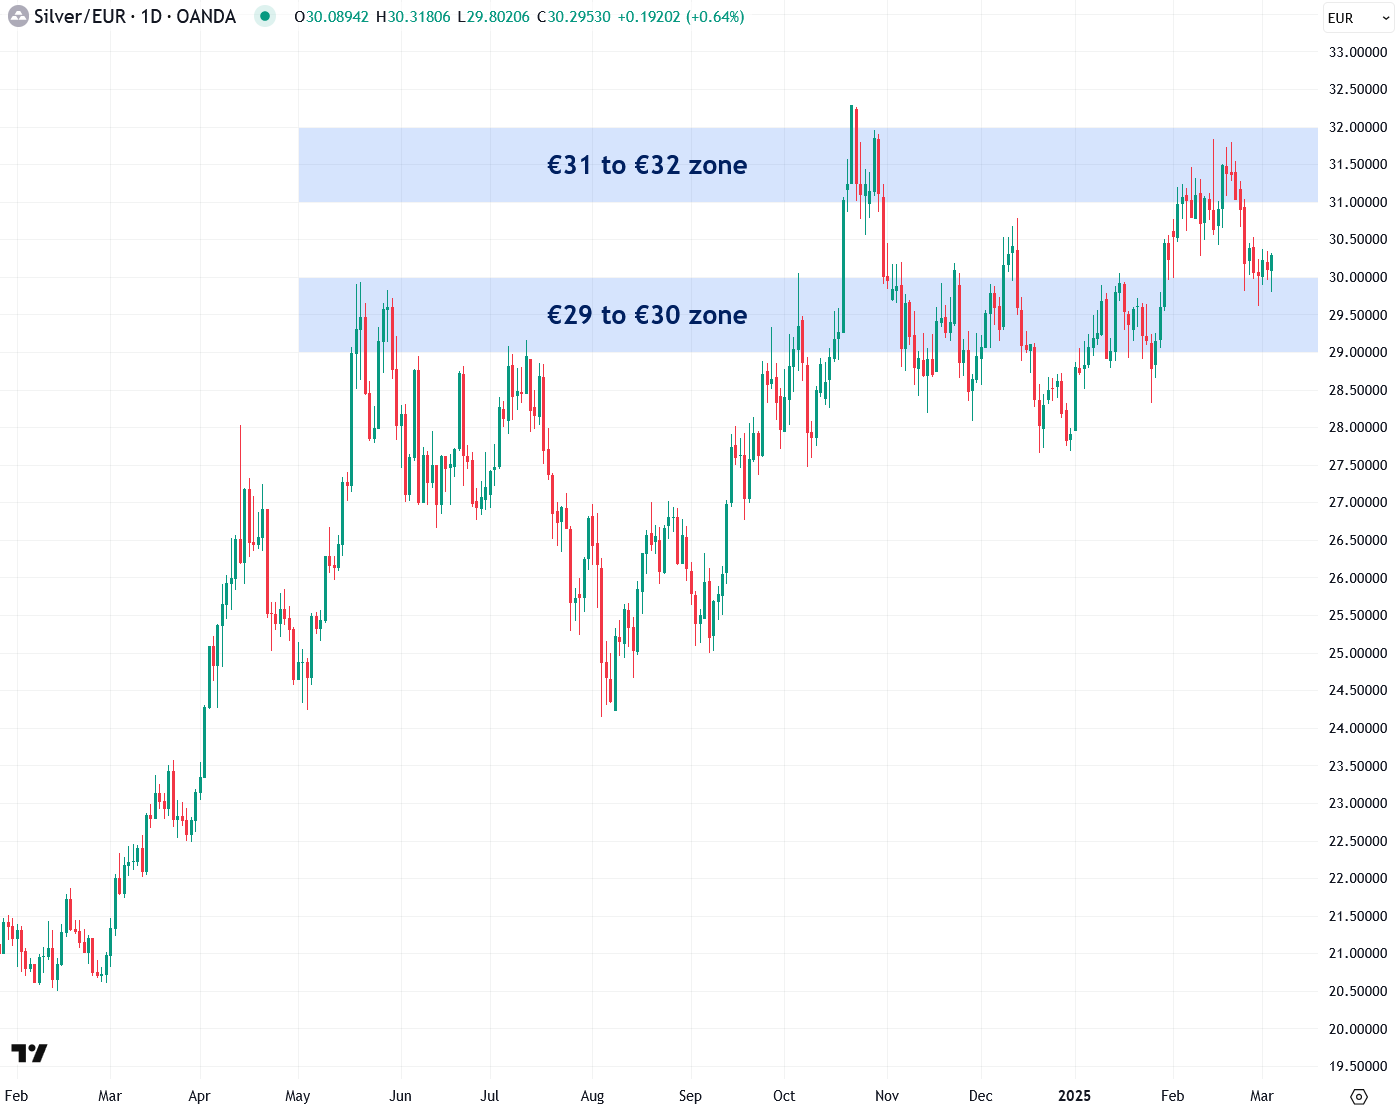
 I closely monitor silver priced in euros because it provides valuable insights by stripping away the influence of U.S. dollar fluctuations, offering a clearer view of silver’s intrinsic strength. In euro terms, silver tends to respect key levels such as €30, €31, and €32, forming well-defined areas of support and resistance.
Recently, silver broke above the €30 level—a bullish signal—establishing it as a new support. Next, a decisive close above €32 (the late October high) is necessary to signal that the next phase of the bull market has begun. That said, for the breakout to remain valid, silver must close and hold above both resistance zones; otherwise, I would consider it invalidated.
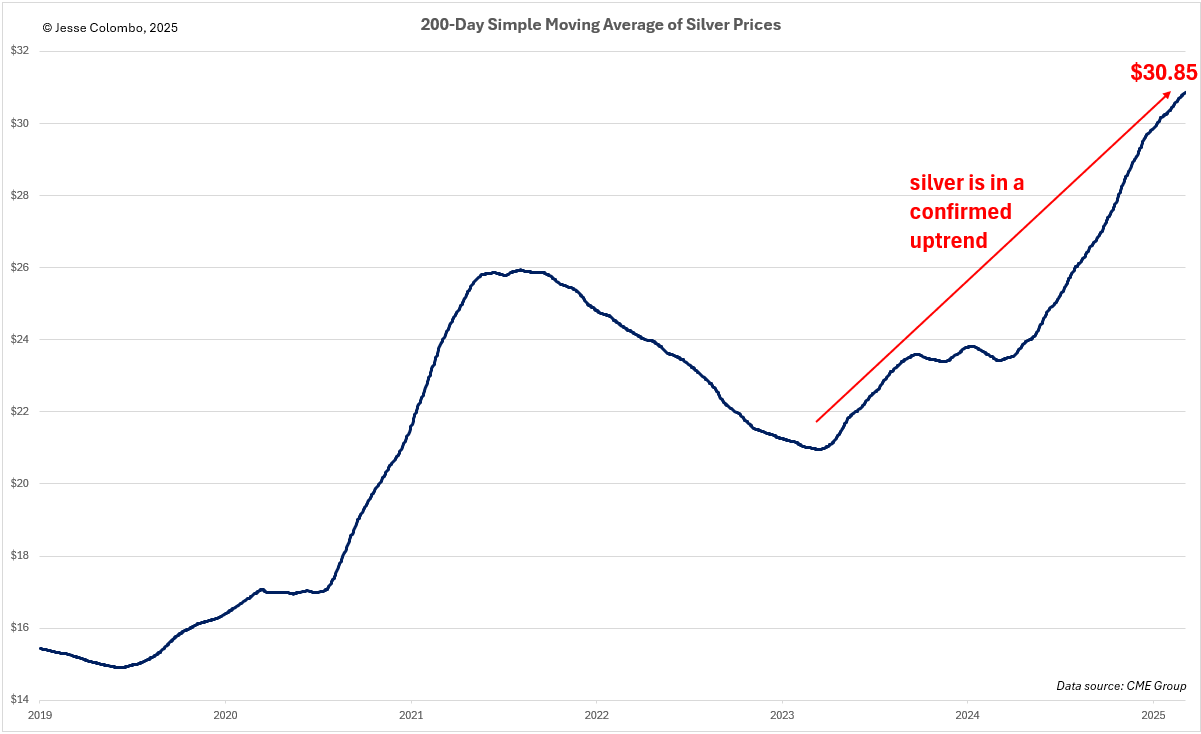
 Although silver has traded in a choppy, erratic manner for much of the past year, it is in a confirmed uptrend, despite grinding higher in a frustrating “two steps forward, one step back” manner. This is evident in the 200-day simple moving average, a helpful tool for identifying an asset’s primary trend by filtering out short-term price fluctuations.
More importantly, the 200-day moving average suggests that the odds favor further gains, as a trend in motion tends to stay in motion—much like Newton’s first law of motion, also known as the law of inertia. The even better news is that once silver fully breaks out, as discussed earlier, I expect it to rise in a much more orderly fashion rather than continuing its erratic price swings.
 One of the key reasons I believe silver is on the verge of a powerful new phase in its bull market is gold’s impressive rally over the past year. Historically, gold is a major driver of silver’s price, though silver often lags before catching up. With economic uncertainty rising and the risk of a recession increasing, I believe gold still has plenty of upside potential, as I discussed in this article.
Based on historical patterns, gold could climb to roughly $3,380 in this leg of the rally alone, which would provide a strong catalyst for silver. As I’ll explain shortly, the higher gold climbs, the more undervalued silver will become relative to gold, making it increasingly difficult for silver to remain at these relatively low levels while gold continues to soar.
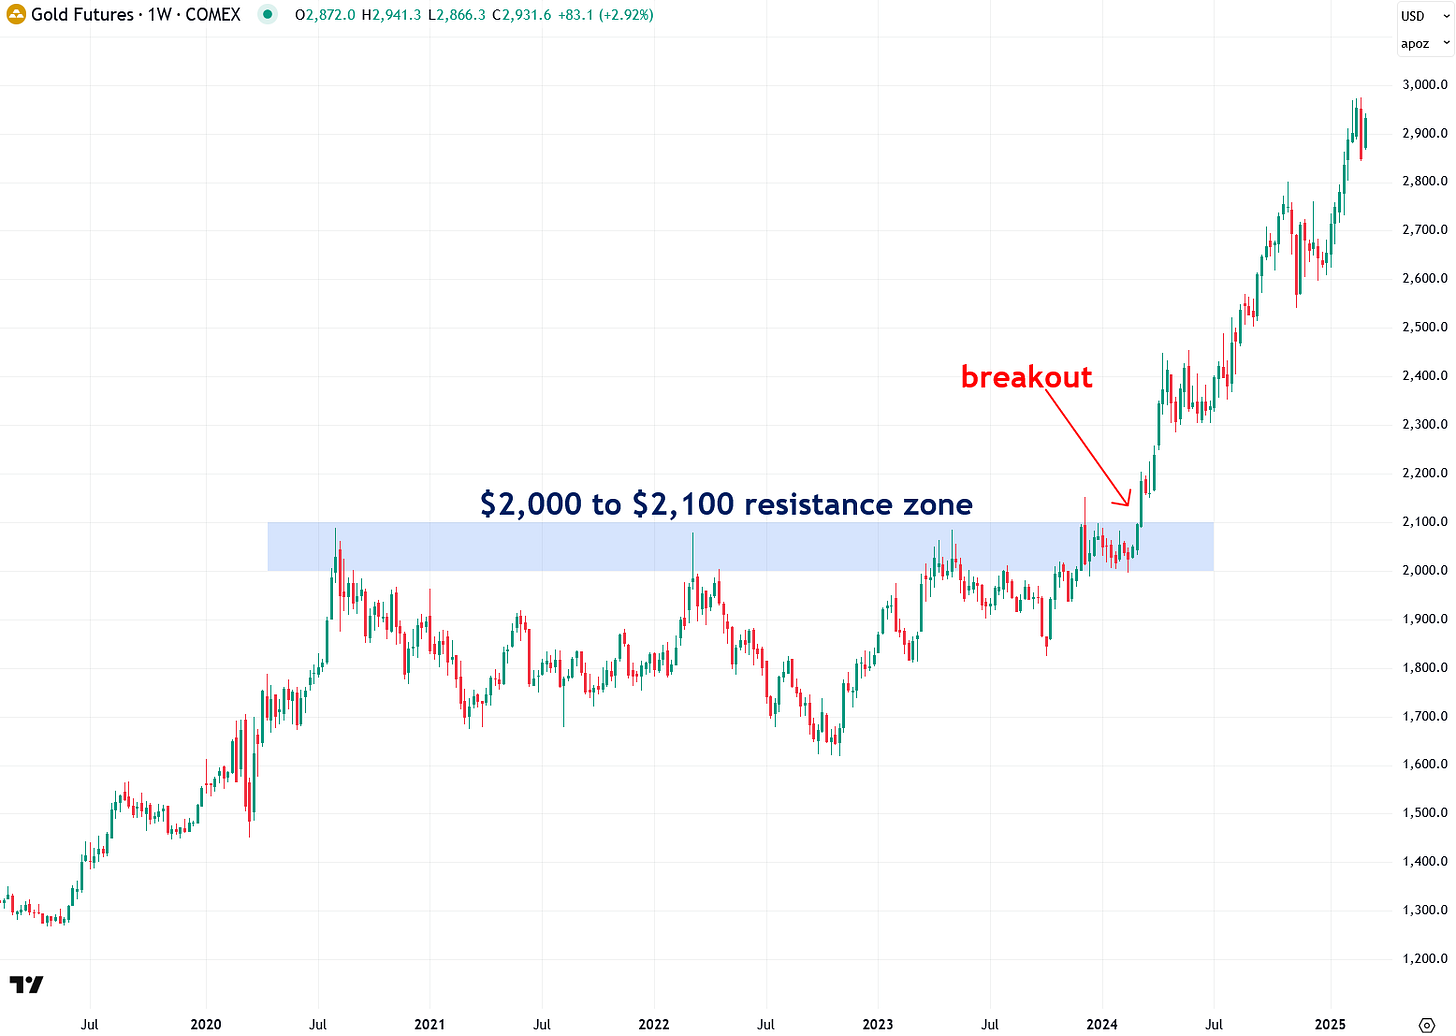
Also, take a look at the chart below and notice how gold struggled from 2020 to early 2024 to break above the $2,000–$2,100 resistance zone, which acted as a price ceiling for much of that period. Despite multiple attempts, gold was repeatedly pushed back down. However, in March 2024, it finally broke out, igniting the powerful bull market we see today. I see striking parallels with silver’s $32–$33 resistance zone over the past year and believe that once silver manages to close above this level, it will soar just as gold did.
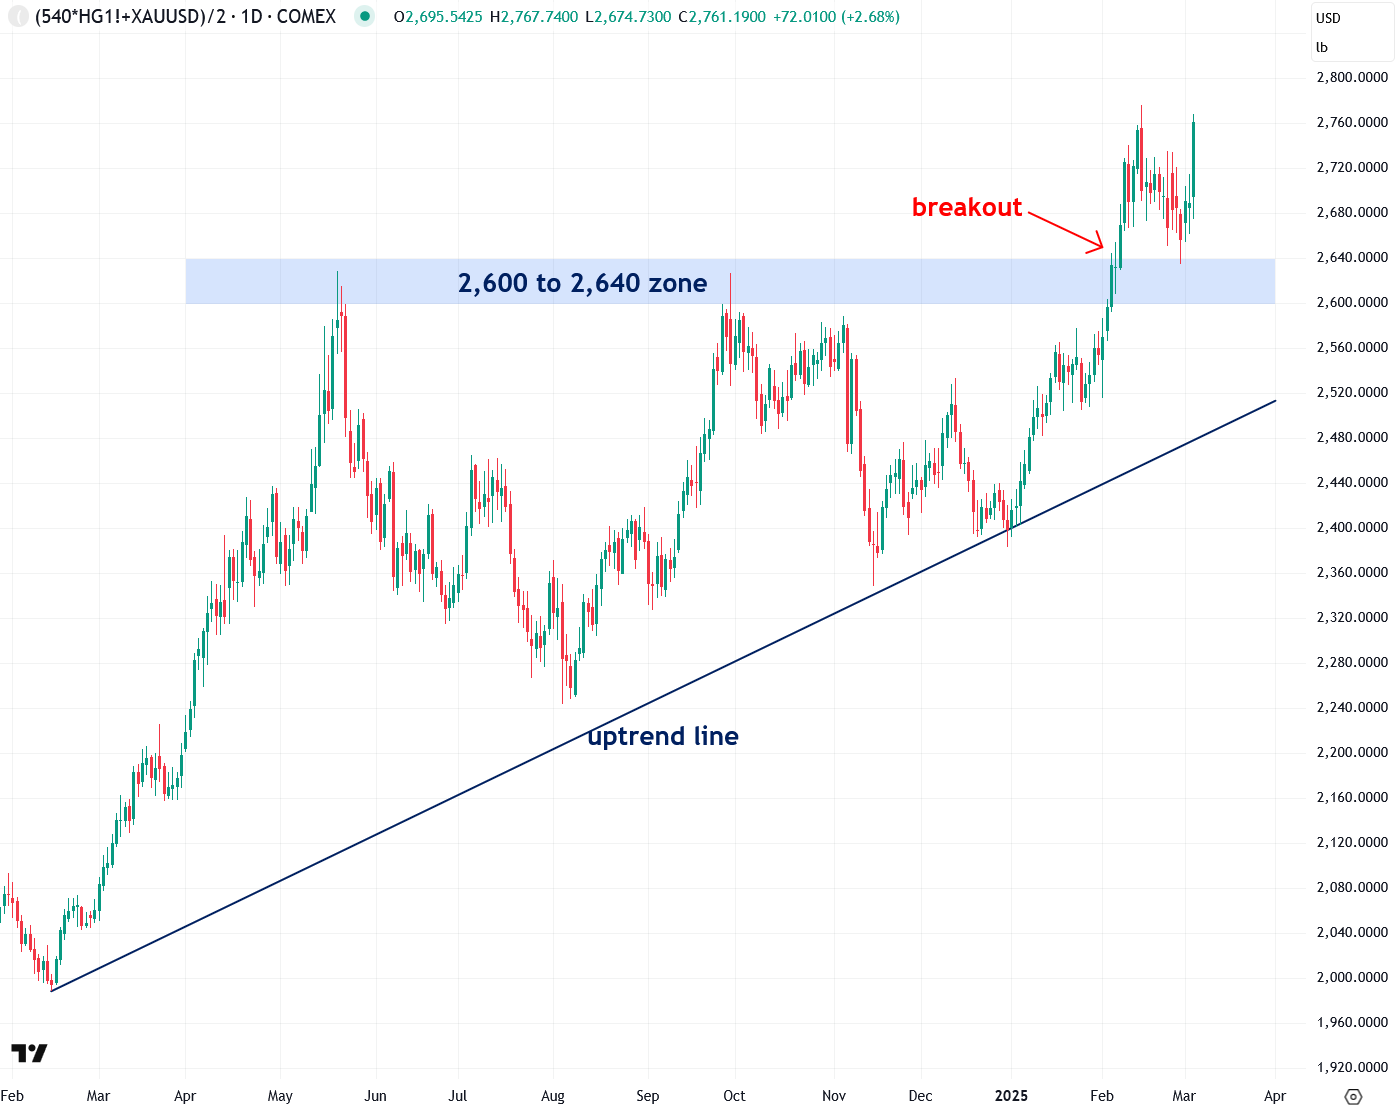
 In addition to gold, copper is another key metal that strongly influences silver’s price, as I explained here. This understanding led me to develop the Synthetic Silver Price Index (SSPI)—an indicator designed to validate silver’s price movements and filter out potential fakeouts. The SSPI is calculated as the average price of gold and copper, with copper adjusted by a factor of 540 to ensure that gold doesn’t disproportionately impact the index. Remarkably, despite silver not being an input, the SSPI closely mirrors silver’s price movements.
For several months, I’ve been closely watching the SSPI as it struggled to break above the critical 2,600 to 2,640 resistance zone, repeatedly emphasizing that a breakout above this level would be a strong bullish confirmation for silver. Thanks to recent impressive rallies in both copper and gold, that long-anticipated breakout has finally occurred, signaling that a significant move in silver is likely imminent. However, for this breakout to remain valid, the SSPI must stay above the 2,600 to 2,640 zone, which has now turned into a key support level. If it holds, it will further strengthen the case for a powerful silver rally ahead.
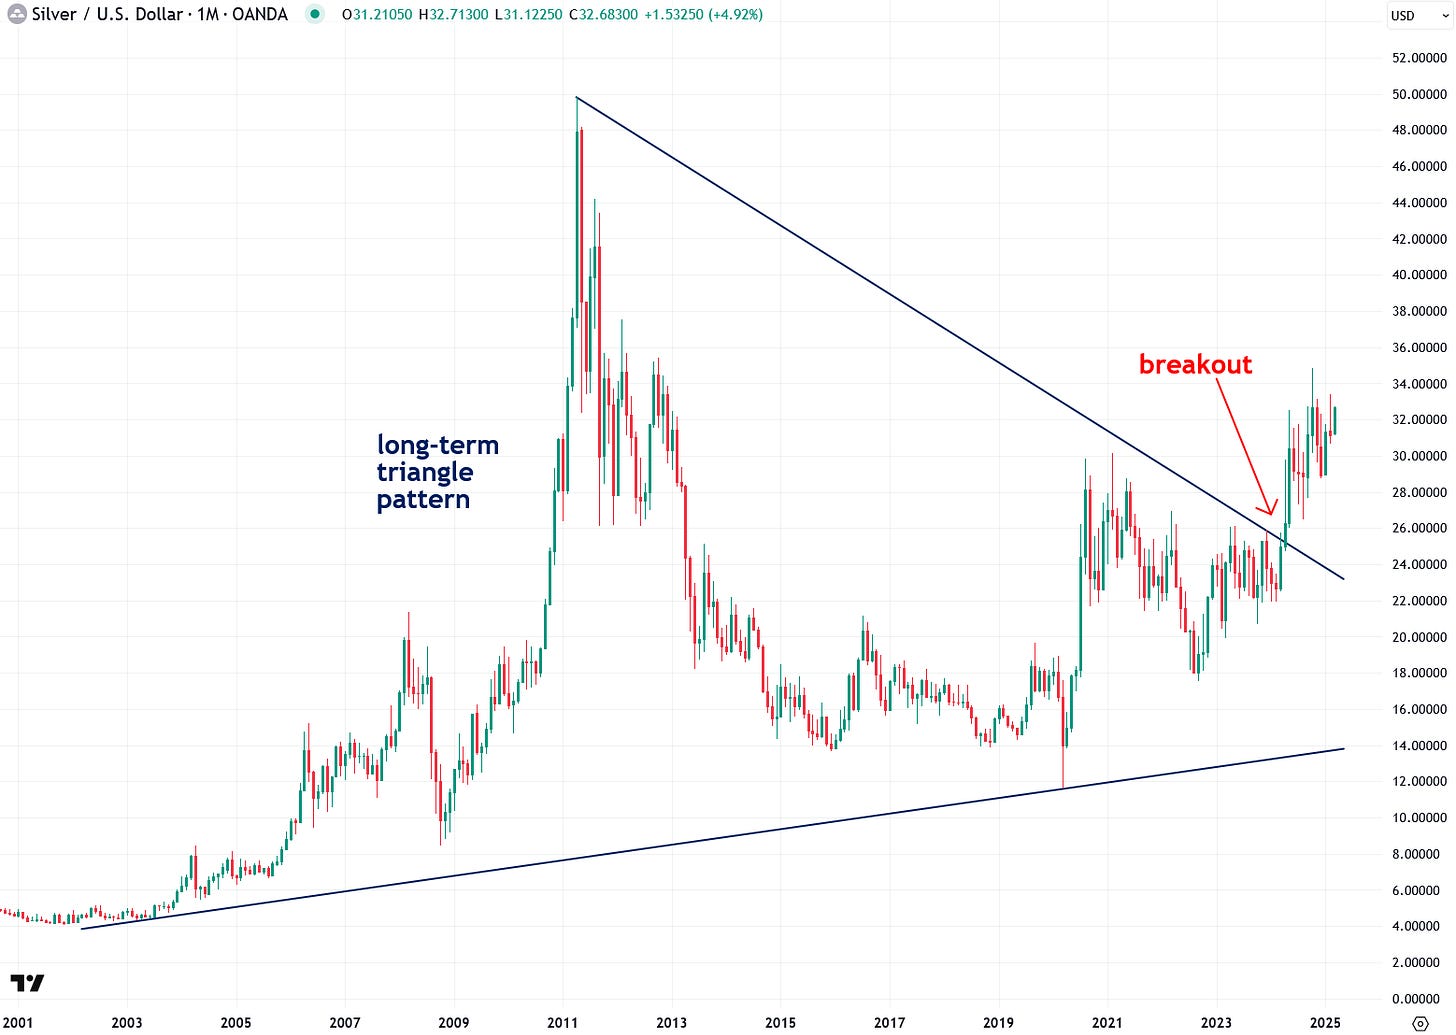
 Another strong indication that silver is on the verge of a powerful bull market is its breakout in April 2024 from a two-decade-long triangle pattern—a development I highlighted in my bullish thesis published in a widely read ZeroHedge article at the time:
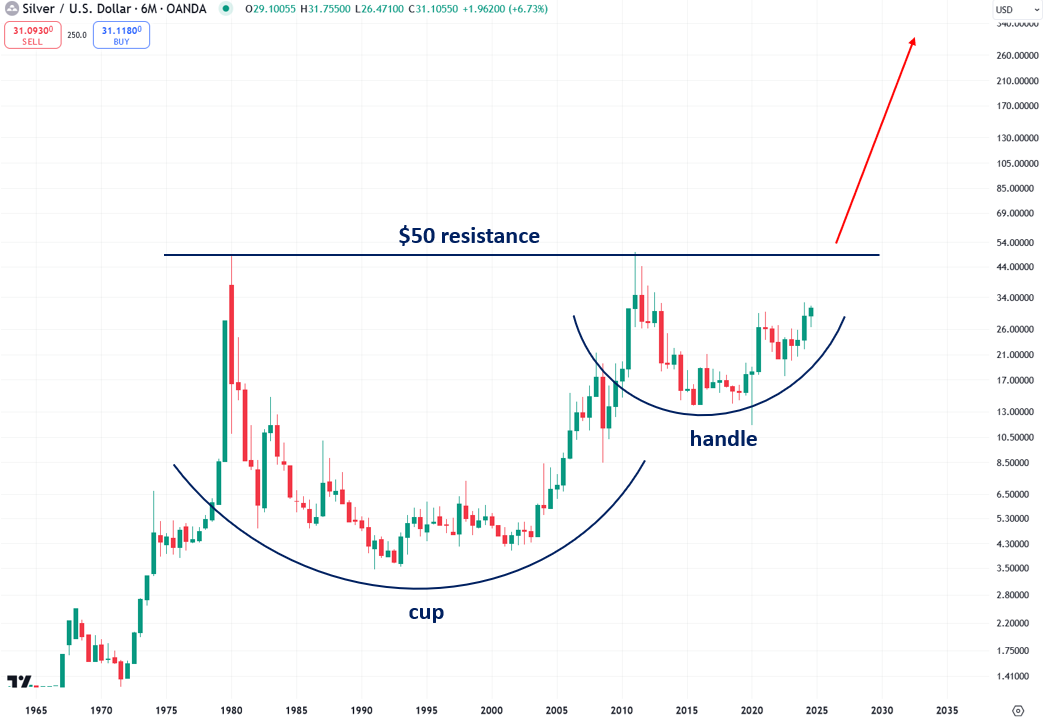
 Even more exciting is the fact that silver’s logarithmic chart, dating back to the 1960s, reveals a cup-and-handle pattern, indicating the potential for silver to reach several hundred dollars per ounce during this bull market. In order to confirm this particular scenario, silver needs to close decisively above the $50 resistance level.
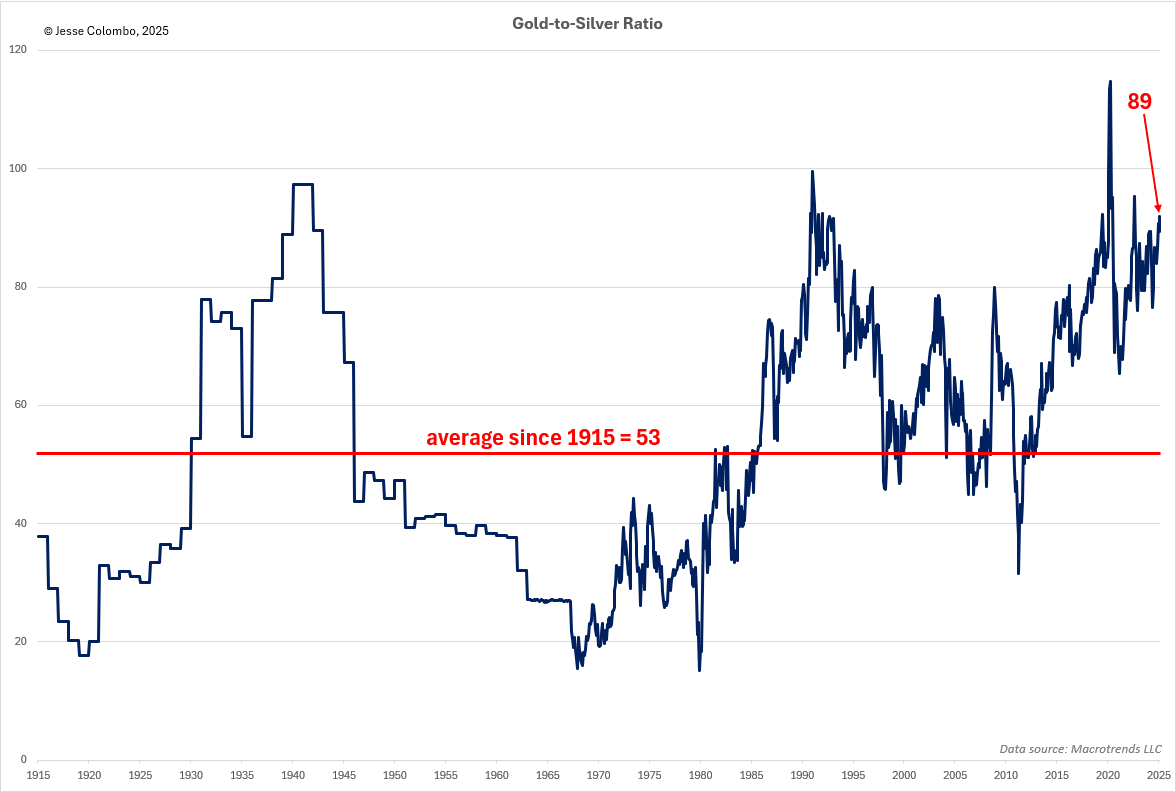
 The long-term gold-to-silver ratio chart clearly shows that silver is significantly undervalued relative to gold, suggesting that silver has substantial upside potential. As silver rises to close this gap, the ratio will decline. The current gold-to-silver ratio stands at 89, but if it were to revert to its historical average of 53 since 1915—without any increase in gold’s price—silver would be valued at a solid $55 per ounce (as compared to the current price of $32.65).
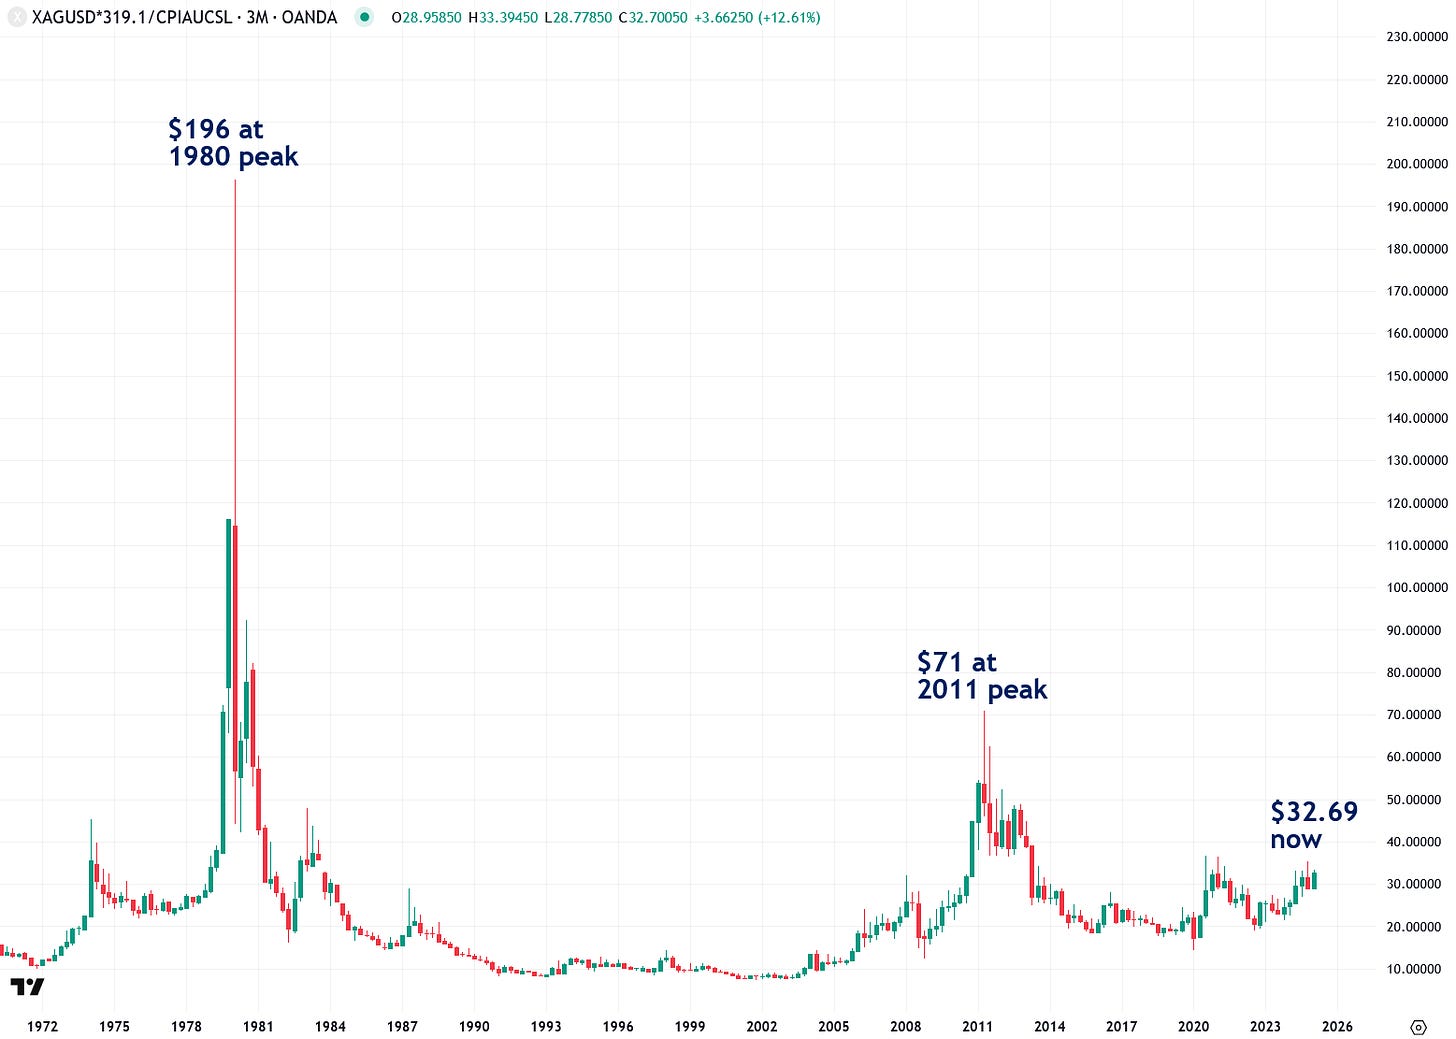
 Adjusting silver’s price for inflation further highlights how undervalued it is by historical standards. During the Hunt brothers-induced spike in 1980, silver reached an inflation-adjusted price of $196. In the 2011 bull market, driven by quantitative easing, it hit $71. Currently trading at just $32.69, silver has significant room to rise if it’s to catch up with these previous inflation-adjusted peaks.
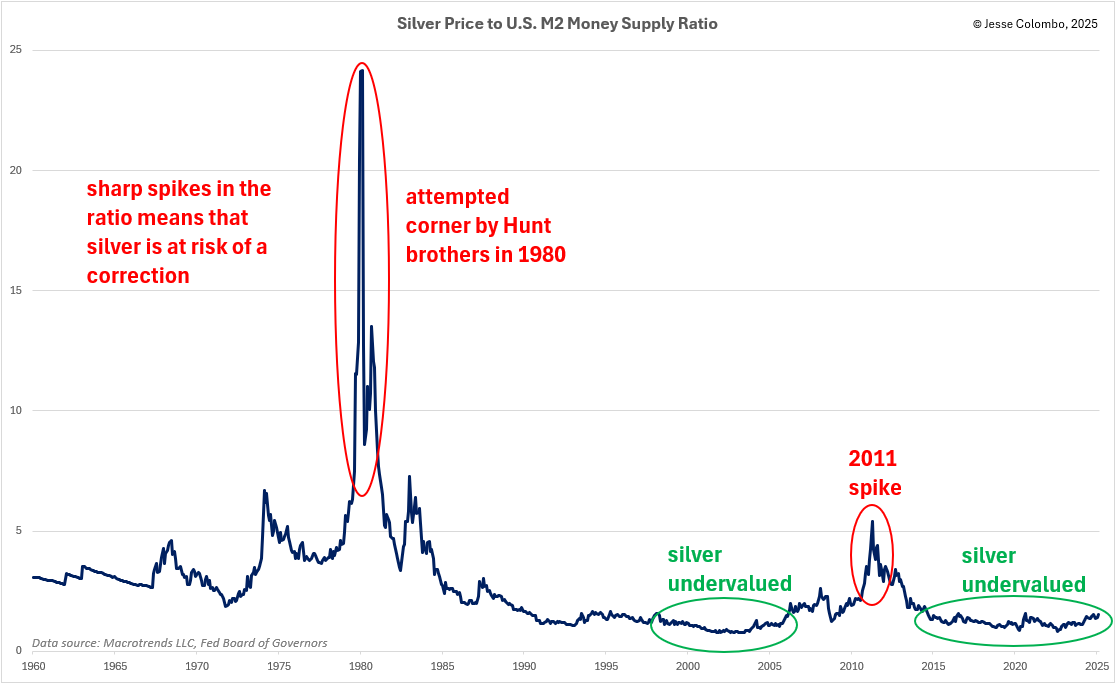
 Another way to assess whether silver is undervalued or overvalued is by comparing it to various money supply measures. The chart below shows the ratio of silver’s price to the U.S. M2 money supply, providing insight into whether silver is keeping pace with, outpacing, or lagging behind money supply growth. If silver’s price significantly outpaces money supply growth, the likelihood of a strong correction increases. Conversely, if silver lags behind money supply growth, it suggests a potential period of strength ahead. Since the mid-2010s, silver has slightly lagged behind M2 growth, which, combined with other factors discussed in this piece, positions it for a strong rally.
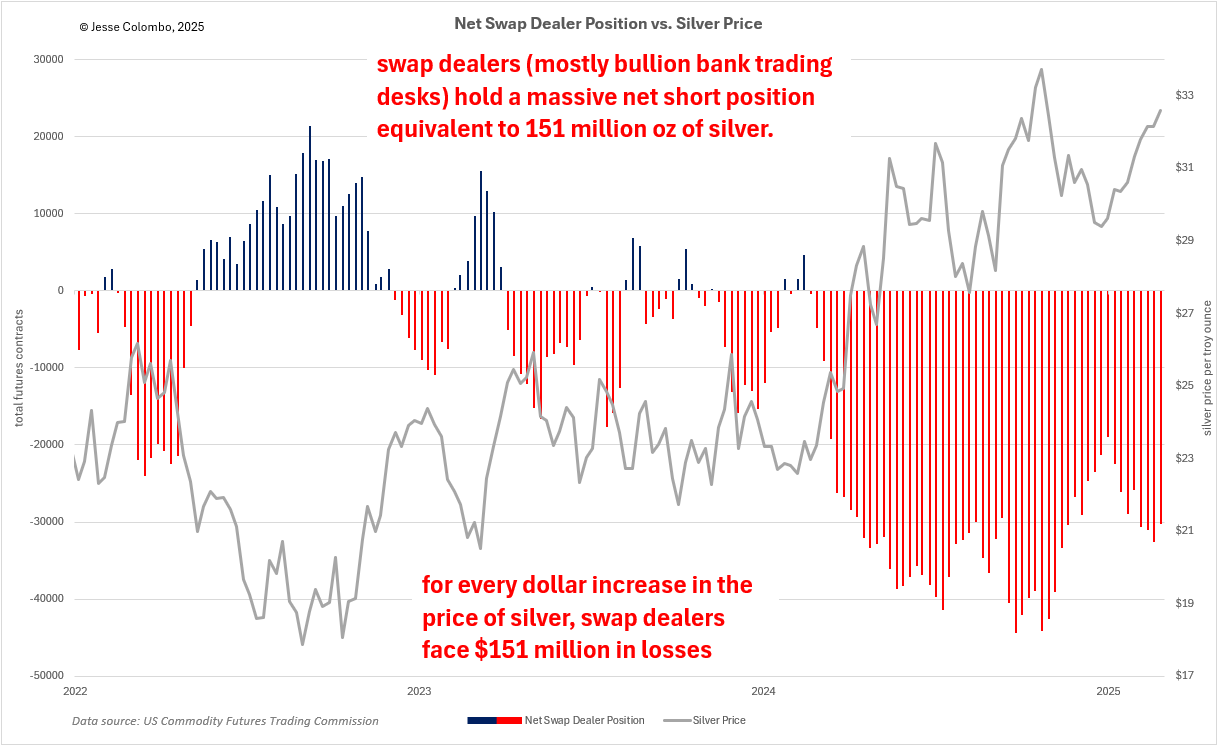
 One of the key factors keeping silver's price suppressed over the past year, even as gold surged, has been the heavy short-selling of COMEX silver futures by swap dealers—primarily the trading desks of bullion banks such as JPMorgan and UBS. This was a deliberate effort to cap silver’s price (check out an egregious recent example of this kind of manipulation). In the process, they amassed a massive net short position of 30,233 futures contracts, equivalent to 151 million ounces of silver—nearly one-fifth of the annual global silver production. This staggering figure highlights the immense downward pressure exerted on the silver market.
What’s even more astonishing is how much of this massive short position in silver futures is naked, meaning it isn’t backed by physical silver. It’s merely “paper” silver being dumped onto the market to suppress prices. However, once silver finally breaks out, it could trigger a wave of short-covering—when traders who bet against an asset through short-selling are forced to buy it back as prices rise to limit their losses. As the price climbs, these traders become increasingly desperate to close their positions, further fueling the rally.
If the buying pressure is intense enough, it could even lead to a short squeeze, dramatically amplifying silver’s upward momentum. Given the sheer size of their short position, bullion banks stand to lose approximately $151 million for every $1 increase in the price of silver—a setup for a major price surge. Now, just imagine what will happen as silver climbs by $5, $10, $20, and beyond from this point.
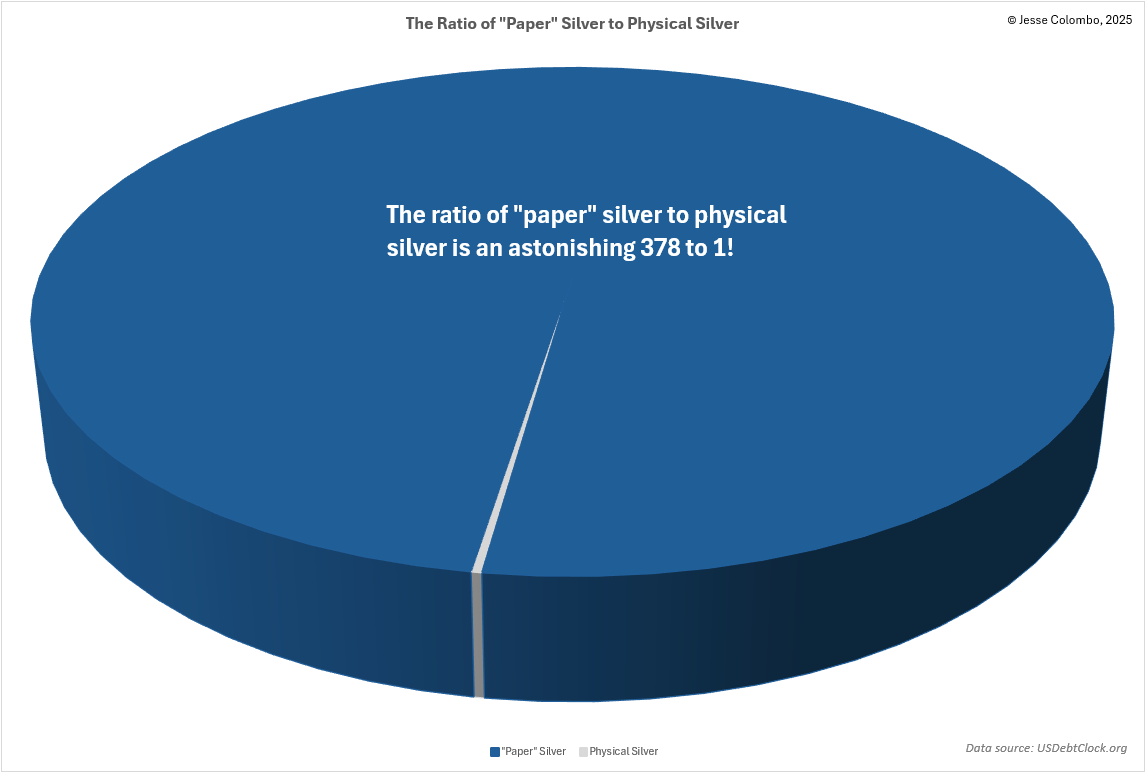
 The risk of an explosive silver short squeeze is further amplified by the astonishing ratio of 378 ounces of "paper" silver—ETFs, futures, and other derivatives—for every single ounce of physical silver. In a violent short squeeze, holders of "paper" silver could be forced to scramble for the extremely scarce physical silver to fulfill their contractual obligations. This would cause the price of "paper" silver products to collapse, while physical silver prices would skyrocket to jaw-dropping levels, potentially reaching several hundred dollars per ounce (this event is what may fulfill the price target implied by the cup and handle pattern I showed earlier).
 One key reason I believe silver will soon break free comes down to basic Economics 101: supply and demand. Over the past five years, silver demand has consistently exceeded supply, resulting in a persistent deficit—as shown in the chart below. In 2024 alone, the shortfall reached 182 million ounces, with an estimated additional 149 million ounces this year—and deficits are expected to continue for the foreseeable future. As a result, above-ground silver stocks are dwindling rapidly. While bullion banks can create unlimited amounts of paper silver to suppress prices, they can’t manufacture the real physical silver that is crucial for a wide range of industries, alongside growing investment demand.
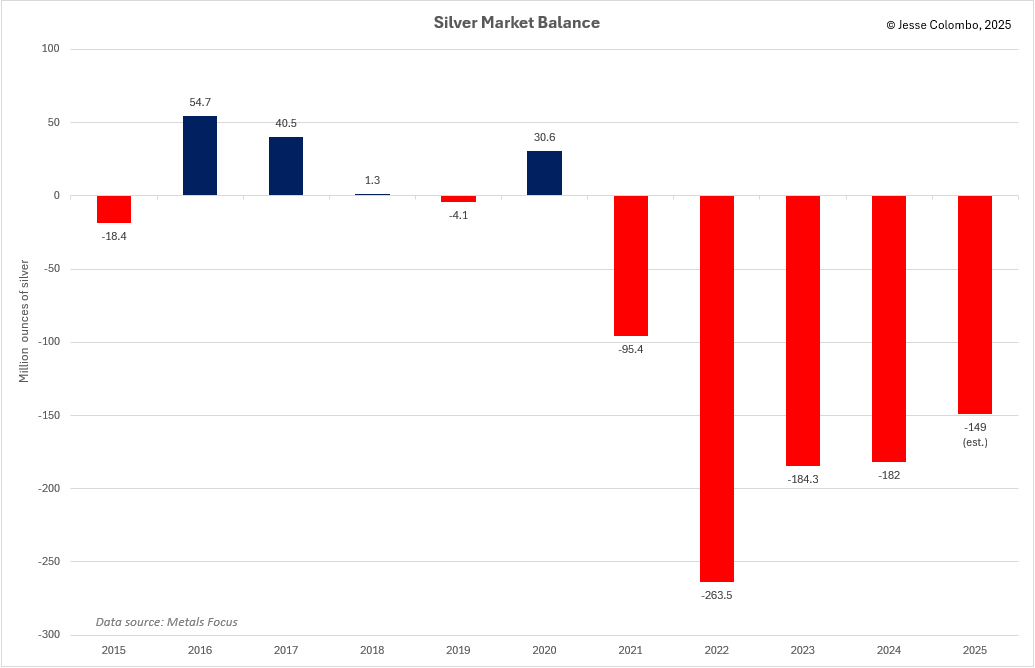 The persistent silver deficit stems from both dwindling supply and surging demand—a combination that, in an unmanipulated market, would naturally drive prices higher. That’s why I see silver as a beach ball being held underwater—pressure is building, and it won’t stay suppressed for much longer.
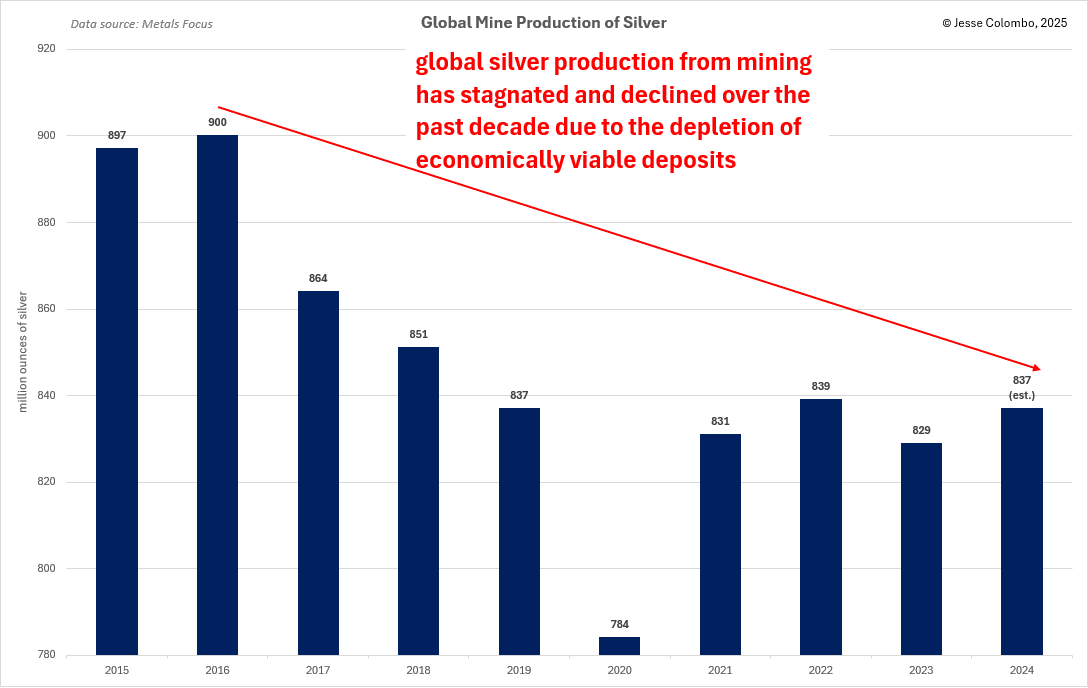
On the supply side, global silver mine production has peaked and declined over the past decade as economically viable deposits become depleted—something the bullion banks have absolutely no control over. And as time goes on, this supply crunch is only likely to worsen.
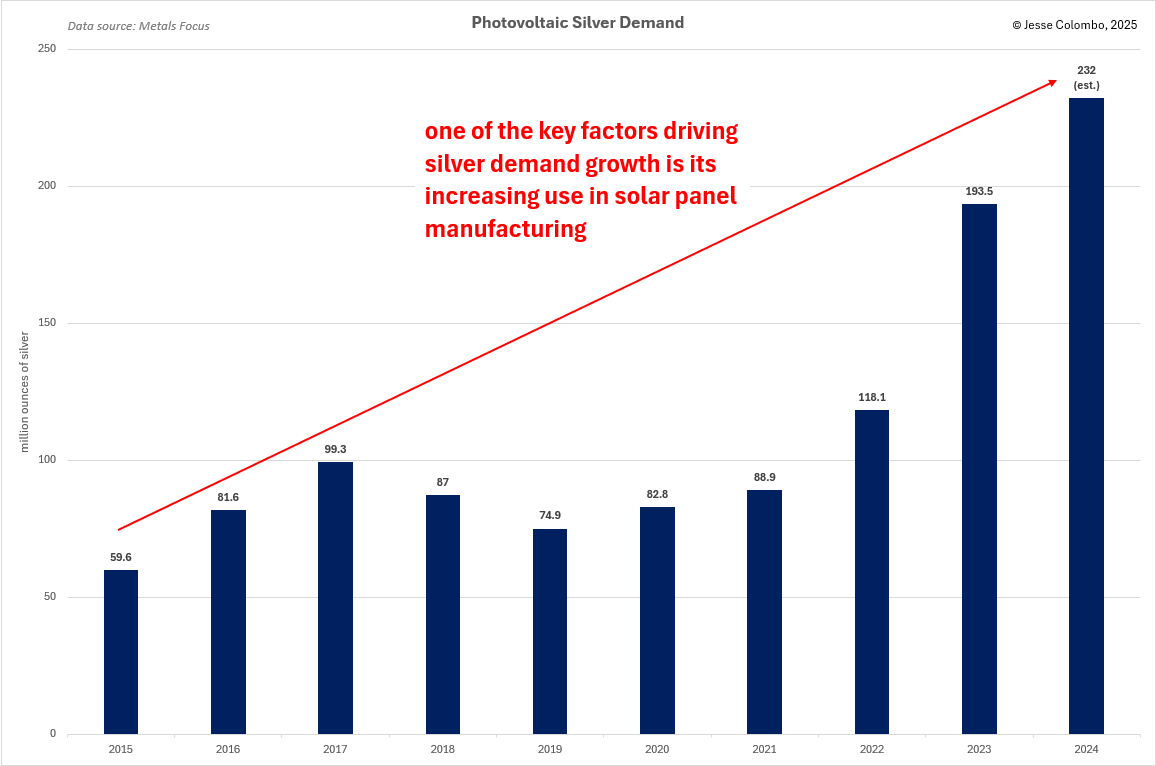
 At the same time, demand for physical silver has skyrocketed across multiple sectors, with the biggest driver being the surge in solar panel manufacturing. As the world shifts away from fossil fuels toward renewable energy, this trend is only in its early stages. Silver demand for photovoltaic (solar panel) applications alone has nearly tripled over the past four years, increasing by an astonishing 143.1 million ounces. With global efforts to expand clean energy accelerating, this demand is set to grow even further.
 Another key factor likely to drive precious metals prices higher is the growing risk of a U.S. recession and the Federal Reserve’s expected response to it, as I recently explained:
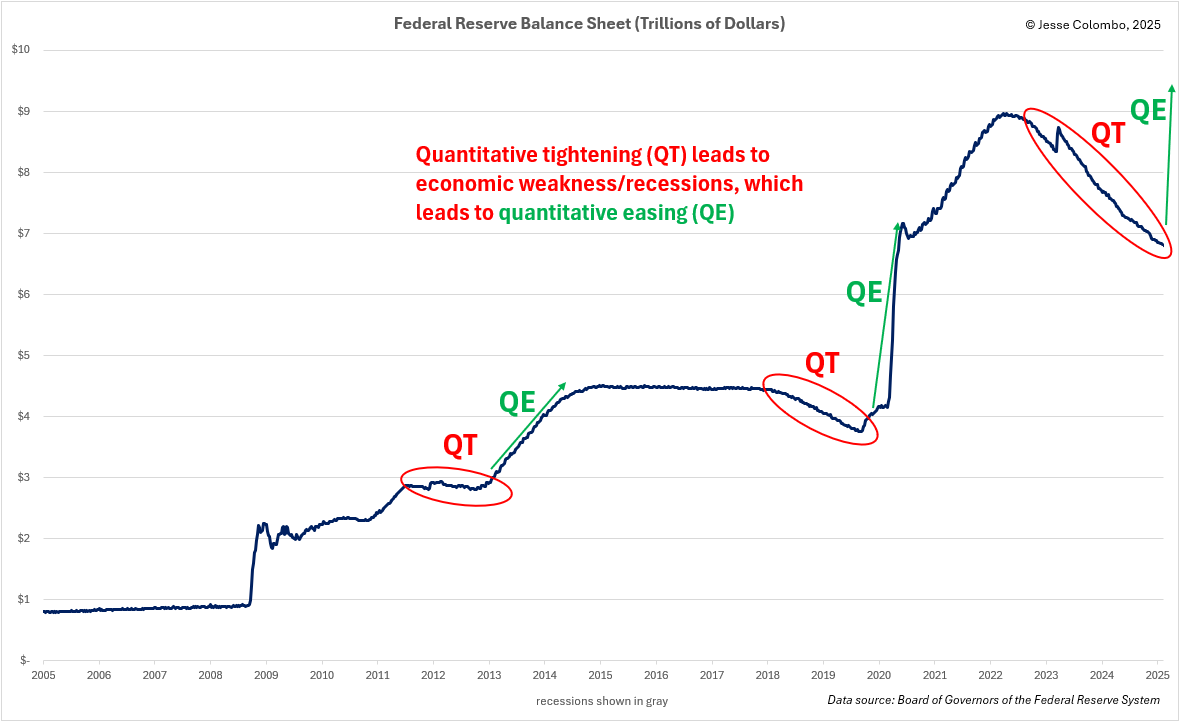
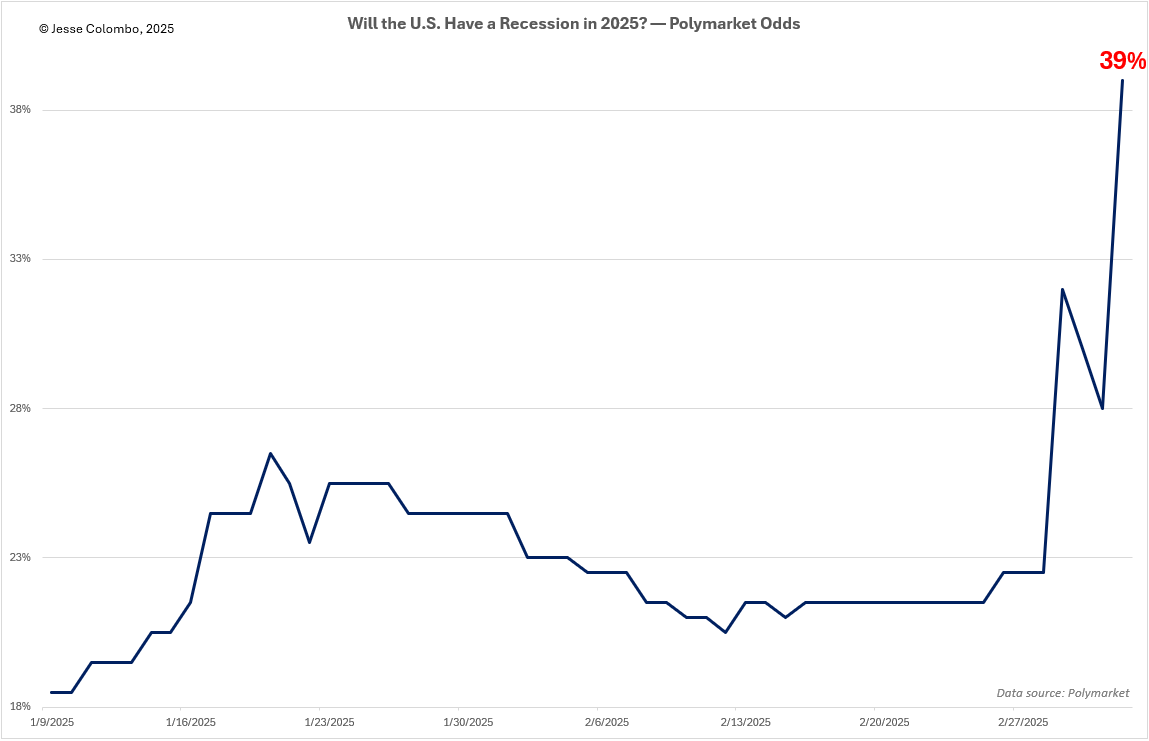 A recession would be extremely bullish for both silver and gold, as the U.S. Federal Reserve and government would respond with aggressive measures to support the economy. This would include slashing interest rates back to zero—and even into negative territory—while abruptly ending the current quantitative tightening (QT) policy and reviving quantitative easing (QE). In doing so, they will digitally create hundreds of billions—eventually trillions—of new dollars in a desperate attempt to stabilize financial markets and the broader economy.
 In summary, while most investors continue to overlook silver, it is well-positioned to thrive and catch up to gold’s soaring price. As we’ve seen, silver remains incredibly undervalued by multiple measures—including the gold-to-silver ratio, its inflation-adjusted price, its price relative to the M2 money supply, and the persistent supply-demand imbalance, with physical silver demand outpacing supply for over half a decade. For these reasons and more, I don’t expect silver to stay this cheap for much longer. The final missing piece is a decisive technical breakout—one that propels silver into escape velocity. And as we speak, it may already be in the early stages of doing just that.
About the author