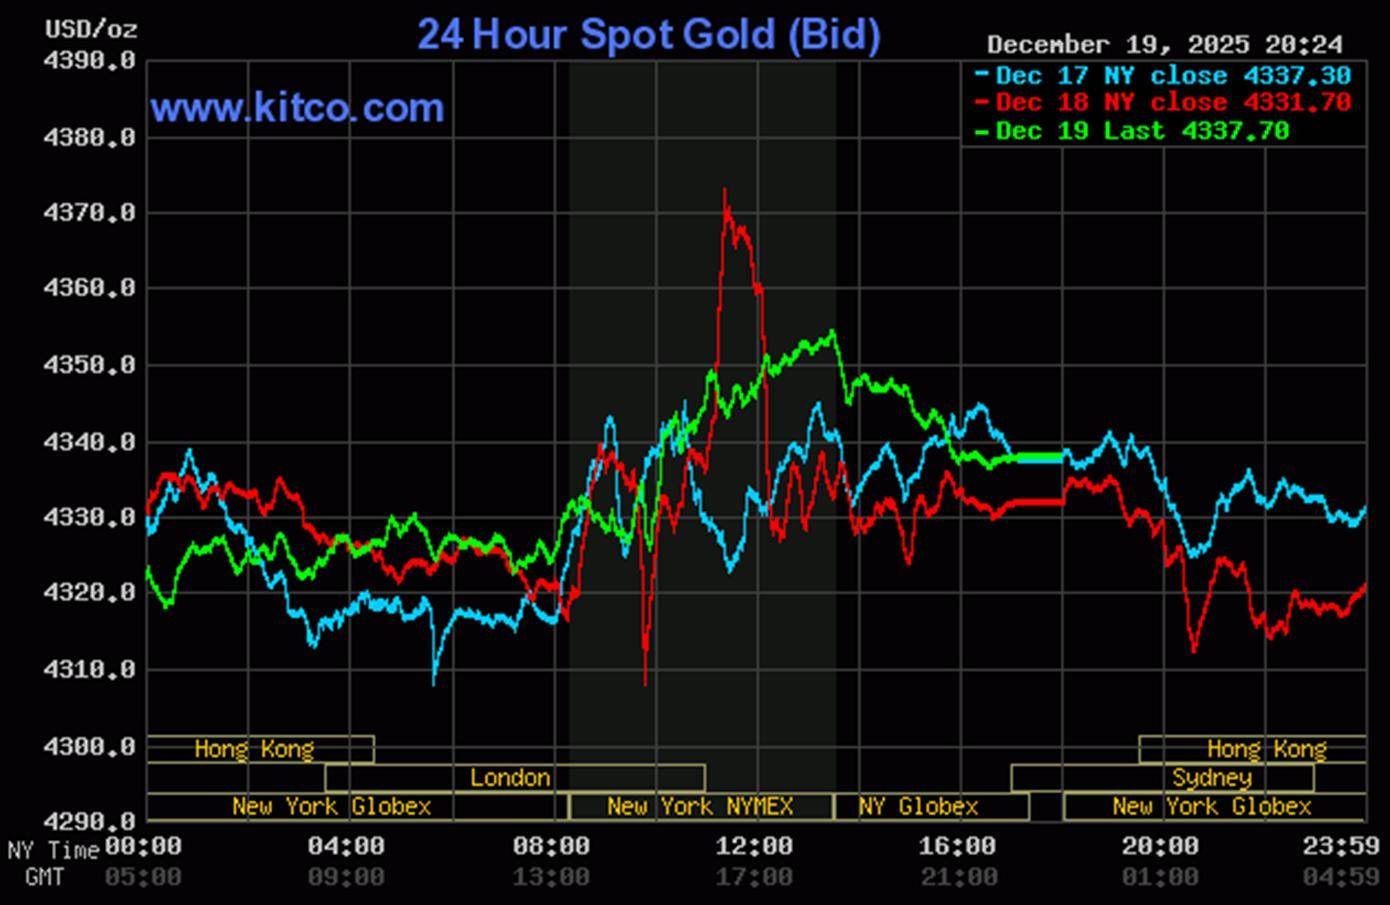
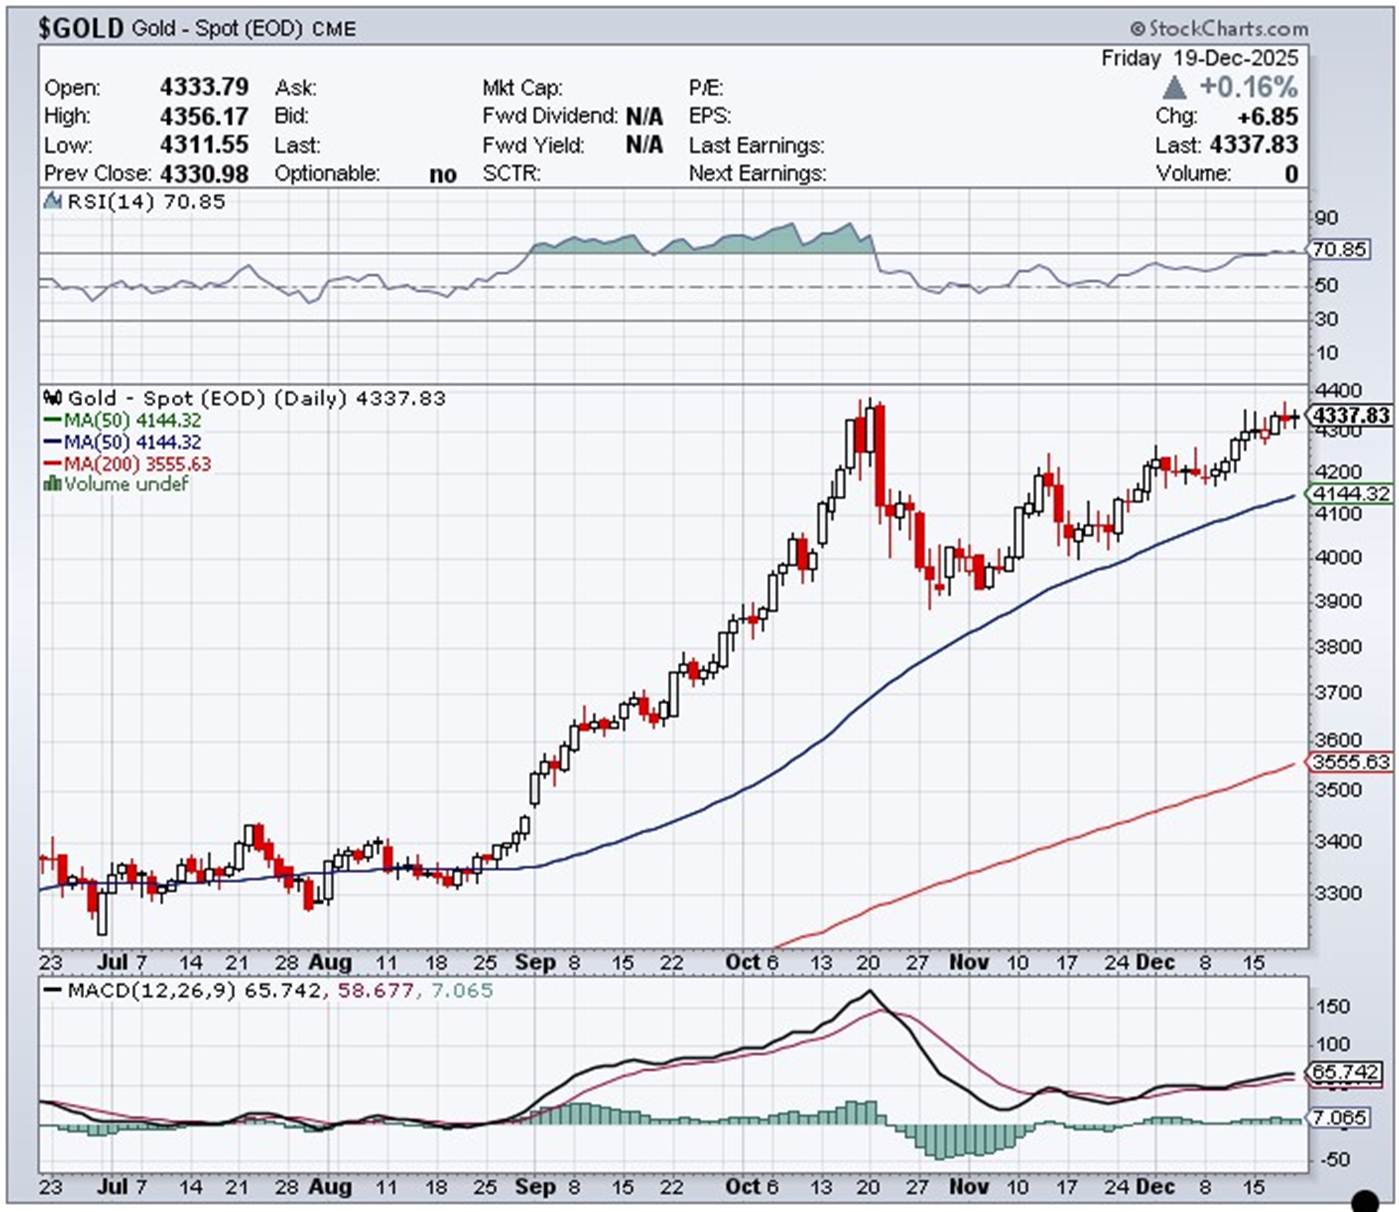
'Da boyz' stepped on the gold price an hour after Globex trading began in New York on Thursday evening -- and they set its low tick of the day around 9:45 a.m. China Standard Time on their Friday morning. It then struggled quietly, broadly and unevenly higher from that juncture until it really began to sail starting at 9:45 a.m. in COMEX trading in New York. The collusive commercial traders of whatever stripe reappeared seconds before the 1:30 p.m. COMEX close...engineering it lower anew until around 3:45 p.m. EST in after-hours trading. It didn't do anything after that.
The low and high ticks in gold were reported as $4,336.30 and $4,389.00 in the February contract...an intraday move of $52.70 an ounce. The December/ February price spread differential in gold at the close in New York yesterday was $25.90...February/April was $31.50...April/June was $31.80 -- and June/ August was $31.70 an ounce.
Gold was closed on Friday afternoon in New York at $4,337.70 spot...up $6.00 on the day -- and $17.80 off its Kitco-recorded high tick. Net volume was on the lighter side at a bit over 151,000 contracts -- and there were just about 15,000 contracts worth of roll-over/switch volume on top of that.
I saw that 1,065 gold, plus 144 silver contracts were traded in December yesterday and, as is always the case, it remains to be seen just how much of these amounts show up in tonight's Daily Delivery and Preliminary Reports further down in today's column.
![]()
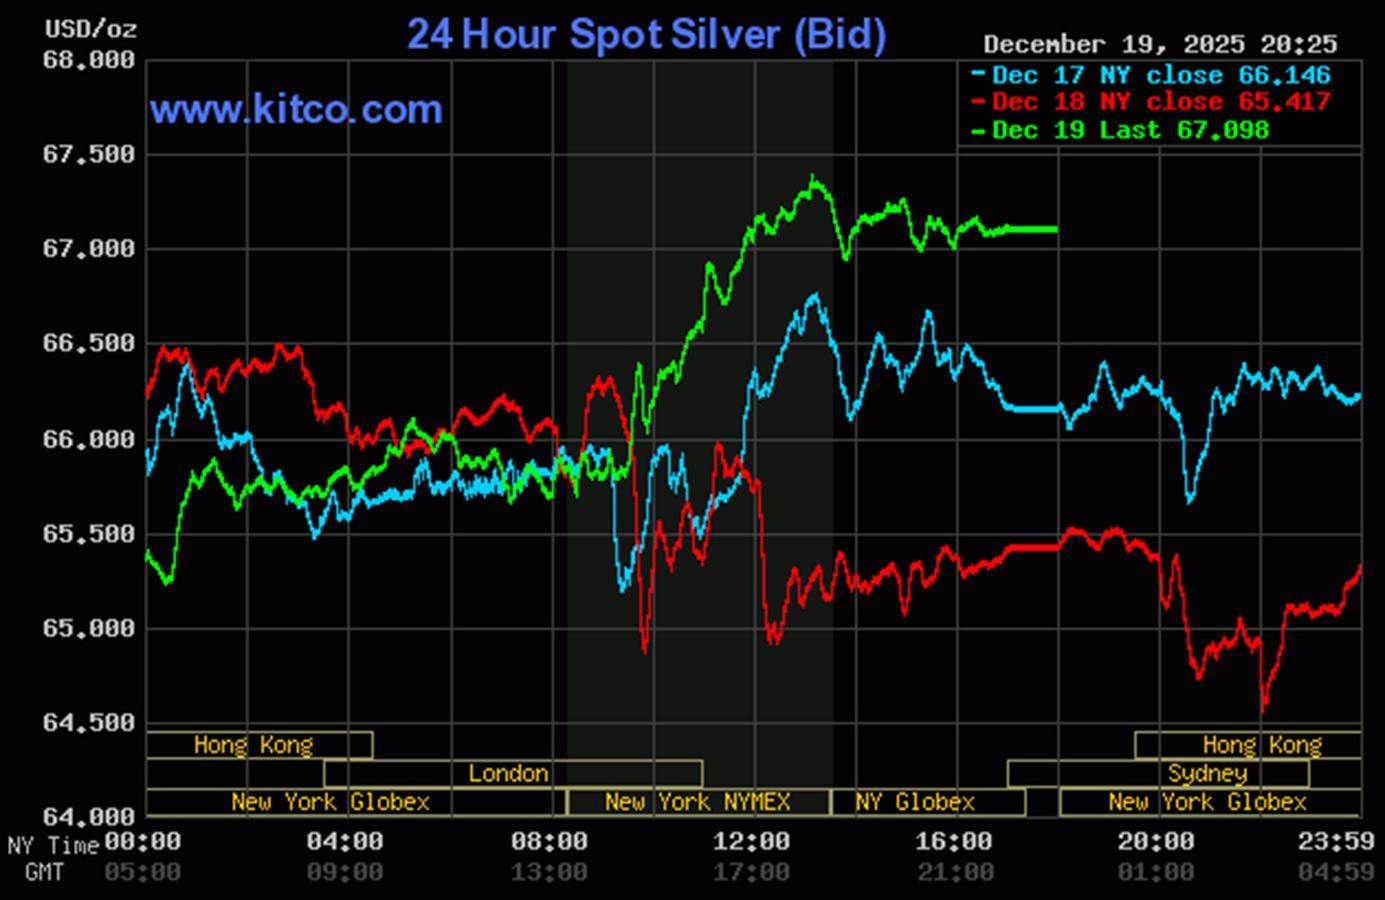
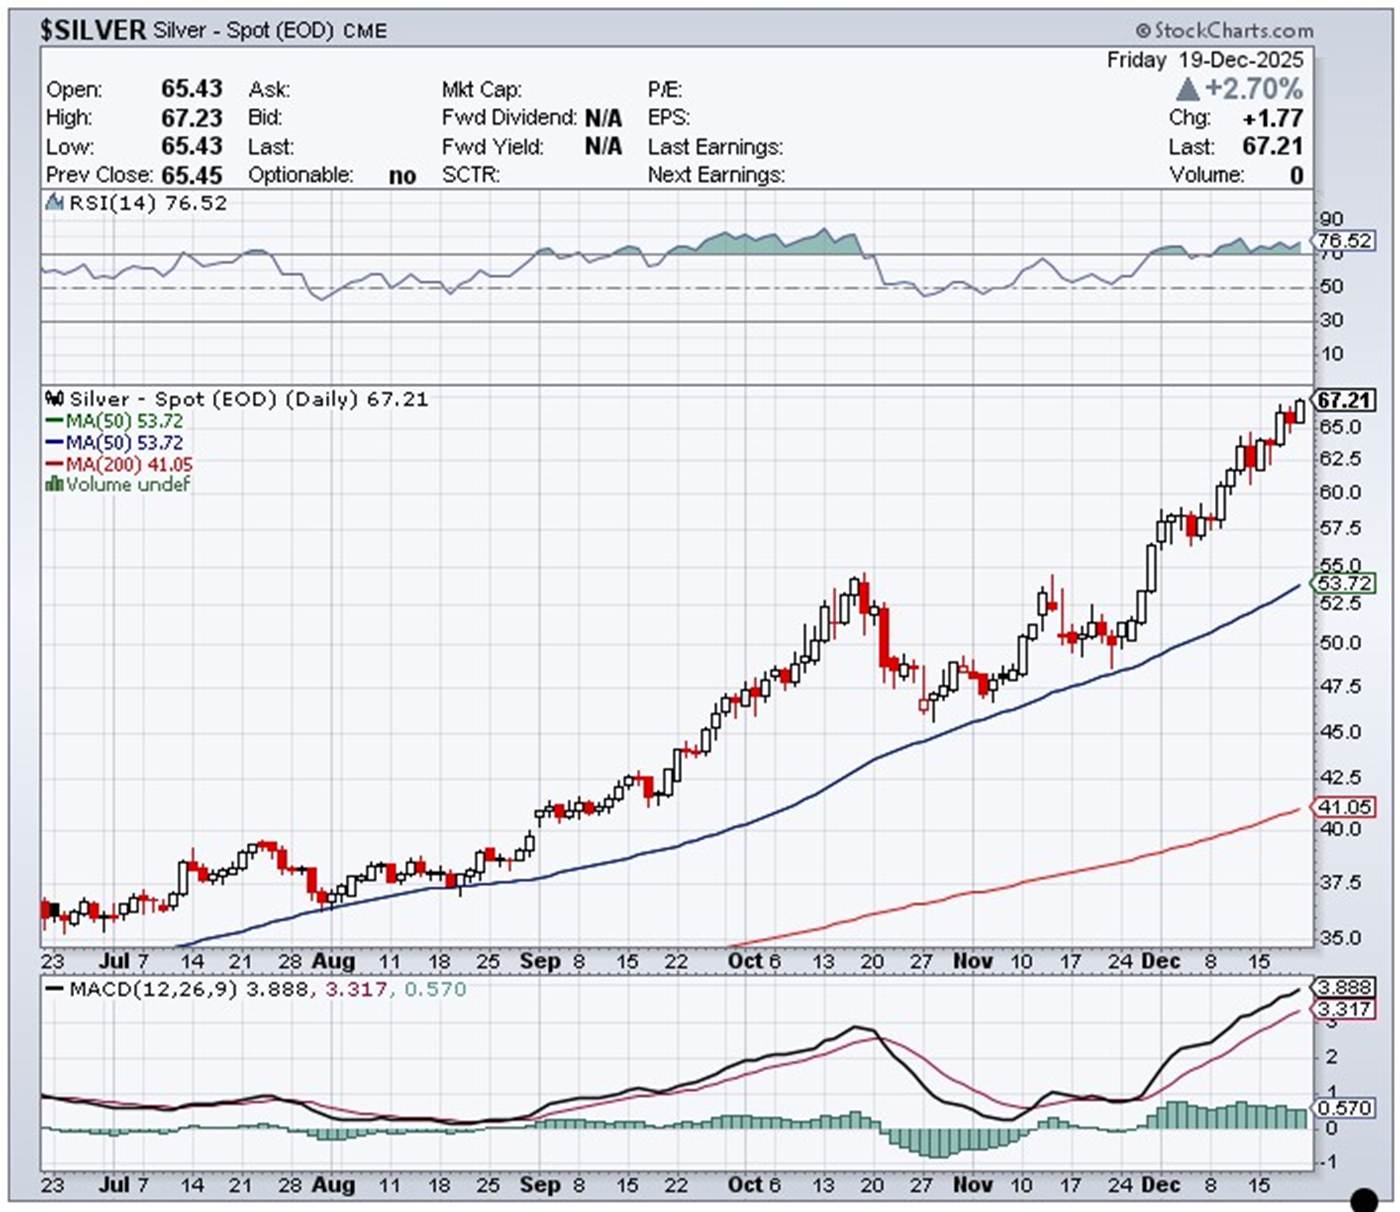
Silver was engineered two sharp steps lower starting at 9:00 a.m. China Standard Time on their Friday morning -- and then took two equally sharp steps higher until at or minutes after the 2:15 p.m. afternoon gold fix in Shanghai. It then wandered broadly, quietly and a bit unevenly sideways until it erupted higher starting a minute or so before the equity markets opened in New York. That rally ran into 'resistance' on a number of occasions before it was capped and turned lower for the final time around 1:05 p.m. EST. It was then forced to chop quietly sideways until trading ended at 5:00 p.m. EST.
The engineered low and high ticks in silver were recorded by the CME Group as $64.465 and $67.68 in the March contract...an intraday move of $3.215 an ounce. The December/March price spread differential in silver at the close in New York yesterday was a fairly hefty 64.4 cents...March/May was 51.0 cents ...May/July was 49.0 cents -- and July/September was 41.7 cents an ounce.
Silver was closed in New York on Friday afternoon at $67.098 spot...up $1.68 on the day -- and only 28 cents off its Kitco-recorded high tick. Net volume was pretty heavy at about 88,500 contracts -- and there were around 8,100 contracts worth of roll-over/switch volume in this precious metal.
![]()
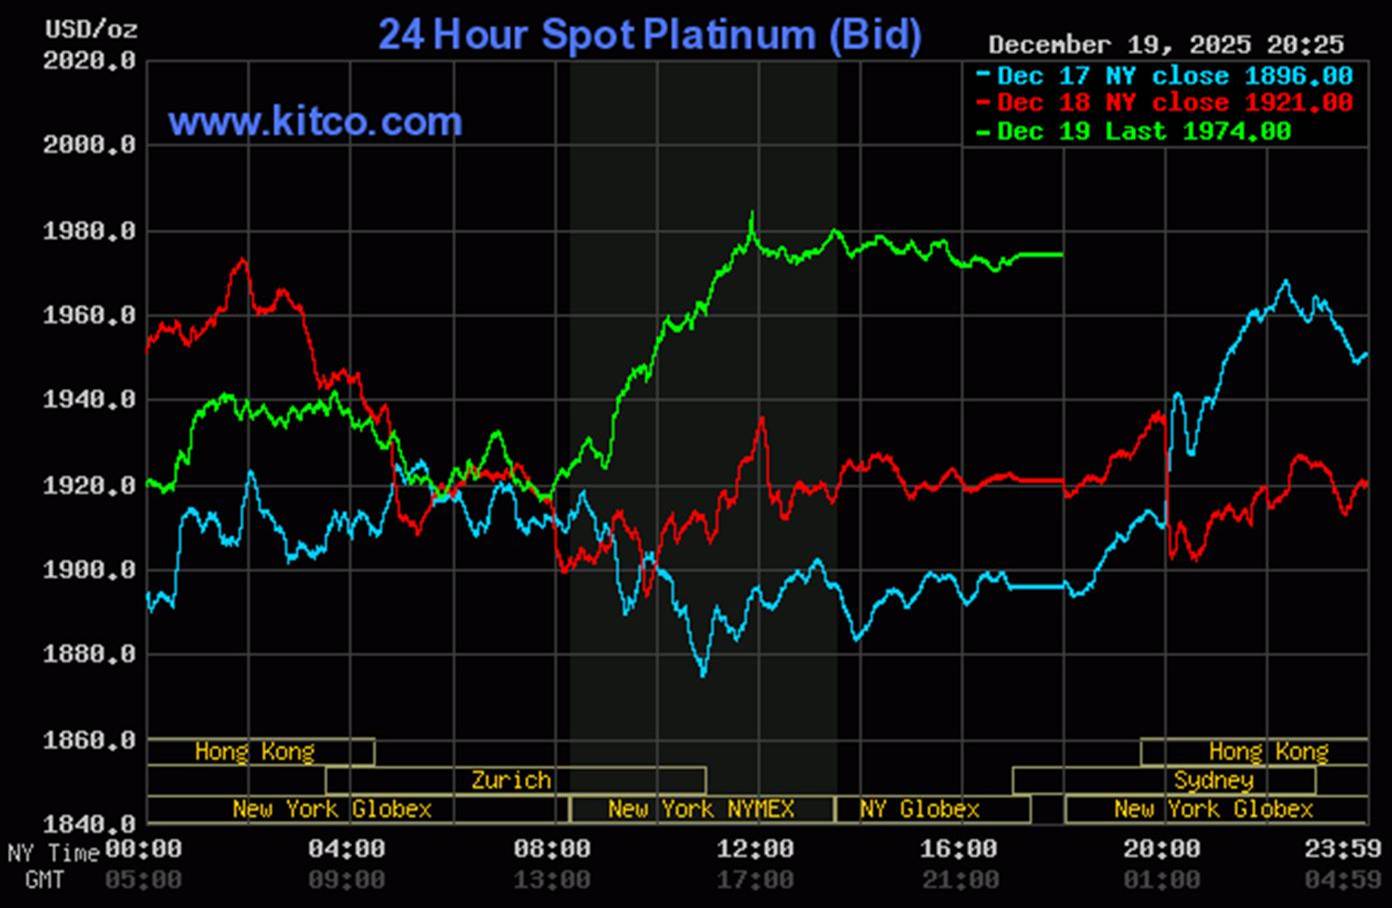
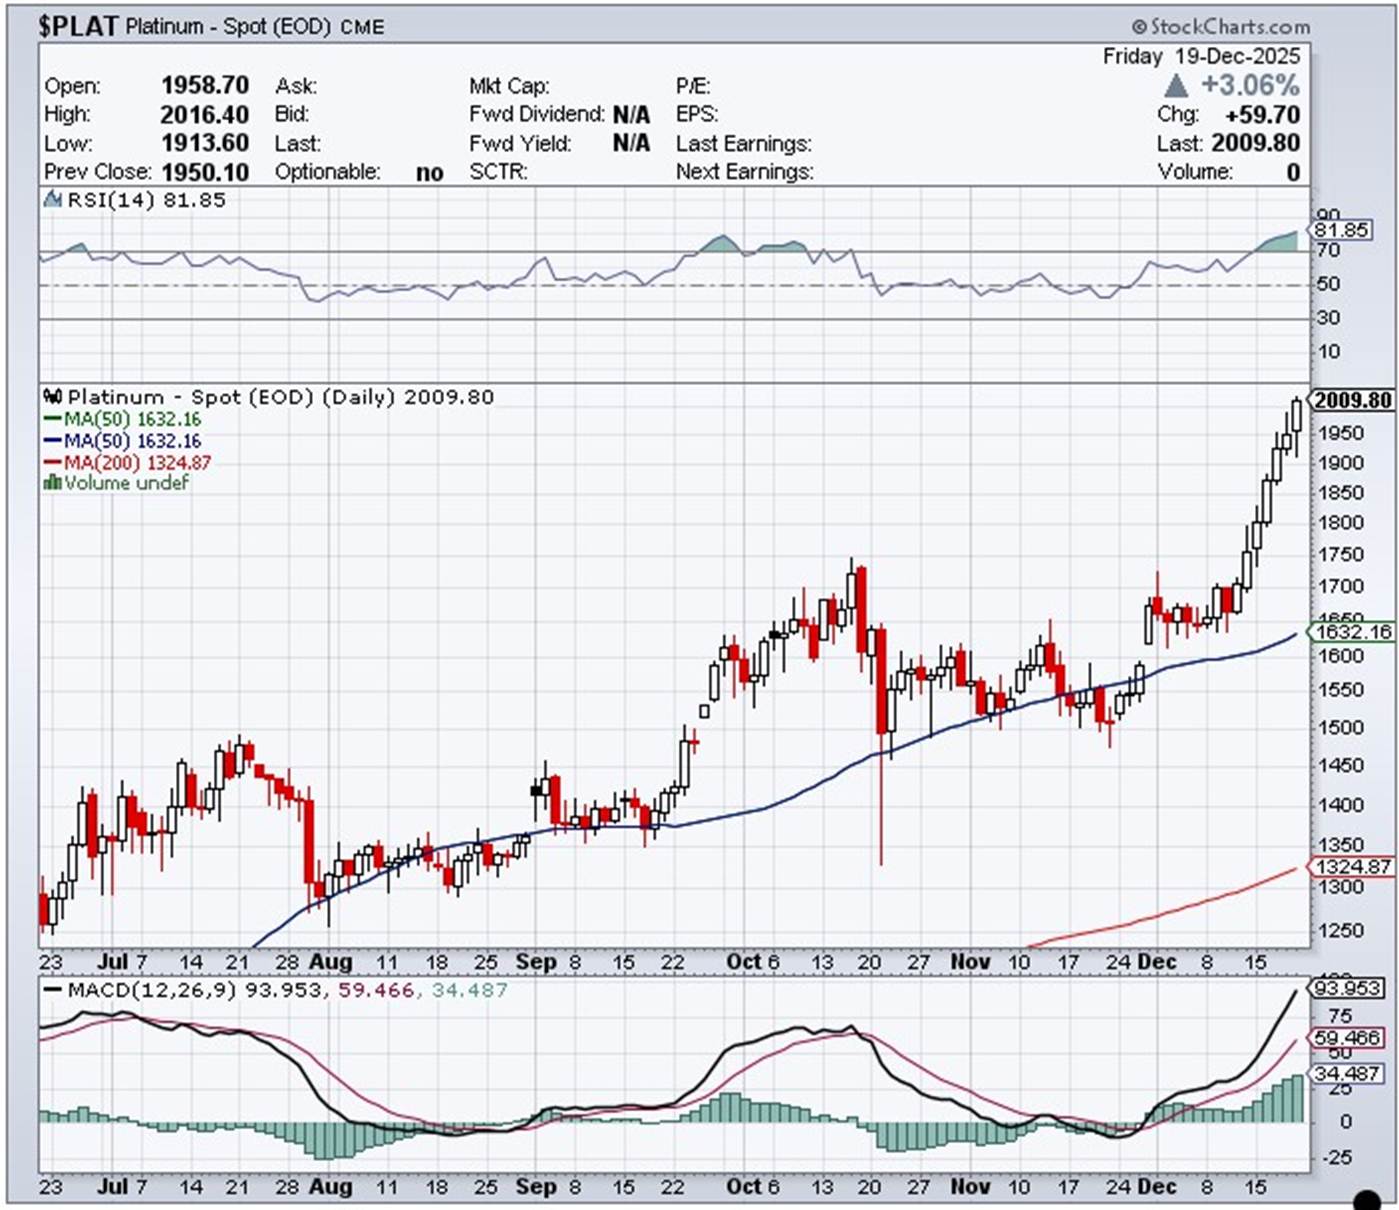
Platinum's rally during the first two hours of Globex trading on Thursday evening in New York also hit a big 'air pocket' at the 9:00 a.m. Shanghai open on their Friday morning -- and its broad and very uneven up/down move from there ending at 2 p.m. CET in Zurich/8 a.m. EST in New York. It then took off higher. 'Da boyz' stepped in hard minutes before 12 o'clock noon in COMEX trading -- and shortly after that, it wandered quietly sideways for the rest of the Friday session. Platinum was closed at $1,974.00 spot...up a further 53 dollars -- and 12 bucks off its Kitco-recorded high tick.
![]()
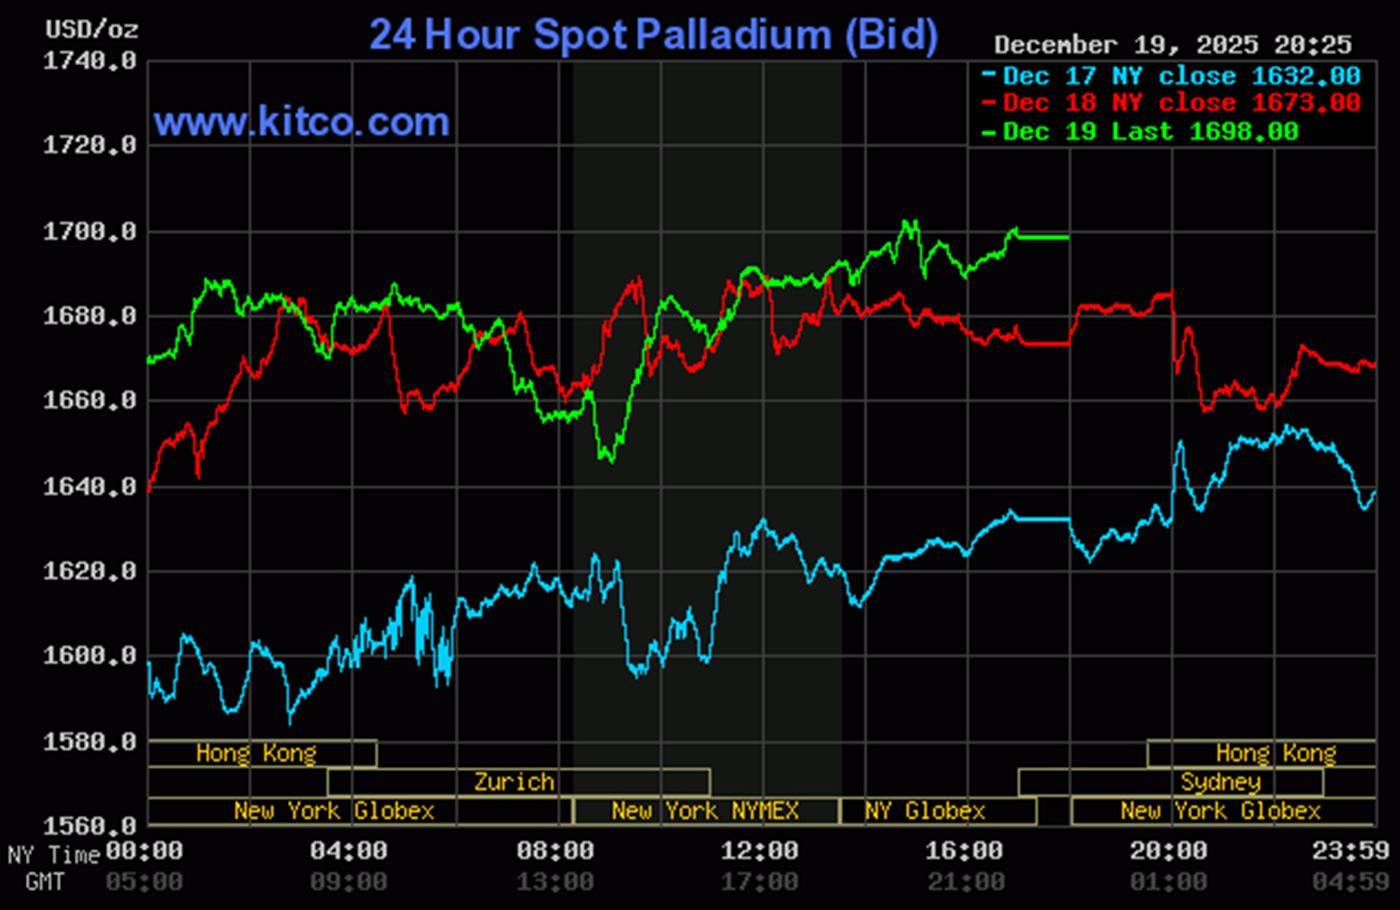
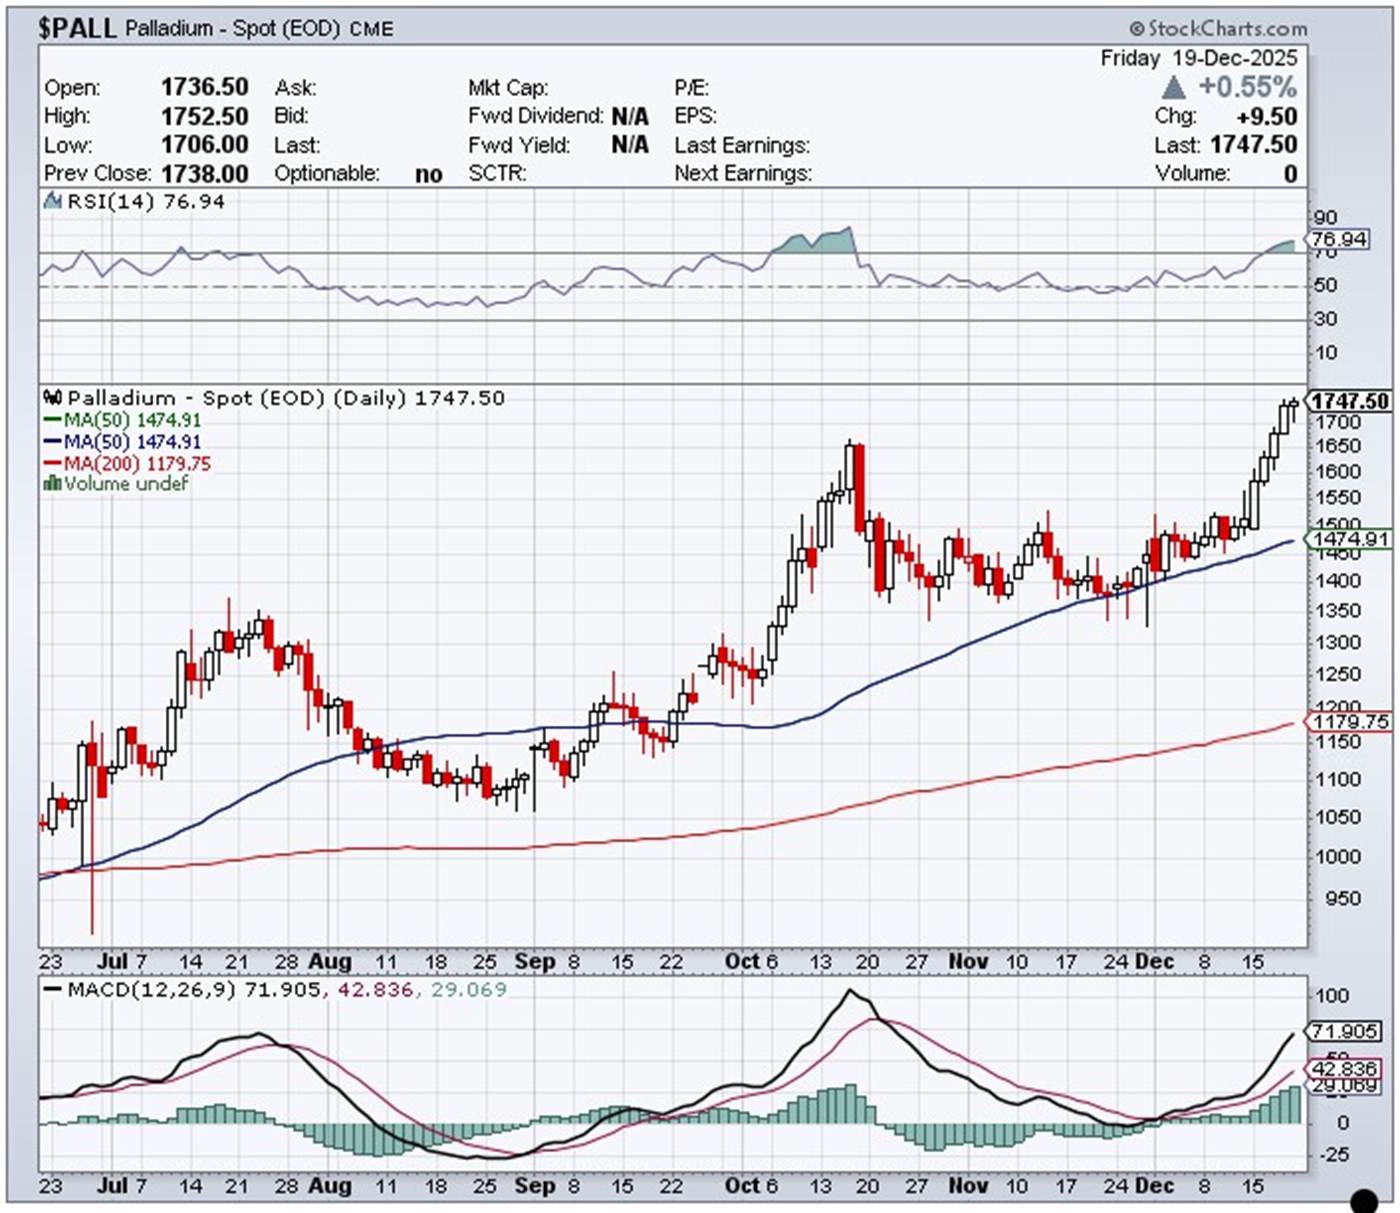
Palladium hit the same 'air pocket as platinum at the Shanghai open on their Friday morning. It then had a very broad and descending up/down move until its low tick of the day was printed around 9 a.m. in COMEX trading in New York. It then struggled higher until shortly before 3 p.m. in the very thinly-traded after-hours market -- and had a quiet and uneven down/up move from that juncture until trading ended. Palladium was closed at $1,698 spot...up 25 dollars on the day -- and 5 bucks off its Kitco-recorded high tick.
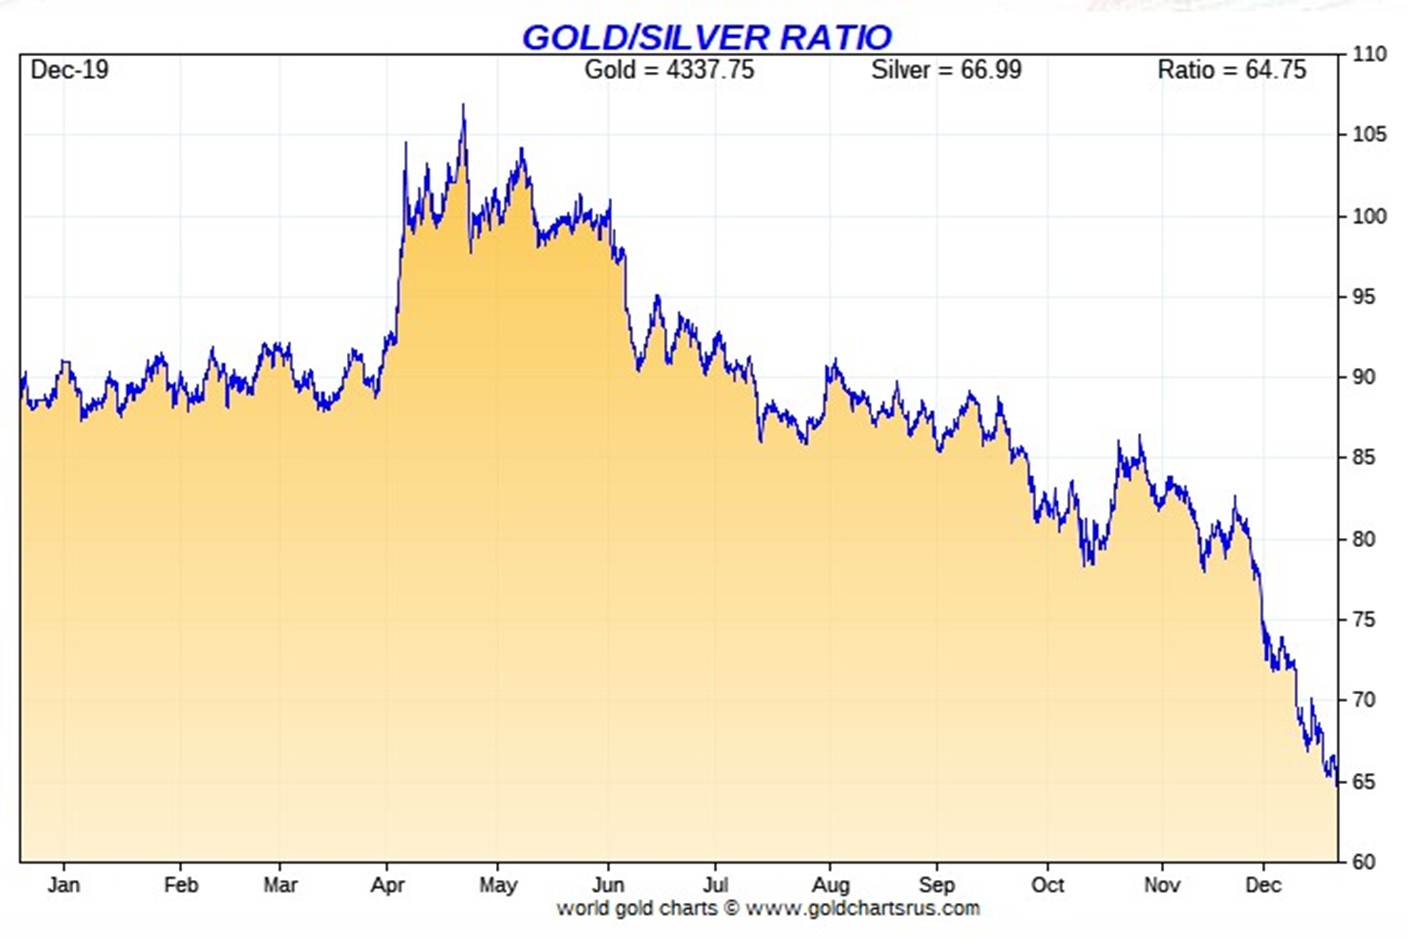
Based on the kitco.com spot closing prices in silver and gold posted above, the gold/silver ratio worked out to 64.6 to 1 on Friday...compared to 66.2 to 1 on Thursday.
Here's the 1-year Gold/Silver Ratio chart from Nick -- and updated with this past week's data. Click to enlarge.
![]()
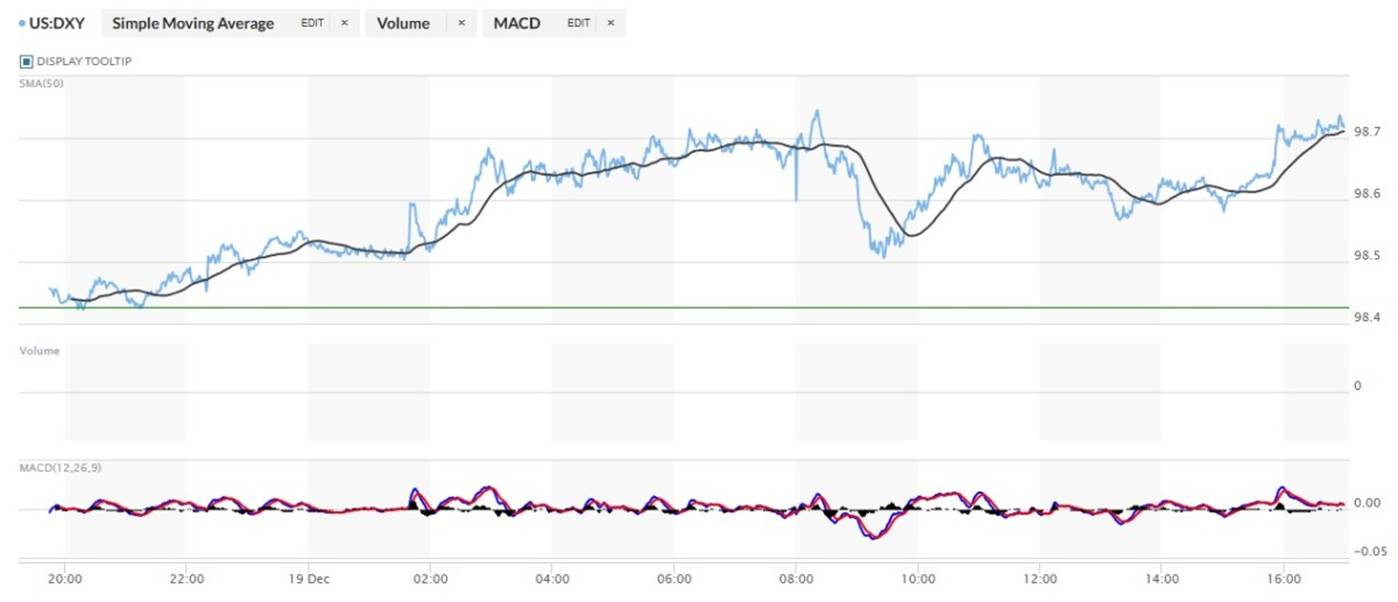
The dollar index closed very late on Thursday afternoon in New York at 98.43 -- and then opened higher by 3 basis points once trading commenced at 7:45 p.m. EST on Thursday evening...which was 8:45 a.m. China Standard Time on their Friday morning. It touched the unchanged mark a couple of times before heading unevenly higher starting at 10:15 a.m. CST -- and ending at its 8:20 a.m. COMEX open high tick in New York. It was then sold lower until 9:26 a.m. EST -- and then took two broad and somewhat uneven steps higher until the market closed at 5:00 p.m.
The dollar index finished the Friday trading session in New York at 98.72...up 29 basis points from its close on Thursday.
Here's the DXY chart for Friday...thanks to marketwatch.com as usual. Click to enlarge.

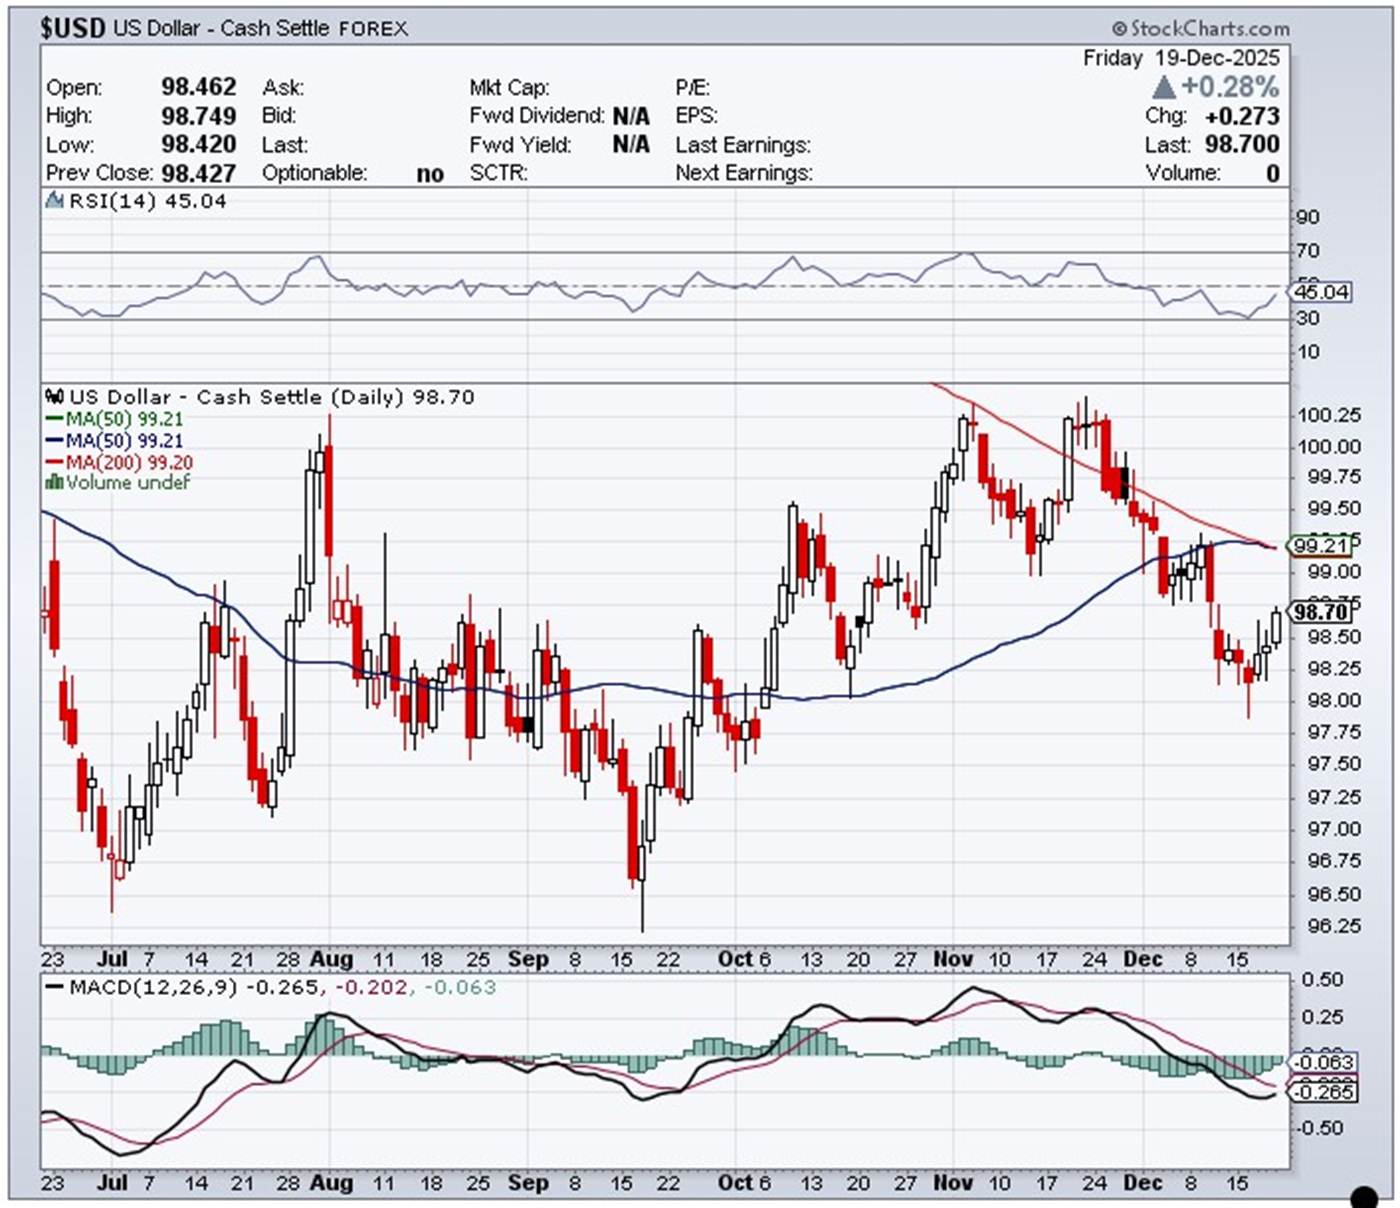
Here's the 6-month U.S. dollar index chart...courtesy of stockcharts.com as always. The delta between its close...98.70...and the close on DXY chart above, was 2 basis points below that. Click to enlarge.
![]()
Once again, the machinations in the dollar index -- and what was going on in the precious metals sector, were totally unrelated.
U.S. 10-year Treasury: 4.1510%...up 0.0350/(+0.8503%)...as of the 1:59:54 p.m. CST close
The Fed spent most of the Friday session ensuing that the ten-year yield didn't close any higher than it did.
For the week, the ten-year closed lower by 4.3 basis points -- and only did so because of the continuing intervention by the Fed.
Here's the 5-year 10-year U.S. Treasury chart from the yahoo.com Internet site -- which puts the yield curve into a somewhat longer-term perspective. Click to enlarge.
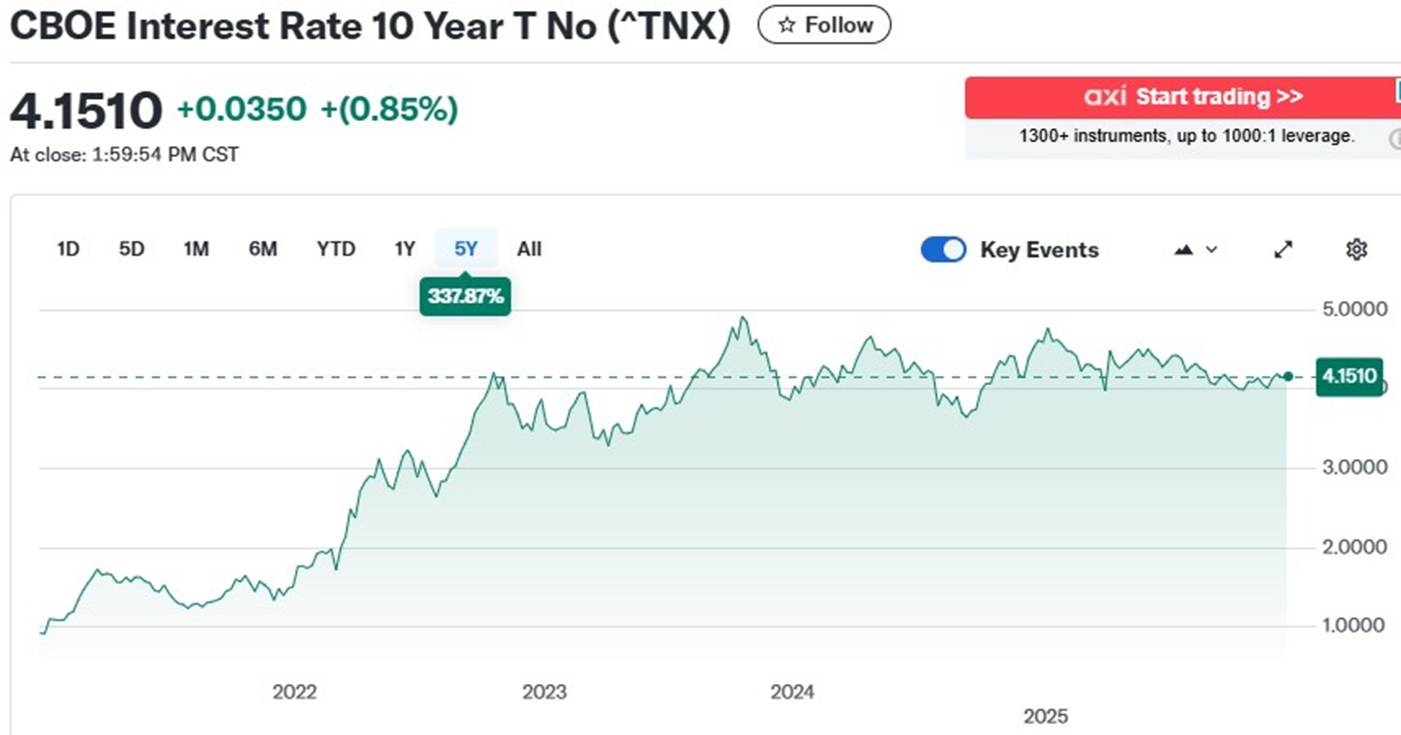
The 10-year hasn't been allowed to trade above its 4.92% high tick set back on October 15, 2023...but I still suspect that we've seen the 3.9482% low for this cycle...which was set back on October 22 of this year. The Fed did cut the rate last Wednesday, as expected -- and has been hard at work controlling its yield since then. More rate cuts in 2026 are expected...as is the return of QE.
![]()
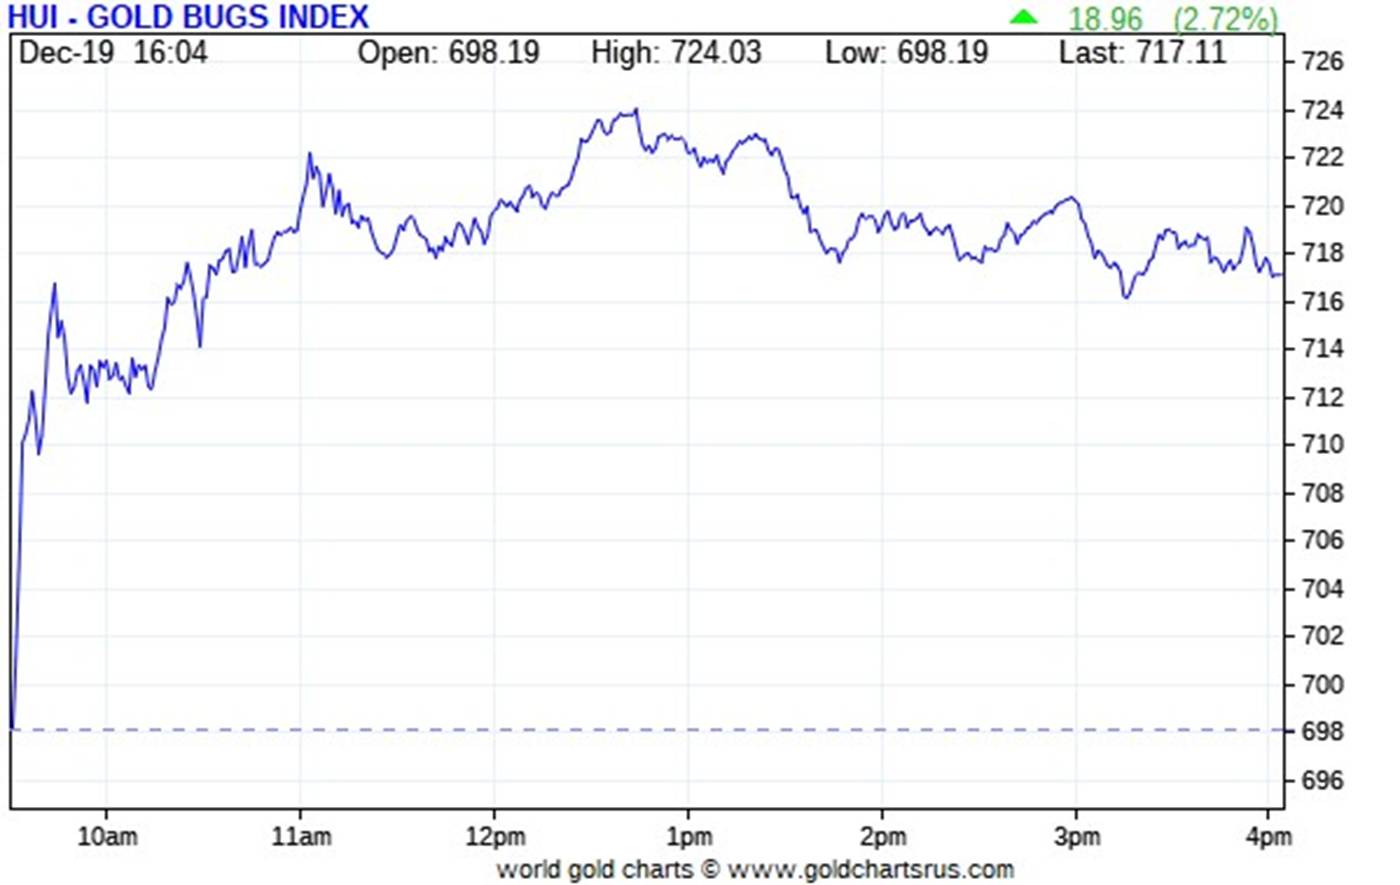
The gold shares jumped higher at the 9:30 opens of the equity markets in New York on Friday morning -- and then continued to chop higher until 12:45 p.m. EST. They then chopped quietly lower until trading ended at 4:00 p.m. The HUI closed higher by 2.72 percent.
![]()
I was surprised that the gold stocks topped out when they did, as gold was in rally mode until 'da boyz' appeared minutes before the 1:30 p.m. COMEX close about forty-five minutes later.
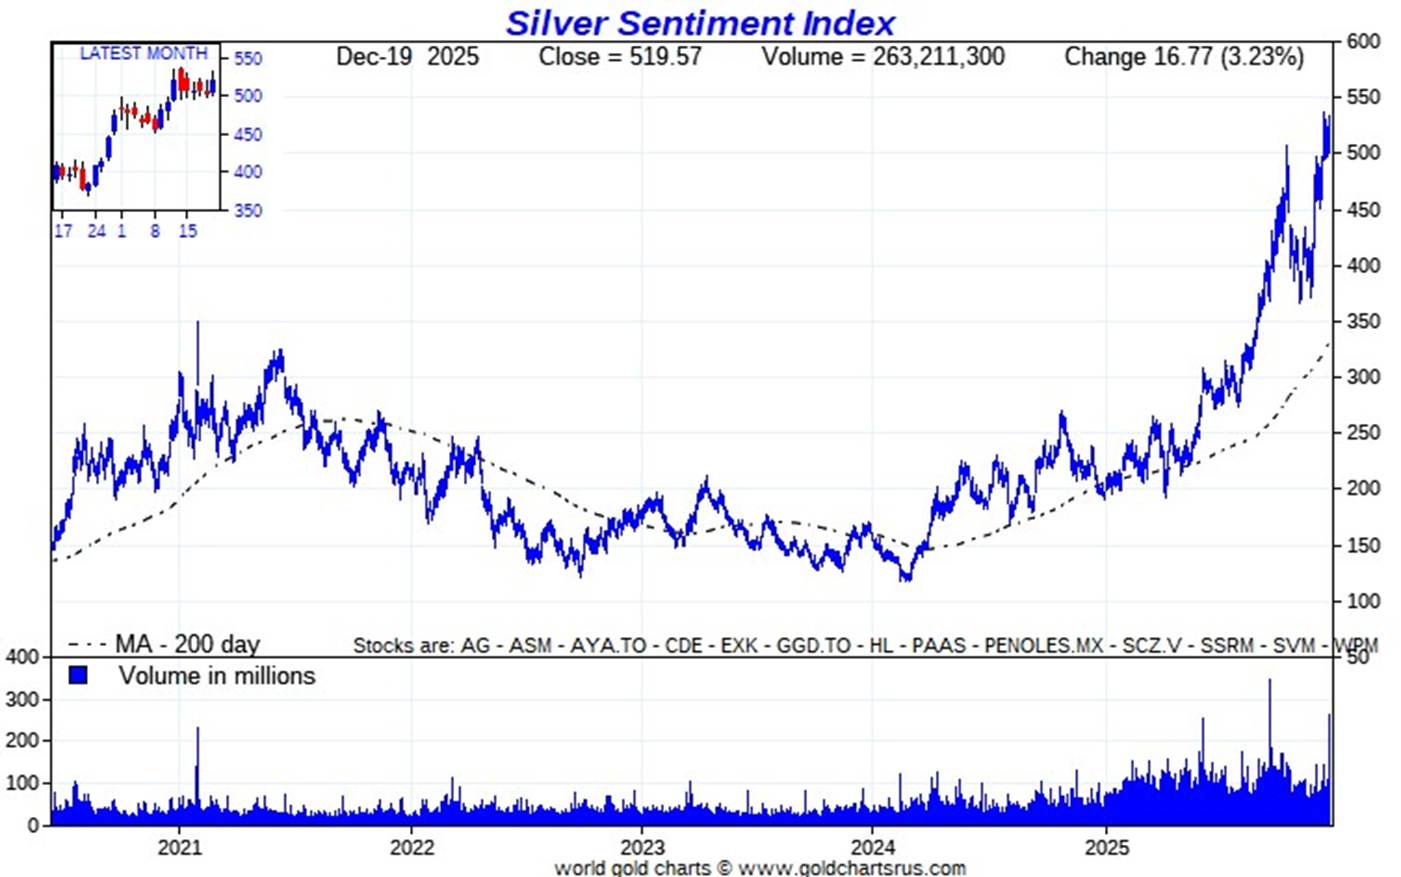
The silver equities jumped up even more at the New York opens -- and topped out minutes after the 11 a.m. EST London close when 'da boyz' stepped on the silver price briefly. Despite the fact that silver continued to rally until around 1:05 p.m. EST, the silver stocks didn't do much until they began to chop lower starting at 1:25 p.m. And despite silver's big gain -- and close above $67 spot for the first time, Nick Laird's Silver Sentiment Index only closed higher by 3.23 percent.
I thought I'd toss in Nick's long-term Silver Sentiment Index chart this time, just so you get a more macro view of what's happening. Click to enlarge.
![]()
The absolute and unlikely star was Peñoles, as it closed higher by 8.31 percent. In second and third spots were Coeur and Hecla Mining, closing up 6.60 and 5.41 percent respectively. It's hard to believe that a silver stock closed down on the day....but GoGold Resources managed that feat...closing lower by 1.41 percent on 7x daily volume.
The almost instantaneous response to my e-mail to Steve Low at the company, elicited these comments..."The Van Eck, GDXJ junior miners ETF was doing a quarterly rebalance today and GoGold was affected by that. Discovery Silver was another one of the stocks that had a huge volume into the close, among others. There’s no news or nothing happened otherwise...and I’m sure we’ll see some value traders in here on Monday."
There was no other news on any of the thirteen silver companies that comprise the above Silver Sentiment Index.
The silver price premium in Shanghai over the U.S. spot price on Friday was 3.42 percent.
The reddit.com/Wallstreetsilver website, now under 'new' and somewhat improved management, is linked here. The link to two other silver forums are here -- and here.
![]()
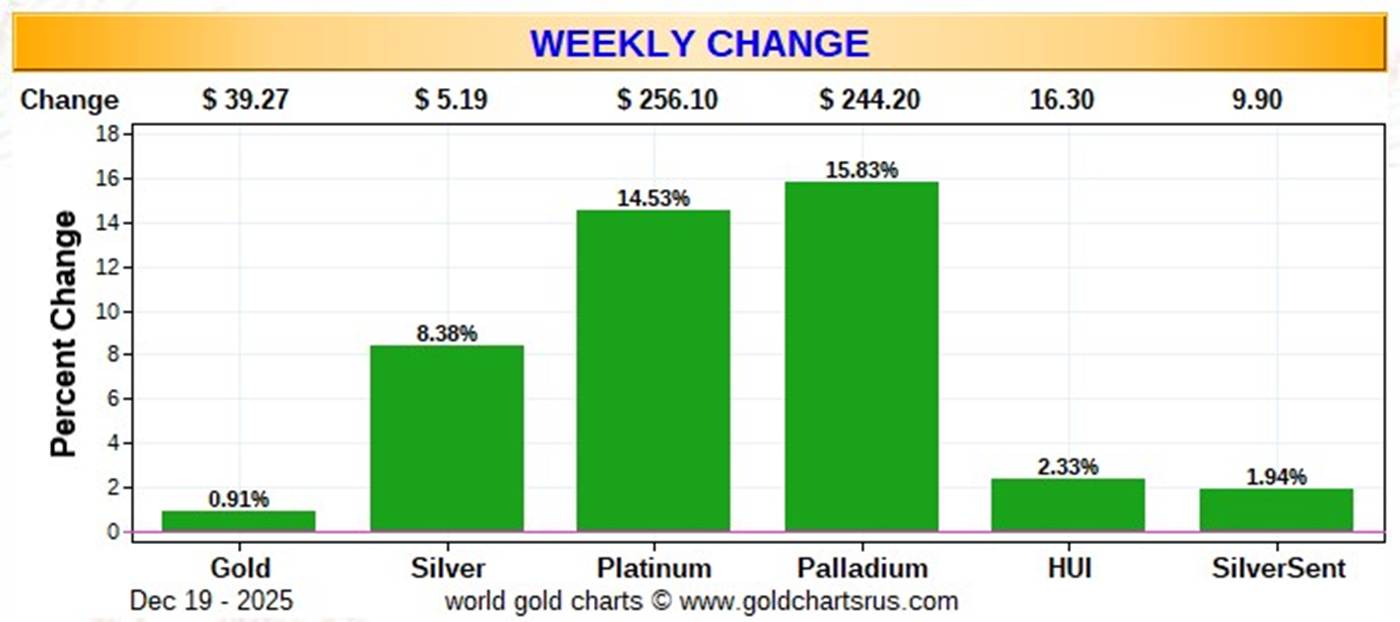
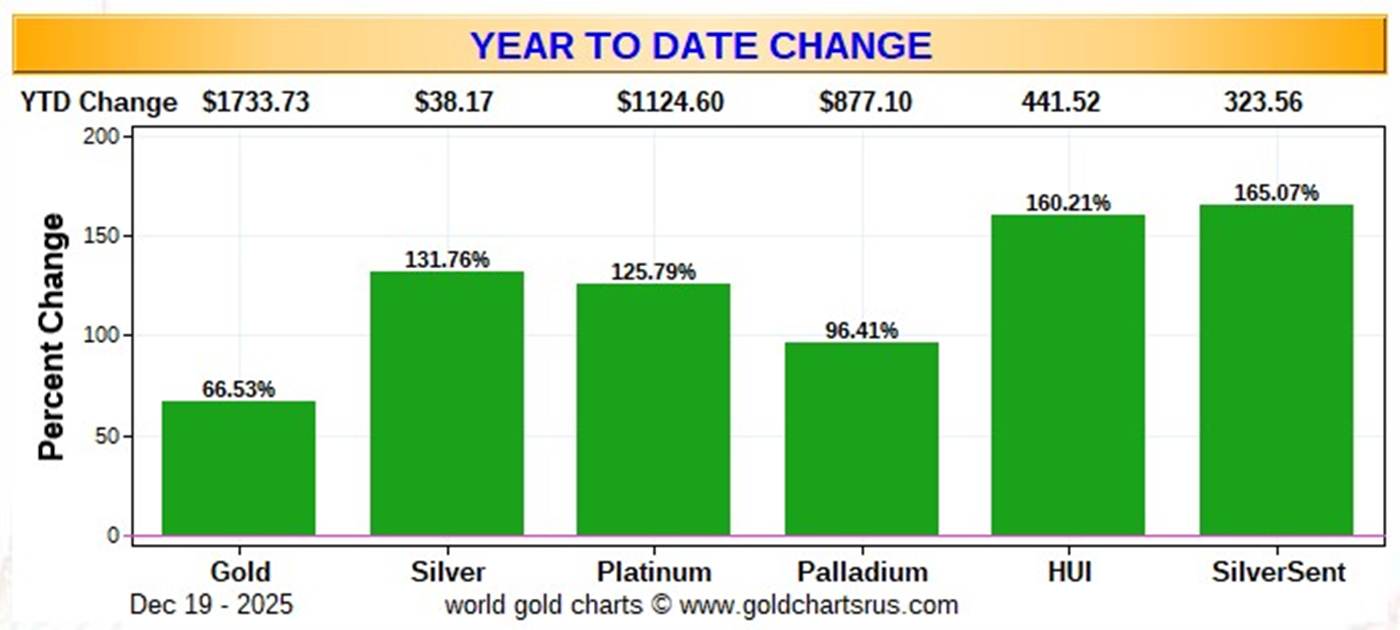
Here are the usual three charts that appear in this spot in every weekend missive. They show the changes in gold, silver, platinum and palladium in both percent and dollar and cents terms, as of their Friday closes in New York — along with the changes in the HUI and the Silver Sentiment Index.
Here's the weekly chart -- and the brutal underperformance of the silver stocks vs. it underlying precious metal is stark. The big rallies in platinum and palladium are the other two standout features on this chart. Click to enlarge.
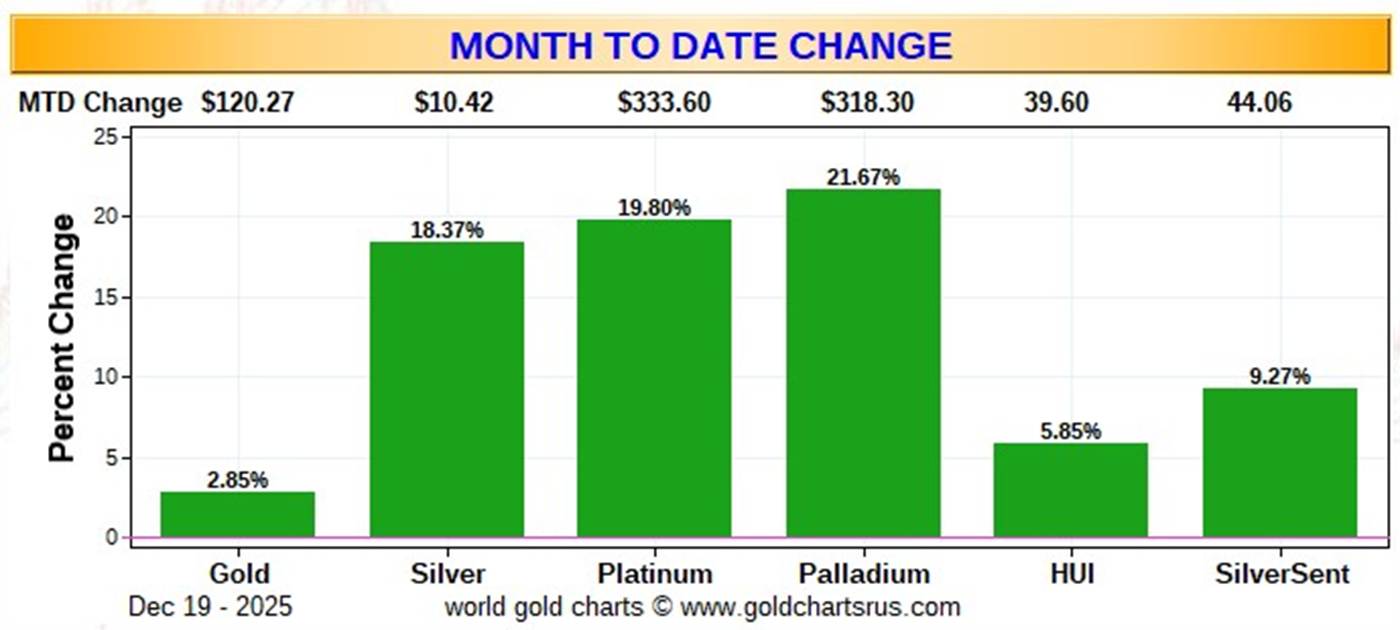
Here's the month-to-date chart -- and the ongoing underperformance of the silver shares vs. the silver price is the standout feature here as well. The underperformance of gold is also very noticeable -- and I'm surprised that it's been left this far behind the other three precious metals. Click to enlarge.
Here's the year-to-date chart -- and even though the silver price has outperformed the gold price by 2x on a relative basis year-to-date, its associated equities are barely ahead of the gains in the HUI. I didn't think that would be possible...but the chart doesn't lie. The silver equities should be priced about 150 percentage points higher than they are now to be equal to the gains in the gold equities vs. the gold price itself year-to-date. That would put the Silver Sentiment Index at around 315...compared to the 165 its sitting at now. Click to enlarge.
Despite the fact that silver has now broken the $67 barrier -- and the silver well in London is running close to empty...with very elevated lease rates...the gold/silver ratio remains at a farcical 64.6 to 1 as of the Friday's close. The 'normal' and historical ratio is around 15 to 1...which would put silver at about $289. And if priced at the ratio of 7:1 that it comes out of the ground at, compared to gold...that would put silver at around $620 an ounce. So a triple-digit silver price is in our future -- and all that remains to be resolved is what that number will be -- and how soon 'da boyz' allow it to happen.

The CME Daily Delivery Report for Day 17 of December deliveries showed that 728 gold, plus only 54 silver contracts were posted for delivery within the COMEX-approved depositories on Tuesday.
In gold, the only short/issuer that mattered was JPMorgan, issuing 726 contracts out of its client account. There were seven long/stoppers in total -- and the three largest by far were Wells Fargo Securities, British bank Barclays and JPMorgan...picking up 429, 170 and 116 contracts respectively...Wells Fargo for their house account.
In silver, the two short/issuers were Advantage and JPMorgan, issuing 36 and 18 contracts out of their respective client accounts. The only long/stopper that mattered was Wells Fargo Securities, picking p 46 contracts for its house account.
In palladium, there were 25 contracts issued and stopped.
The link to yesterday's Issuers and Stoppers Report is here.
Month-to-date there have been 35,300 gold contracts issued/reissued and stopped -- and that number in silver is an amazing 12,548 COMEX contracts/ 62.740 million troy ounces. In platinum, it's only 17 contracts -- and in palladium it's 651.
Back on First Day Notice for December deliveries on November 26, there were 26,946 gold contracts still open -- and that number in silver was 9,866 COMEX contracts. So it's obvious that the rush for physical metal remains 'rapacious' ...as there have been considerable contracts added to the December delivery month every single business day since then.
The CME Preliminary Report for the Friday trading session showed that gold open interest in December increased by 12 contracts, leaving 1,419 still around...minus the 728 contracts out for delivery on Tuesday as per the above Daily Delivery Report. Thursday's Daily Delivery Report showed that 917 gold contracts were actually posted for delivery on Monday, so that means that 917+12=929 more gold contracts were added to the December delivery month.
Silver o.i. in December declined by 49 contracts, leaving 160 still open... minus the 54 contracts out for delivery on Monday as mentioned a bunch of paragraphs ago. Thursday's Daily Delivery Report showed that 120 silver contracts were actually posted for delivery today, so that means that 120-49=71 more silver contracts were added to the December delivery month.
Total gold open interest in the Preliminary Report on Friday night increased by 6,450 COMEX contracts. Total silver o.i. rose by 2,217 COMEX contracts...which is not a lot in either, considering the price move in the latter.
[I checked the final total open interest number for gold for Thursday -- and it showed the huge hoped-for decline...from +19,233 contracts, down to +6,422 COMEX contracts. Final total silver o.i. for Thursday also fell, from +2,435 COMEX contracts...down to +1,431 contracts.]
Gold open interest inJanuary in the CME's Final Report on Friday morning declined by 134 contracts, leaving 3,629 still around -- but silver o.i. in January increased by 82 contracts, leaving 4,249 still open.
![]()
There were no reported changes in GLD for the second day in a row -- and there were 1,541,434 troy ounces of silver added to SLV.
The SLV borrow rate started the Friday session at 0.72% -- and closed at 0.68% ...with 8.2 million shares available to short by the end of the day. The GLD borrow rate began the day at 0.48% -- and finished it at 0.56%...with 6.9 million shares available.
In other gold and silver ETFs and mutual funds on Earth on Friday ...net of any changes in COMEX, GLD and SLV activity, there were a net 95,797 troy ounces of gold added...but a surprising 155,481 troy ounces of silver were removed.
And nothing from the U.S. Mint of course.
![]()
The only activity in gold over at the COMEX-approved depositories on the U.S. east coast on Thursday were the 64,237.686 troy ounces/1,998 kilobars that departed Brink's, Inc. Nothing was reported received. There was a bit of paper activity, as 22,473.549 troy ounces/699 kilobars were transferred from the Registered category and back into Eligible over at Manfra, Tordella & Brookes, Inc. The link to Thursday's COMEX gold activity is here.
There was pretty decent silver activity, as two truckloads/1,196,849 troy ounces arrived at Loomis International -- and a further 646,171 troy ounce of left JPMorgan.
There was huge paper activity, as 2,049,993 troy ounces were transferred from the Registered category and back into Eligible...1,307,255 troy ounces at Brink's, Inc...with the remaining 742,682 troy ounces making that same trip over at CNT. There were also 342,229 troy ounces transferred from the Eligible category and into Registered -- and that happened over at Asahi.
The link to all of Thursday's considerable COMEX silver action is here.
Nick sent out the charts for Switzerland's gold and silver imports, updated with November's data. I don't have room for them in today's column...Tuesday for sure...but here's are the numbers.
During that month, they imported 165.548 tonnes/5.323 million troy ounces of gold -- and exported 123.878 tonnes./3.983 million troy ounces. In silver, they imported 115.689 tonnes/3.720 million troy ounces -- and exported 266.376 tonnes/8.564 million troy ounces which, I suspect, all ended up in London.
Since the 20th of December fell on a Saturday this year, the good folks over at The Central Bank of the Russian Federation updated their website with November's data on Friday -- and it showed that there were no changes in their gold reserves that month. They still sit at 74.8 million troy ounces.
The Shanghai Futures Exchange updated their silver inventories as of the close of business on their Friday -- and it showed that a net 401,787 troy ounces/ 12.528 metric tonnes were removed... leaving their silver inventories at 28.924 million troy ounces/899.636 metric tonnes.
![]()
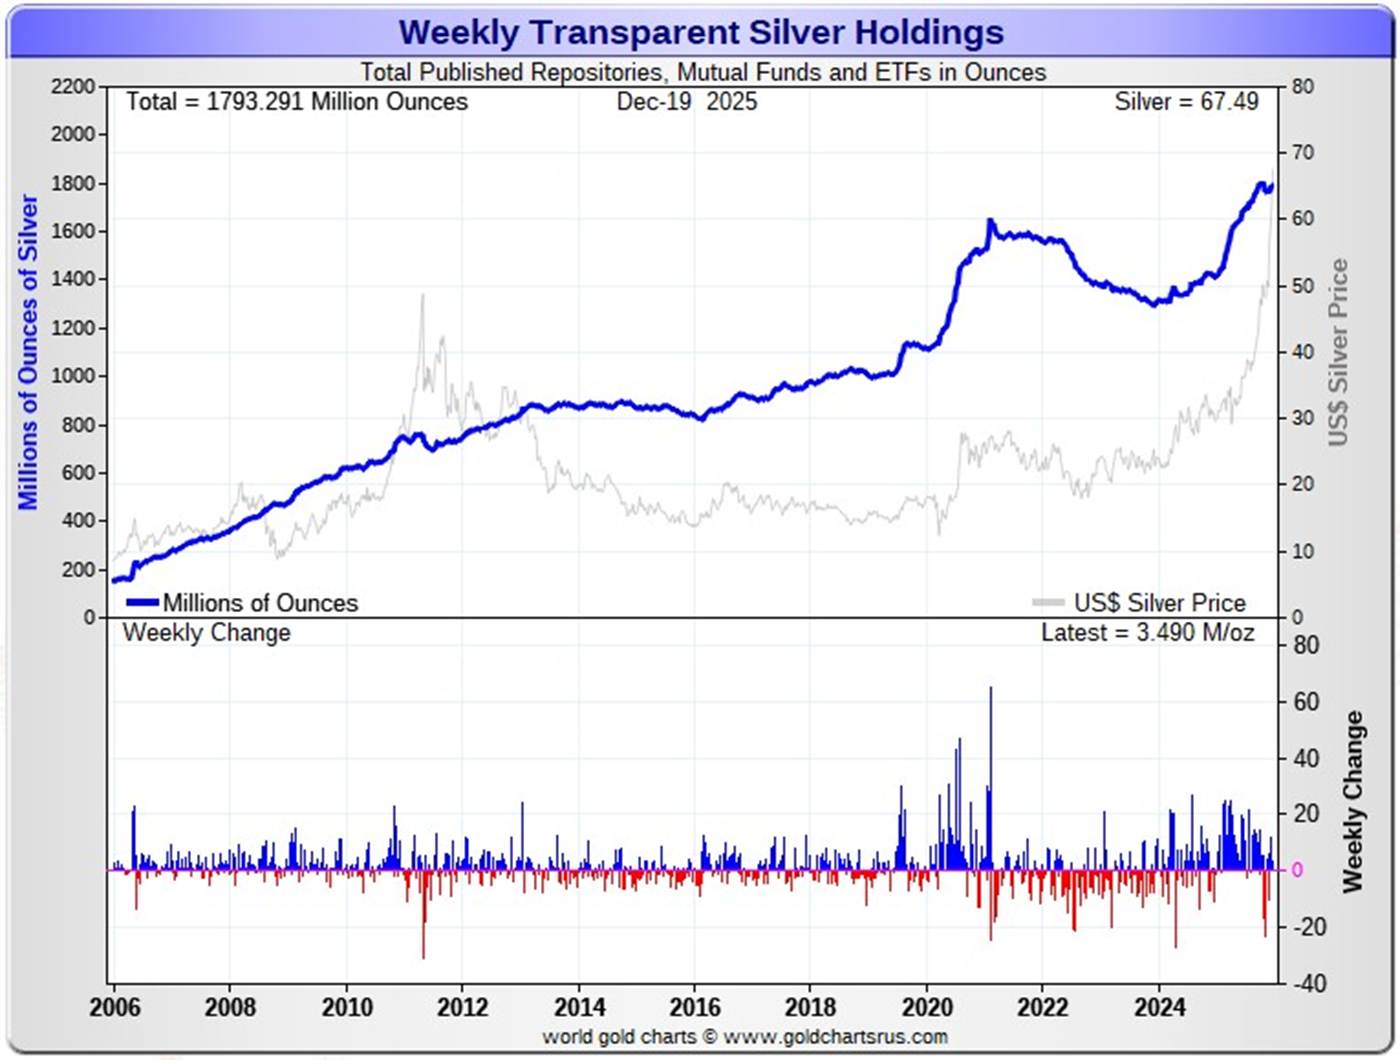
Here are the usual 20-year charts that show up in this space in every weekend column. They show the total amounts of physical gold and silver held in all known depositories, ETFs and mutual funds as of the close of business on Friday.
During the business week just past, there were a net 307,000 troy ounces of gold added -- and a net 3.490 million troy ounces of silverwere added as well.
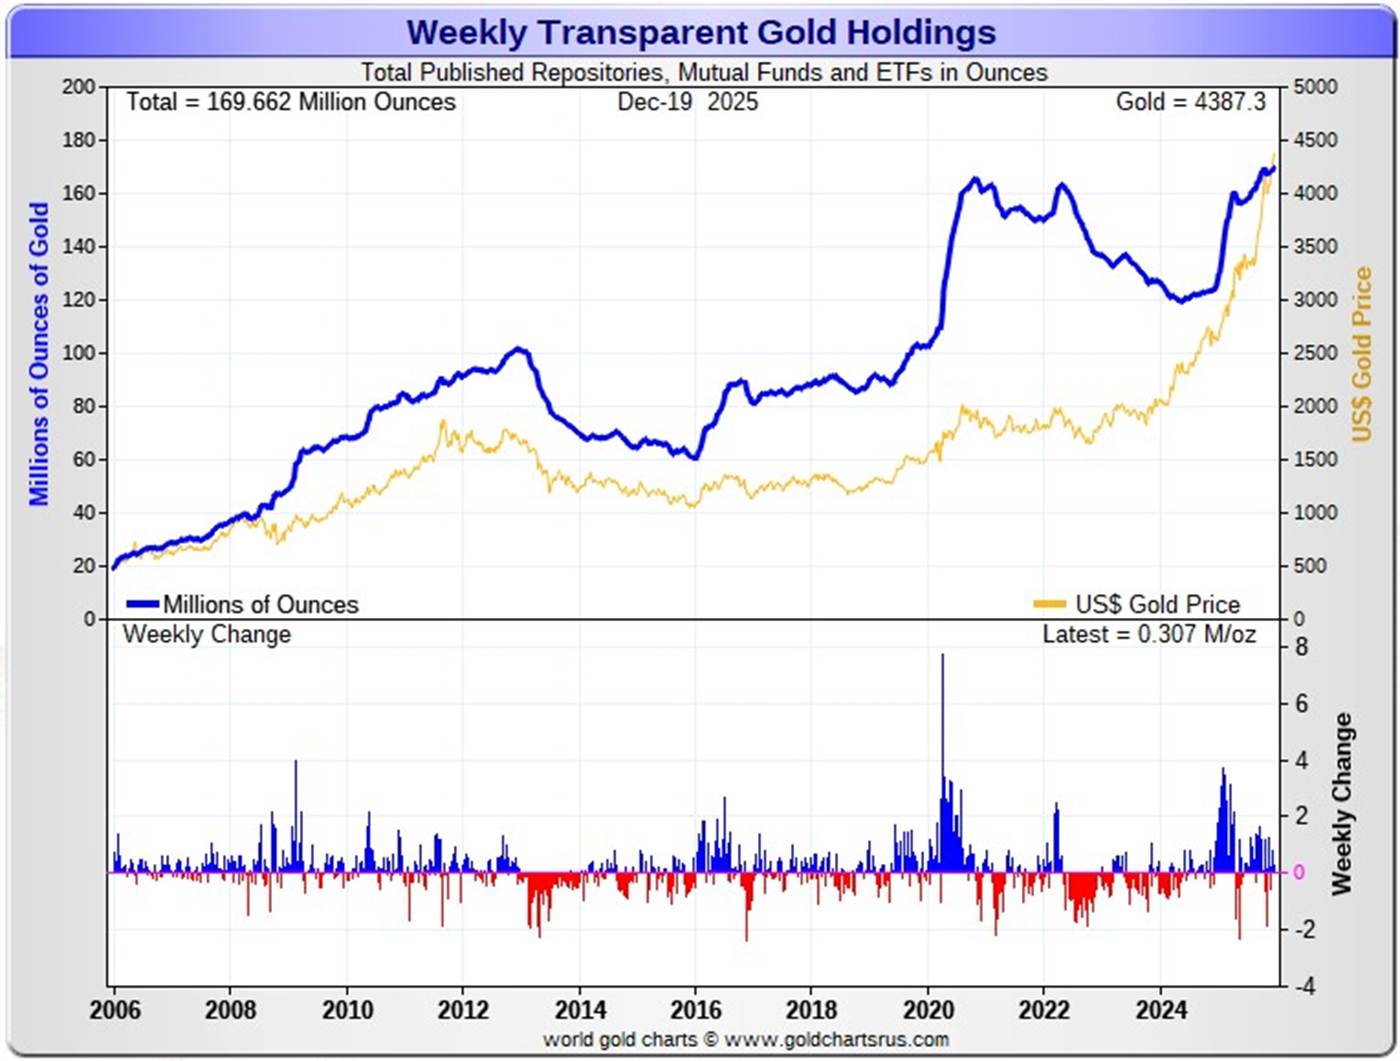
According to Nick Laird's data on his website, a net 1.657 million troy ounces of gold were added to all the world's known depositories, mutual funds and ETFs during the last four weeks. The two largest 'in' amounts were the 675,500 oz. that went into GLD, followed by the 540,100 troy ounces into China's gold ETFs. Lastly were the 475,100 troy ounces that ended up in crypto currencies/ Tether. The only large withdrawal that mattered were the net 758,200 troy ounces that left the COMEX -- and all London-bound, I suspect.
The amount of gold in all the world's ETFs and mutual funds remains barely above its old all-time high of late 2020...but should be far higher, more than double its current amount, considering that gold is now some distance north of $4,000 the ounce.. more than twice the price it was back then.
It should be noted that the amount of silver held in all these depositories, ETFs and mutual funds is a noticeable amount above its old all-time high inventory level of January 2021. But it should be far higher than it is, because silver is also handily more than double the price it was back then. Why the precious metal ETFs aren't doing better is a mystery for which I have no answer. But it's a given that the powers-that-be in the precious metals world are happy they aren't.
A net 32.777 million troy ounces of silver were also added during that same 4-week time period.
The biggest 'in' amount over that four-week period were the 25.988 million troy ounces shipped into SLV...followed by the 4.708 million oz. into India's silver ETFs. Next were the 3.820 million troy ounces into Aberdeen -- and the 3.505 million into Sprott's PSLV. Another 1.535 million troy ounces disappeared into WisdomTree. The only 'out' amount that mattered were the 6.977 million that left the COMEX -- and mostly London bound.
Retail sales are doing OK -- and most retailers show that they have stock in most of their popular products. But sales are not booming.
However, physical demand in silver at the wholesale level remains enormous/ rapacious. COMEX silver deliveries have been huge all year.
And, as mentioned further up in the Daily Delivery Report, we're into Day 19 of December deliveries -- and there have already been 3.530 million troy ounces of gold...plus a knee-wobbling 62.740 million troy ounces of silver issued and stopped so far, with new contracts being added to both every day.
This "rapacious" silver demand will continue until available supplies are depleted...which now appears imminent once more -- and we're also fast approaching the sixth year of a structural deficit in silver according to the ongoing reports from The Silver Institute.
The vast majority of precious metals being held in these depositories are by those who won't be selling until the silver price is many multiples of what it is today.
Sprott's PSLV is the third largest depository of silver on Planet Earth with 208.1 million troy ounces...up 600,000 troy ounces on the week -- and a great distance behind the COMEX, which has now been demoted to the second largest silver depository, where there are 453.7 million troy ounces being held...up 300,000 troy ounces this past week...but minus the 103 million troy ounces being held in trust for SLV by JPMorgan.
That 103 million ounce amount brings JPMorgan's actual silver warehouse stocks down to around the 87 million troy ounce mark...quite a bit different than the 190.1 million they indicate they have...down a net and further 4.9 million troy ounces on the week.
PSLV remains a very long way behind SLV as well -- now the largest silver depository...with 516.5 million troy ounces as of Friday's close...up another 1.2 million ounces from last week.
The latest short report [for positions held at the close of business on Friday, November 28] showed that the short position in SLV declined by a further 15.88%...from the 51.89 million shares sold short in the prior report...down to 43.65 million shares in this latest short report that came out ten days ago now...7.66% of total SLV shares outstanding. This amount remains grotesque, obscene -- and fraudulent beyond all description...as there is no physical silver backing any of it as the SLV prospectus requires.
BlackRock issued a warning five or so years ago to all those short SLV that there might come a time when there wouldn't be enough metal for them to cover. That would only be true if JPMorgan decides not to supply it to whatever entity requires it. However, we are far beyond that point now, as the short position in SLV will never be covered through the deposit of physical silver, as it just doesn't exit -- and never will. And if it does exist, it will only be available at a price far higher than what's being quoted in the public domain now.
The next short report...for positions held at the close of trading on Monday, December 15 will be posted on The Wall Street Journal's website on Wednesday afternoon EST on December 24.
Then there's that other little matter of the 1-billion ounce short position in silver held by Bank of America in the OTC market...with JPMorgan & Friends on the long side. Ted said it hadn't gone away -- and he'd also come to the conclusion that they're short around 25 million ounces of gold with these same parties as well. Once the silver price approaches three digits, we'll see if they need to get bailed, like Bear Stearns did back in 2008 -- and for the same reason.
The latest OCC Report for Q2/2025 came out almost three months ago now -- and it showed that the precious metal derivatives held by the four largest U.S. banks only increased by $25.8 billion/4.89% from Q1/2025...which is nothing much at all -- and that's despite the fact that precious metal prices rose fairly substantially during that time period.
JPMorgan's precious metals derivatives rose from $323.5 billion, up to $358.5 billion in Q2/2025 -- and Citigroup's also rose, but not by much, from $142.8 billion...up to $150.7 billion. BofA's fell from $61.7 billion, down to 44.7 billion -- and the derivatives position held by Goldman Sachs is a piddling and immaterial $219 million -- down from the $269 million held in Q1/2025.
But with JPMorgan holding 64.7% of all the precious metals derivatives... Citibank holding 27.2% -- and Bank of America about 8% of the total of the four reporting banks, it's only JPMorgan and Citigroup that matter.
And as I keep pointing out in this spot every weekend, the OCC indicator is flawed for two very important reasons, as way back 10-15 years ago, this report used to include the top dozen or so U.S. banks -- and included the likes of Wells Fargo and Morgan Stanley, amongst others... that are card-carrying members of the Big 8 shorts. Now the list is down to just four banks...so a lot of data is hidden...which is certainly the reason why the list was shortened. On top of that, the list doesn't include the non-U.S. banks that are members of the Big 8 shorts: British, French, German, Canadian -- and Australian.
![]()
The latest back-dated Commitment of Traders Report, for positions held at the close of COMEX trading on Tuesday, December 9, was posted on the CFTC's website at the usual time on Friday afternoon.
It showed that, for the second week in a row, the Big 8 commercial traders increased their net short positions in both silver and gold. On top of that, Ted's raptors in silver...the small commercial traders other than the Big 8... decreased their net long position even further -- and his raptors in gold increased their grotesque short position even more.
Here's the Reader's Digest version of what was in it...
In silver, the commercial net short position rose by a further 4,188 COMEX contracts...20.940 million troy ounces of the stuff. They arrived at that number through the sale of 1,318 long contracts -- and also sold 2,870 short contracts -- and it's the sum of those two numbers that represents their change for the reporting week.
The Big 4 commercial shorts increased their net short position by 446 COMEX contracts -- and the Big '5 through 8' increased theirs by 622 contracts. The small commercial traders, Ted's raptors, did their part through the sale of 1,250 contracts of their long position. So it was 'all for one -- and one for all' in the commercial category.
Four weeks ago these small traders were net long 7,892 COMEX contracts... but have been selling aggressively into silver's current rally ever since -- and are now only net long 935 silver contracts. But don't forget that their sale of long contracts represents a mathematical increase in the Commercial net short position...which is not an increase at all.
For that reason you can subtract their long sales from the headline change -- and that means that the Commercial net short position in silver only increased by 4,188-1,250=2,938 COMEX contracts during that reporting week...which is bad enough.
Under the hood in the Disaggregated COT Report, it was a little on the strange side. The only net buyers were the Managed Money traders, as they increased their net long position by 6,801 contracts. The traders in the Other Reportables and Nonreportable/small trader category both decreased their net long positions for whatever reason...the former by 611 contracts -- and the latter by a hefty 2,002 COMEX contracts. [6,801-611-2,002=4,188 contracts... the change in the Commercial net short position.
The Big 8 commercial traders in silver are net short 38.7 percent of the entire open interest in silver in the COMEX futures market.
In gold, the commercial net short position rose by a further 7,231 COMEX contract...723,100 troy ounces of the stuff. They arrived at that number through the purchase of 3,560 long contracts...but sold 10,791 short contracts -- and it's the difference between those two numbers that represents their change for the reporting week.
The Big 4 commercial traders increased their net short position by 3,964 COMEX contracts -- and the Big '5 through 8' traders increased theirs by 1,303 contracts. Ted's raptors, the smaller commercial traders other than the Big 8 shorts, increased their net short position by a further 1,964 COMEX contracts -- and are now net short gold a knee-wobbling 49,323 contracts. So it was 'all for one -- and one for all' in the collusive commercial trader category in gold too.
Under the hood in the Disaggregated COT Report, all three groups of traders added to their long positions: The Managed Money by 3,224 contracts, the Other Reportables by 3,102 contracts -- and the Nonreportable/small traders by 905 contracts. [3,224+3,102+905=7,231 COMEX contracts...the change in the commercial net short position]
The Big 8 commercial traders are net short 49.3 percent of the total open interest in gold in the COMEX futures market. However, the short position of the smaller commercial traders other than the Big 8 must also be included. Once you do that, the collusive commercial traders of whatever stripe are net short a grotesque and obscene 60.7 percent of the entire open interest in gold.
As Ted Butler said on many occasions over the years..."Who died and left these guys in charge of 'making a market' in the precious metals?"
I'm not going to get into platinum and palladium until the CFTC gets caught up at year end. Suffice to say that the Managed Money traders are pouring onto the long side but, like in silver, the Other Reportables and Nonreportable/small traders decreased their net long positions during the reporting week.
![]()
I won't bother with the Days to Cover data...but since the chart for it seems to be so popular, here it is for this COT Report.
As I pointed out in Thursday's missive..."It shows the days of world production that it would take to cover the short positions of the Big 4 — and Big 8 traders in every physically traded commodity on the COMEX. It's a graphical representation of the numbers quoted in the above COT data...except the COMEX contracts are converted to ounces -- and then into days of production. Click to enlarge."
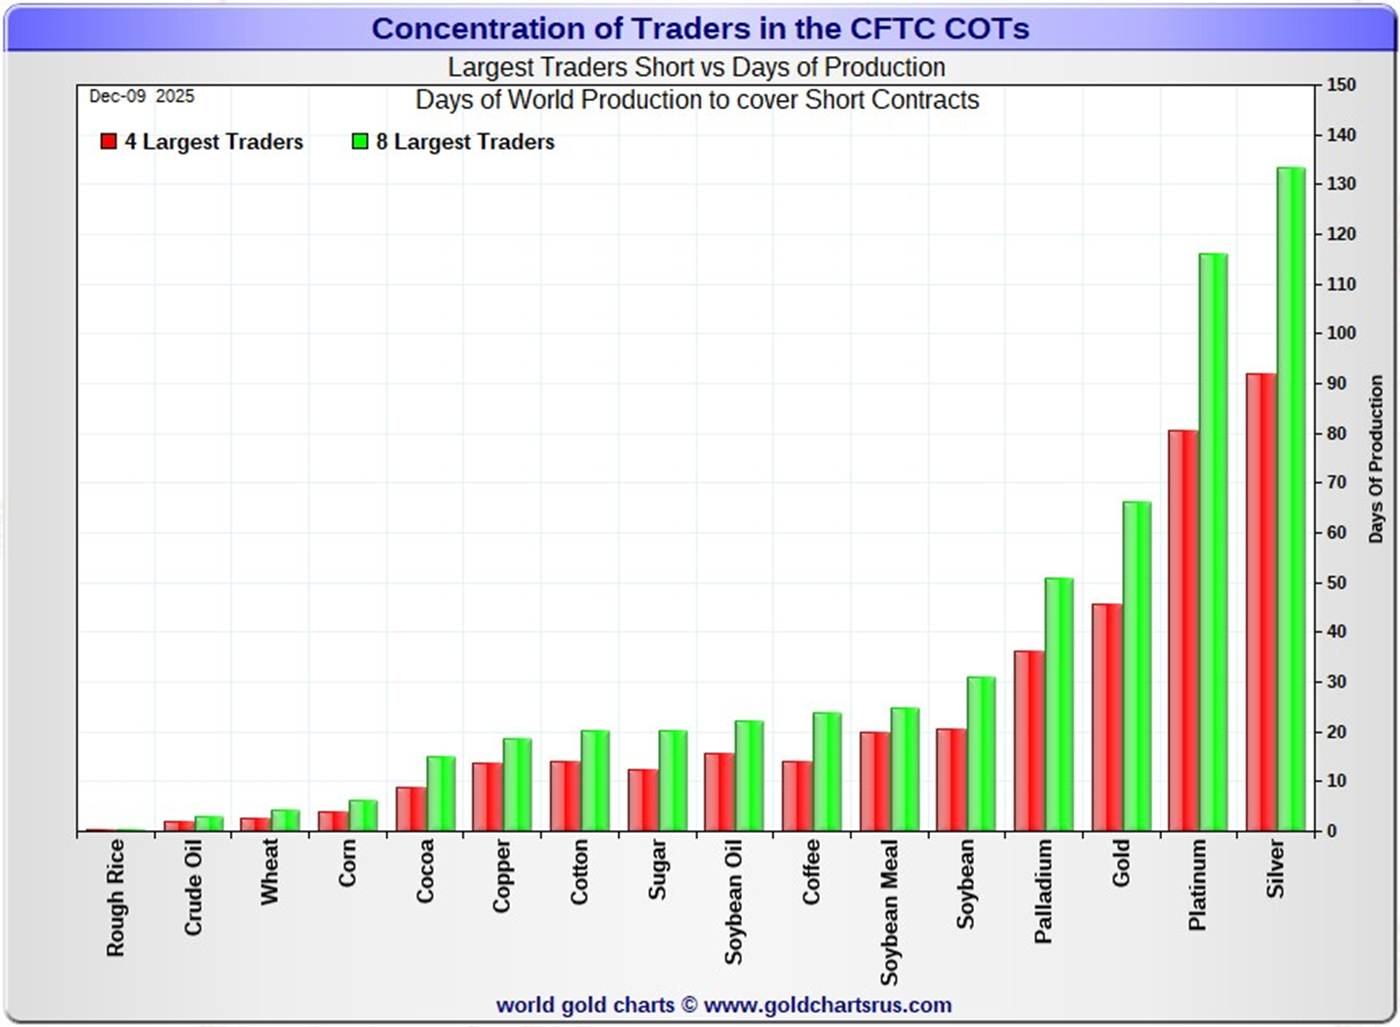
Those traders that are stuck on the short side in gold and silver have unbooked margin call losses of something north of $60 billion -- and climbing. The largest commercial traders/bullion banks will most likely get bailed out at some point if things go totally nonlinear to the upside...but as for all the rest in gold, silver, platinum, palladium...plus other commodities... there will be no one to save them, unless the powers-that-be close the LBMA and the COMEX. This fact is fully explained in Ted Butler's landmark essay..."The Bonfire of the Silver Shorts" -- and is linked yet again here.
And to make matters worse, the financial hole that these shorts are now in, is more than double the size it was when he wrote this essay a bit over two years ago.
![]()
CRITICAL READS & VIDEOS
UMich Survey Sees 'Current Conditions' in America As the Worst in 47 Years
The final print for UMich's sentiment survey for December was a doozy...
While the headline sentiment gauge and Expectations ticked up, Current Conditions slipped further...to an all-time record low... yes... worse than during Oct 1987's crash, 9/11, the GFC, and COVID...
This - as you might guess - is very unusual with stocks at record highs and as we have labored extensively this year, UMich's survey seems rife with bias
UMich claims that post-pandemic frustration with high prices persists...which is incredible since inflation expectations are plunging...
Buying conditions for durable goods fell for the fifth straight month, whereas expectations for personal finances and business conditions rose.
“Despite some signs of improvement to close out the year, sentiment remains nearly 30% below December 2024, as pocketbook issues continue to dominate consumer views of the economy,” Joanne Hsu, director of the survey, said in a statement.
Labor market expectations lifted a bit this month, though a solid majority of 63% of consumers still expects unemployment to continue rising during the next year.
This multi-chart Zero Hedge article appeared on their website at 10:26 a.m. on Friday morning EST -- and another link to it is here.
![]()
The Underlying Malady -- Bill Bonner
[F]or all the caterwauling and moaning...America was never meant to be a democracy...and a democracy is not a stable form of government anyhow. As soon as the foxes figure out how to vote themselves a rack of lamb for dinner, the sheep are doomed.
A ‘republic’ seems to be transitory too. France has had five of them since 1789...each one reached for perfection, followed by a clumsy flop.
No matter what you call it, the elite and their jefes do what they can to 1) shift more and more wealth power to themselves...and 2) keep the masses happy with lies, loaves, and sentimental diversions. How else to explain the latest ‘war’ with Venezuela?
And here’s another one. Newsweek:
Donald Trump’s “Warrior Dividend” checks will cost more than $2.5 billion
President Donald Trump has announced that he plans to issue $1,776 checks to U.S. military service members.
Of course, it is no ‘dividend.’ There is no income source from which to take real earnings. It will be just more money borrowed and spent to secure the support of the lumpenproletariat.
Much has been written about this process. The feds spend too much. Then, they go broke.
But the money itself rarely draws the attention it deserves. Almost all instances of imperial decline are accompanied by monetary decline, manifesting itself as inflation, corruption, and/or bankruptcy. But the real process — the underlying malady — is profound and mostly invisible.
This informative and very worthwhile commentary from Bill was posted on his Internet site on Friday morning EST -- and I thank Roy Stephens for sending it our way. Another link to it is here.
![]()
Global Monitoring Report on Non-Banking Financial Institutions -- Doug Noland
Seems ominous. The Bank of Japan’s Friday 25 bps rate hike was widely expected. Yet 10-year JGB yields still jumped five bps to 2.02%, the high all the way back to February 17, 1999. It’s worth noting that Japan’s government debt-to-GDP ratio surged from 130% in 1999 to 221% (3/31/25). Curiously, the yen sank 1.4% on Friday’s “tightening”, the low versus the dollar back to January 14th.
The yen closed the week less than 3% from July 2024’s multi-decade low (161.69) vs. the dollar (7/2/86) – during a period of yen devaluation following the September 1985 Plaza Accord.
We’ll assume Finance Minister Katayama is only more concerned now than when she elevated her market warning in November, with the addition of “deeply concerned.” In the past, markets had a proclivity for testing government resolve to expend reserve holdings for often futile currency support operations.
With formidable international reserves, threats from Japan’s Ministry of Finance command market attention. But the power of policymakers threats operates under the laws of diminishing returns. It’s when governments are compelled to walk the walk that things tend to turn interesting: how much are they willing to spend, and will it be enough? Show time.
This rather involved commentary from Doug put in an appearance on his Internet site around 11 p.m. PST on Friday night -- and another link to it is here.
![]()
INTEL Roundtable : w/Larry Johnson & Ray McGovern WEEKLY WRAP 19-December
This very worthwhile 30-minute video interview with McGovern and Johnson was hosted by Judge Andrew Napolitano very late on Friday afternoon EST -- and it's certainly worth your time if you have the interest. I thank Guido Tricot for sending it -- and the link to it is here.
![]()
Mining entrepreneur Eric Sprott reviews a great year for the monetary metals
In this year-end 2025 wrap-up, Craig Hemke for Sprott Money is joined by legendary investor Eric Sprott to dissect a historic year for precious metals. With gold up 65% and silver soaring, Eric discusses why the price of gold and silver are just getting started. From record-breaking physical silver demand in India to unprecedented delivery requests on the COMEX and Shanghai exchanges, Sprott believes the silver market is out of control—and that's just the beginning.
Eric predicts a return to a 15:1 gold-silver ratio, suggesting silver could reach $300 if gold hits $4,500. They cover the latest on solid-state battery technology, China's silver export ban, and why mining stocks remain significantly undervalued despite the silver price doubling.
This 47-minute video interview with The Man himself was posted on the youtube.com Internet site on Friday afternoon EST -- and I found it embedded in a GATA dispatch. Needless to say, it's definitely worth watching -- and another link to it is here.
![]()
Australian Bullion Sales Ease in November, Perth Mint Says
Australian bullion sales softened in November as Perth Mint figures reflected a pullback from October’s elevated level, even as precious metals prices posted another month of sharp gains.
The Perth Mint reported gold bullion sales of 66,710 ounces in November, down 22.1% from October but up 14.8% from November 2024.
Year-to-date gold sales totaled 429,971 ounces, a 19.5% increase from the 359,879 ounces recorded during the same period last year.
Silver bullion sales eased for the first time in three months, totaling 875,487 ounces — a 17.5% decline from October and 17.1% below year-earlier levels.
Through the first eleven months of 2025, silver sales reached 6,687,664 ounces, down 23.6% from 8,756,073 ounces over the same period in 2024.
This story was posted on the coinnews.net Internet site on Thursday -- and I found it on Sharps Pixley. Another link to it is here.
![]()
Gold market manipulation: Why, how, and how long? (2021 edition) -- Chris Powell
Remarks by Chris Powell, Secretary/Treasurer
Gold Anti-Trust Action Committee Inc.
Gold Week Africa Conference
via internet from Lagos, Nigeria
Monday, February 15, 2021
Wednesday, February 17, 2021
As you may have seen from the conference program, I'm from the United States. Even so, I wanted you to know that my country is waging war on yours, and has been for many years. The organization I represent is hoping that once you know about this you might try to do something about it. You could benefit yourselves and everybody else, Americans included.
You already know that much of west Africa sits on a fabulous foundation of gold. Presumably you are attending this conference because you suspect that this great natural resource of yours is not valued and marketed as well as it should be to increase your region's prosperity.
You're right but I'm betting you don't know the half of it. Certainly you would not have learned the other half from mainstream financial journalism and academic teaching, for they maintain that gold is at best a quaint antique. They could not be more wrong.
In fact gold remains what it has been for thousands of years -- an excellent form of money -- and may again become the best and most important form of money. More than this, gold is actually the secret knowledge of the financial universe, a secret desperately concealed by most central banks.
Gold has remained so important that Western governments -- particularly the U.S. Treasury and its Exchange Stabilization Fund, the U.S. Federal Reserve, and allied governments and central banks -- manipulate the gold market every day, even hour by hour, to control and usually suppress the monetary metal's price.
This very long presentation is worth resurrecting in the light of what's happening in the precious metals space at the moment. The western banking system, led by a consortium of British and U.S. banks, is in the process of retreating from 50+ years of price management.
There are lots of links -- and the illustrations for Part 1 & 2 of his presentation are linked at the top of this article. It's definitely a must read...as it's the definitive word on the gold price management scheme. The link to the article is here. A directly related GATA dispatch from 2017 is headlined "State Department cable confirms gold futures market was created for price suppression" -- and linked here.
QUOTE of the DAY

![]()
The WRAP
"Understand this. Things are now in motion that cannot be undone." -- Gandalf the White
![]()
It's hard to believe that this is the last weekend before Christmas...but it is.
For this one column a year I dispense with the customary pop and classical 'blasts from the past' to post music that represents the spirit of the season. They're the same two carols that I posted in this space for the last ten or so years, so now it's a tradition.
The first is from the movie 'Home Alone'. I never cared for the movie, but some of the music...well, that's different. I have the CD of John Williams' Christmas music...'Joy to the World' -- and it's wonderful. Here's a selection from that disc -- and that movie. It's by far my favourite -- and the orchestration shows John at the top of his game. The link is here. But a lot of good folks like this one from that movie better -- and that's fine too!
Next are two versions of the Coventry Carol -- and they are both so excellent, I couldn't decide between them. I post them every year as well. They're both sung a capella...which is the way it was meant to be performed, as the tune was composed in England in the 15th century.
The first version is sung in English, which is obviously not their native language, by an all-male Latvian ensemble called Quorum...but it's wonderful all the same -- and the link is here.
The second version, sung by St. Mary's Assyrian Church of the East Choir [Los Angeles] was dedicated to all displaced children -- and in particular Assyrian children who have suffered the most by war and bloodshed in the Middle East over the decades...especially over the last month. Without the Internet, this would never have been possible, as each singer was recorded at a different location -- and it was all combined during the editing. It's wonderful -- and watch it right to the end. The link is here.
![]()
With yesterday's historic options and futures expiry, I was prepared for the worst when I powered up my computer on Friday morning -- and was more than pleasantly surprised by what I saw.
Gold's rally and price performance was a bit of a side show, compared to what was happening in the other precious metals -- and volume in it was surprisingly light. But despite only closing higher by 6 bucks in the spot market, its associated equities had another strong day.
I was sure that 'da boyz' wouldn't allow silver to close above $67 spot...as they've been defending it all week long. But once it got above that price intraday in New York, all their various and sundry attempts after that to engineered it lower, were aggressively bought -- and it finally finished the day above that number -- and on a Friday no less! Once again, volume was very heavy.
Gold remains a hair in overbought territory on its RSI trace -- and silver is well above its.
Once again the platinum price wasn't allowed to run away to the upside -- and although it was closed at $1,974 spot...it finished the day at $2,009.80 in the January contract...its current front month. I'll certainly be more than interested in how big that scheduled January delivery month is. Right now, platinum open interest in January is 38,196 COMEX contracts...but the lion's share of that amount will have melted away by the time First Day Notice rolls around on Tuesday, December 30.
Palladium wasn't allowed to do much yesterday -- and although it closed higher by 25 bucks in the spot market, it only closed up $9.50 the ounce in its current front month...which is March, I believe.
But both it and palladium are hugely overbought on their respective RSI traces...especially platinum -- and whether that makes any difference or not going forward, remains to be seen. But in the past, with all four precious metals in overbought condition by varying amounts, that was always a sign that the collusive commercial traders of whatever stripe were about to commence one of their now-patented 'wash, rinse & spin' cycles.
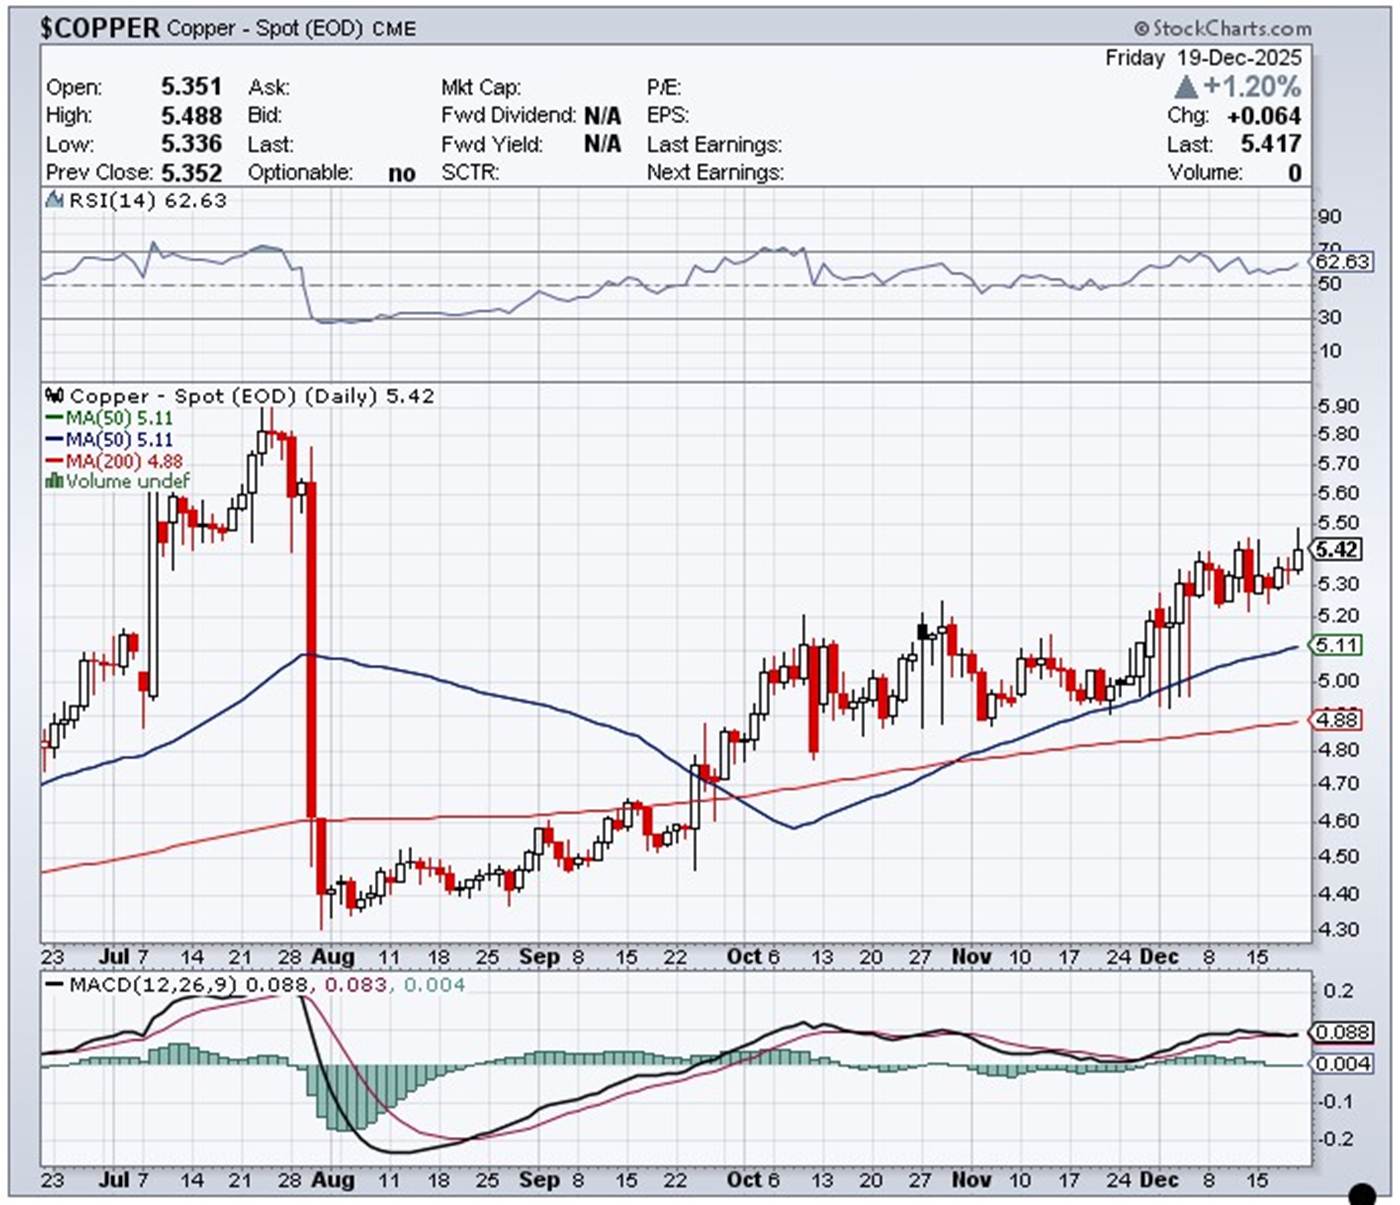
Copper traded in a 15.2 cent price range on Friday...but was closed well off its high...up 6.4 cents at $5.417/pound.
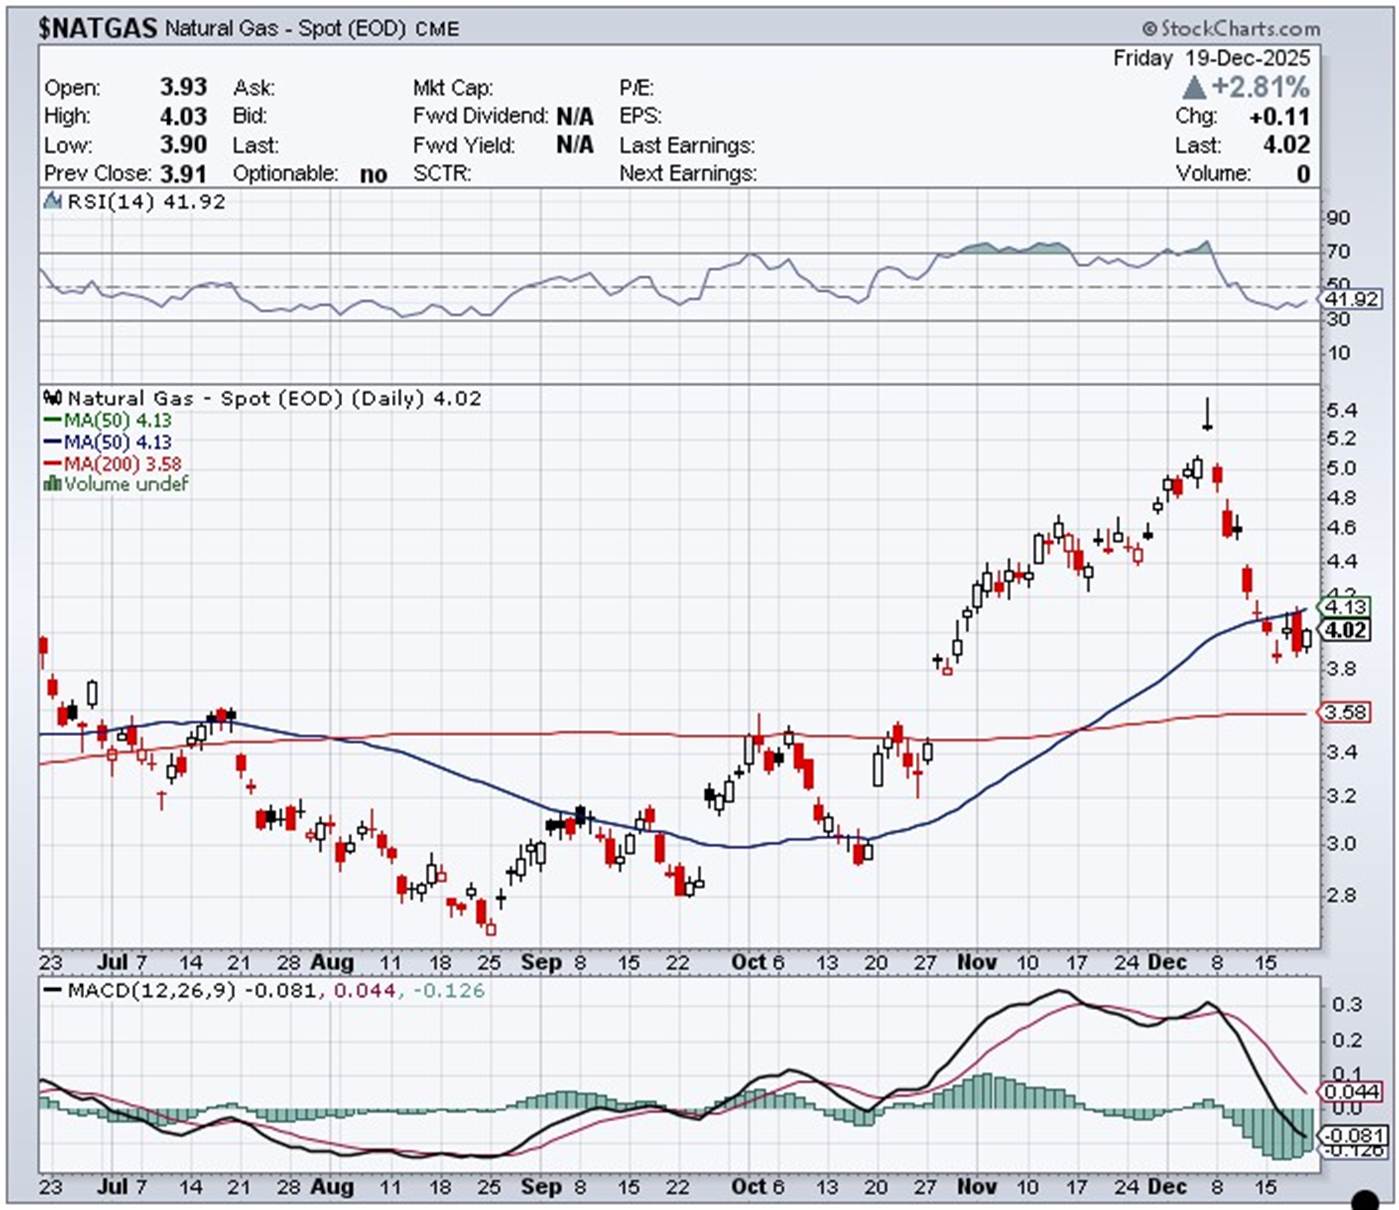
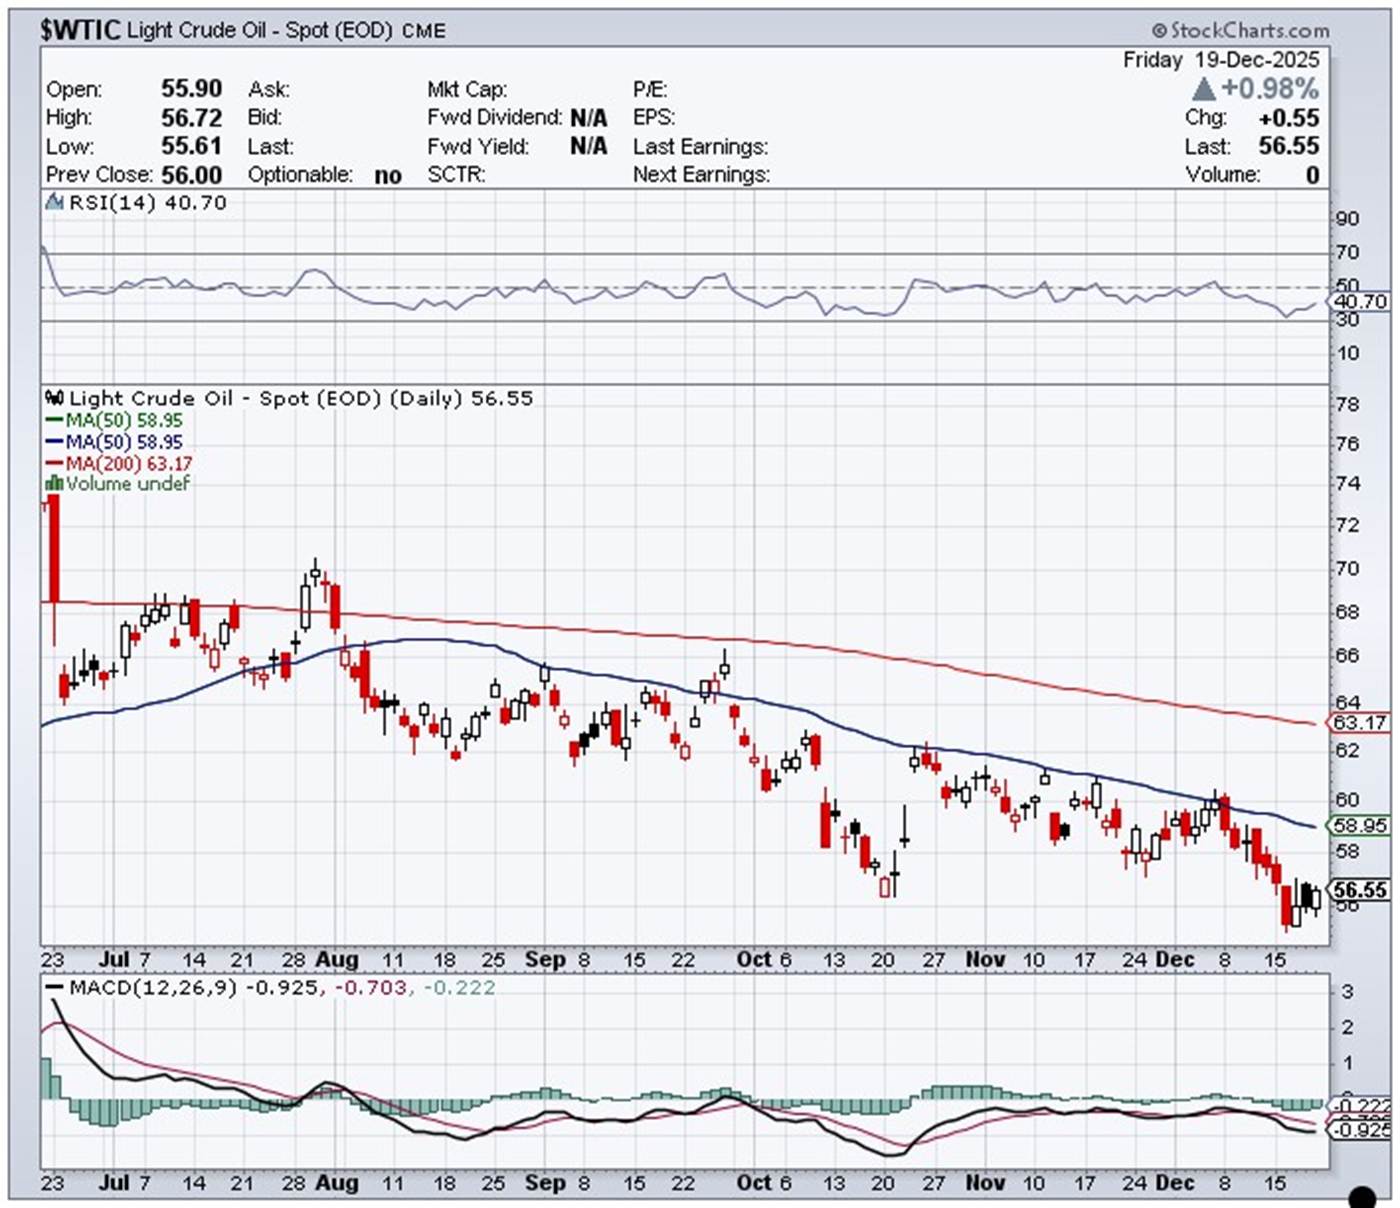
Natural gas [chart included] and WTIC both posted small gains...the former closed higher by 11 cents at $4.02/1,000 cubic feet -- and the latter by 55 cents at $56.55/barrel.
Here are the 6-month charts for the Big 6+1 commodities...thanks to stockcharts.com as always -- and are worth a look if you have the interest. Click to enlarge.
Starting now, we're into the holiday season -- and I suspect that...barring anything unforeseen... trading activity to start to wind down.
But I'm still watching for what 'da boyz' might do going into year-end. All four precious metals are in overbought territory as mentioned above -- and there's certainly a lot of low-hanging fruit for the collusive commercial traders to pluck if they wished to reach for it.
Although this might be a year-end 'book squaring' operation if does come about, the fact of the matter is that any engineered price decline and improvement in their collect short positions as a result of that...will all have to be put back on during their ensuing rallies. All these engineered dips are being bought hard -- and recovery times are down to less than a day in most cases ...but like in early Globex trading on Thursday evening in the four precious metals, all recovered within hours -- and went on to close higher on the day.
The situation for the commercial traders in particular remains hopeless from a COMEX futures market perspective -- and Ted Butler's "Bonfire of the Silver Shorts" is only being allowed to unfold in slow motion. 'Da boyz' are quick to jump on any rally in any of the four precious metals that looks like they're about to go 'no ask'...because if the 'bonfire' goes off in one, it will spill over into the rest in short order.
The demand for physical metal remains unrelenting and 'rapacious'...as the December delivery month shows. Those holding long contracts in the COMEX futures market are obviously more than prepared to pony up fiat and have physical metal in hand -- and those commercial traders /bullion banks that are short, have no choice but to cough it up.
Not only were deliveries on December First Day Notice very heavy...but copious amounts of gold and silver contracts have been added on a daily basis since then -- and it's always of interest in the Daily Delivery Report to see not only who the new longs are that demanded delivery on that particular day... but also those firms that went short against them -- and had to immediately delivery the metal. As is mostly the case, it's the western bullion banks...either for their house accounts, or for clients.
Of course, this scenario is not just confined to December, as it's been going on all year -- and by an absolute country mile, JPMorgan is by far the biggest short/ issuer and long/stopper for their client account in both silver and gold this year -- and every other year as well.
They've done very little in their house account since the managed to exit their short positions in silver and platinum back in Q1/2020...what was left of their takeover of Bear Stearns back in 2008. A month after that was the time when WTIC went negative for a few hours. Ted Butler wrote about it extensively at the time.
Year five of that structural deficit in silver is drawing to a close -- and it only remains to be seen how big that deficit will be in 2026. At the moment, there are a bit over 8 million troy ounces of silver...3.5 days of world silver production...being added to all the world's known depositories and ETFs on a net basis every 5 business days...weekends included. That's a tad more than 50% of weekly world silver production. How long can this continue? I mentioned the other day that it reminds me of the final days/weeks before the collapse of the London Gold Pool in the late 1960s.
I have no answers as to when this will all come to an end. At the beginning of the year I though it wouldn't last the year...but so far it has. The only thing I do know is that it will end -- and the longer the powers-that-be delay the inevitable, the more violent the price reaction will be.
As you already know, silver is now a 'strategic' mineral in the U.S. -- and in two weeks time an export license will be required to get silver out of China...something else you already know.
They are the No. 2 silver producer on Planet Earth -- and also the largest refiners of it, as they import huge quantities of both concentrate and doré from both Central and South America. Like their stranglehold on the rare earths, they are in a commanding position to control the flow of silver -- and its price...once the supply/demand deficit finally hits its brick wall.
Once that happens, it won't change the amount of silver mined per year... around 820 million troy ounces...one iota for a very long time, regardless of what spectacular 3-digit price silver finally settles at. And whatever extra production may come on line in the years to come...or is sold by other entities for a profit...will be instantly swallowed up by industrial, retail and institutional demand. It will be a 'Catch 22' situation with no end.
As I've mentioned in this space before...how the financial powers-that-be in the west react to this nightmare event when it finally does manifest itself, can only be imagined.
I'm done for the day -- and the week. I'm still 'all in' -- and I'll see you here on Tuesday.
Ed
About the author

SUBSCRIBE: https://edsteergoldsilver.com/

Ed Steer’s Daily Analysis of the Gold and Silver Markets
After eight years of writing about the precious metals for Casey Research, the folks at Stansberry & Associates—who just recently purchased controlling interest in the company—decided that my ‘niche market’ column didn’t fit into their plans.
Since the time that Casey Research was kind enough to offer me a stand-alone column, it became their most highly-rated blog almost from the outset—and has remained that way up to this date...