According to the CME Groups recent release, Comex Registered Silver inventories reached an all time low yesterday. The Registered Silver inventories are those stocks ready to be delivered into the market. Looking at the data put out by Sharlynx.com, Registered Silver Inventories haven’t been this low going back to the 1970’s.
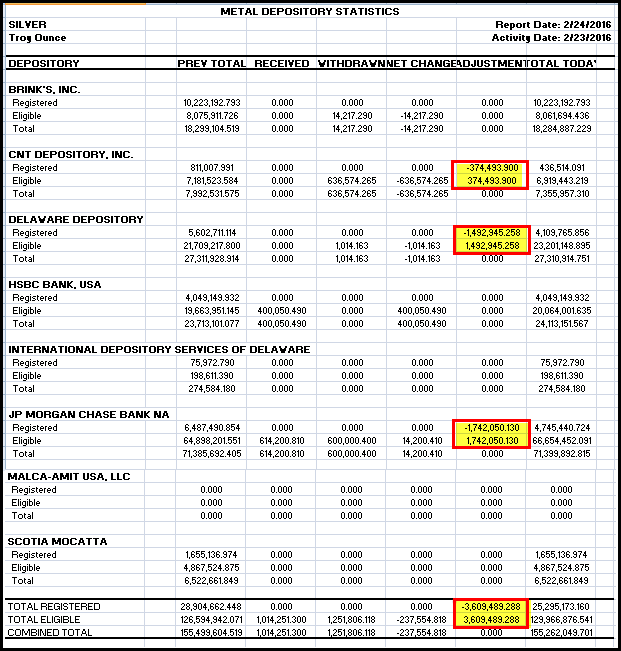
The Registered Silver inventories suffered a large drop yesterday, when 3.6 million oz (Moz) were transferred out of three depositories. The CNT Depository transferred 374,494 oz, the Delaware Depository transferred 1,492,945 oz and JP Morgan, 1,742,050 oz. The 3.6 Moz were transferred out of Registered inventories and into the Eligible. Thus, there are now only 25.3 Moz of Registered Silver inventories at the Comex:
The chart chart below only goes back until 2001, but as we can see, the Registered Silver inventories have never been this low. Before yesterday’s 3.6 Moz decline, the last record low was in July 2011 when the Registered Silver inventories fell to 26.7 Moz:
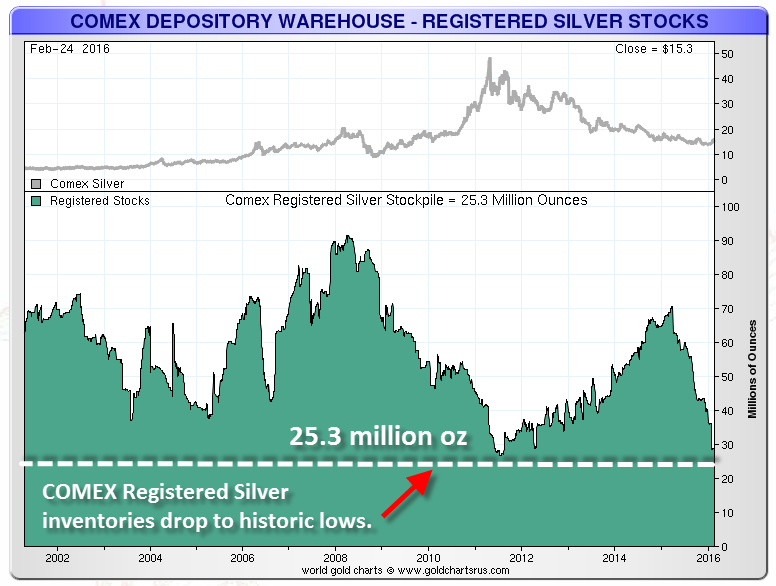
What is interesting about this chart is the rapid decline of Registered Silver Inventories over the past year compared to the down trend from 2008 to 2011. From the beginning of 2008, the Registered Silver inventories fell from 90+ Moz to 26.7 Moz in July 2011. Thus, the total decline was 64 Moz over this 3 1/2 year period, averaging out to be 18.3 Moz decline per year.
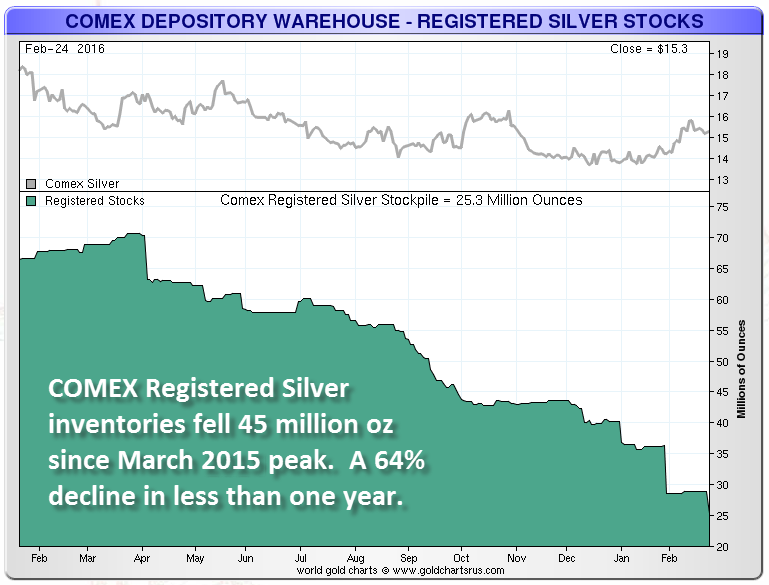
Now compare that to the 45 Moz decline starting at the peak in March, 2015 (70.3 Moz). This was a huge 45 Moz decline in less than a year… almost three times the decline rate compared to the 2008-2011 period.
Registered Silver Inventories Owners Per Ounce Surge Over Past Month
Since the end of January 2016, Registered Silver owners per ounce surged 75% from 20 to 35:
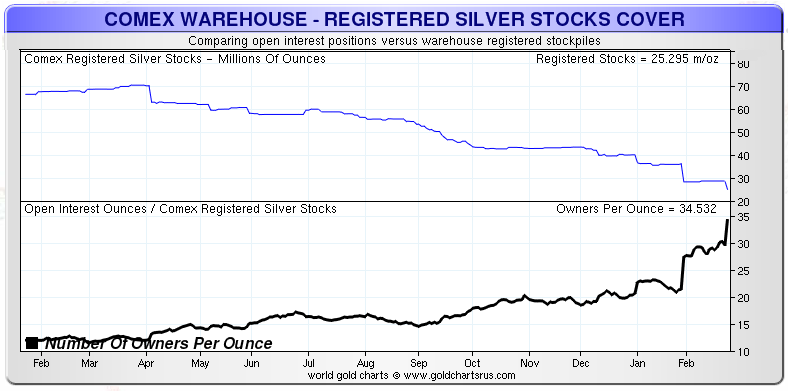
In April 2015, there were a little more than 10 owners per ounce of Registered Silver at the Comex. However, this began to rise slowly, then surged in the beginning of February from 20 owners per ounce to 35 yesterday (actually 34.53). What is even more interesting is looking at the same chart (showing more detail) going back until 2005:
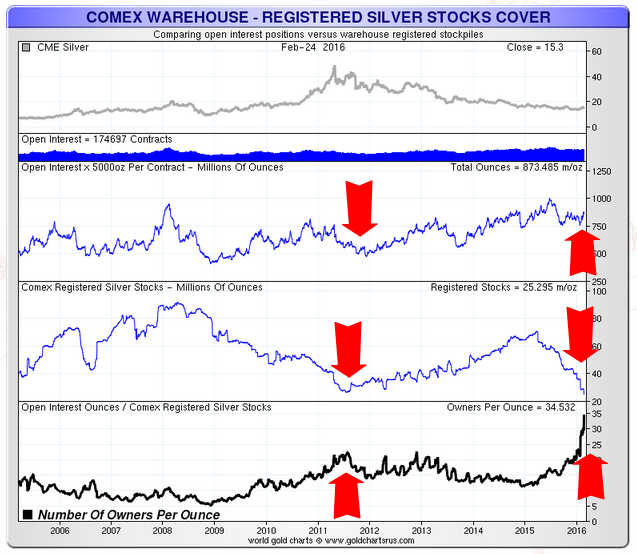
In July 2011, we can see the total Open Interest (second chart from top) falling along with the owners per ounce. Thus, there were two falling Red Arrows in July 2011 with one pointing up showing the increase in owners per ounce. The reason for this is simple… as the Registered Inventories decline, the owners per ounce increases.
Now if we look at the current trend, we see a much different picture. First of all, the current decline of Registered Silver Inventories (third chart from top) is much steeper than in 2011 as well as the owners per ounce. Furthermore, the open interest is trending higher while the Registered Inventories continue to decline. That is shown by the up arrow in the second chart from the top.
This is a strange anomaly indeed. Something just isn’t right at the Comex. Not only are the Registered Gold Inventories at historic lows, so are the Registered Silver Inventories.
It will be interesting to watch the Registered Silver Inventories over the next 3-6 months as the broader stock markets continue to decline. I believe this decline of Registered Silver Inventories denotes a tightness in the market even though certain indicators don’t show it.
Please check back for new articles and updates at the SRSrocco Report. You can also follow us at Twitter below:


