Yesterday in Gold, Silver, Platinum and Palladium
![]()
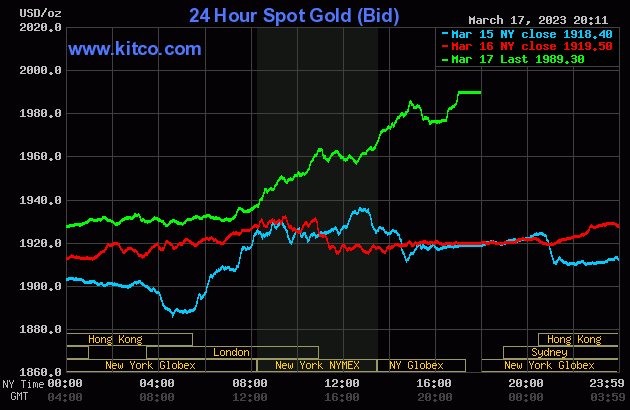
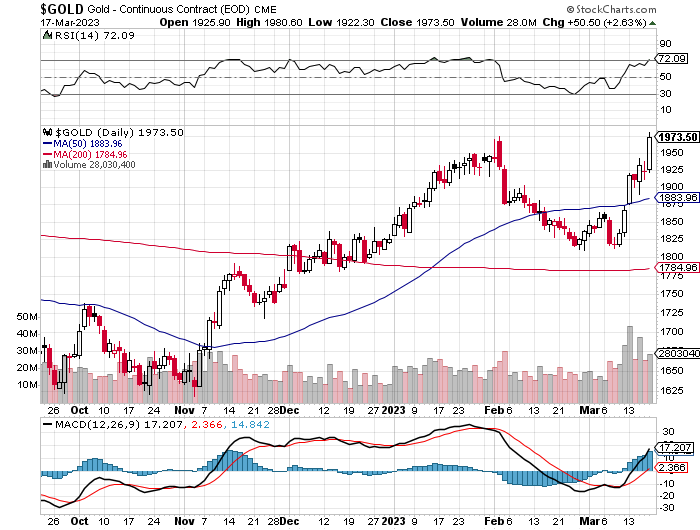
The gold price crawled quietly higher until around 3 p.m. China Standard Time/7 a.m. in London in GLOBEX trading on their Fridays -- and then traded flat until 11 a.m. GMT. The gold price began a rally that ended around 2:50 p.m. in after-hours trading in New York. It was sold a bit lower over the next hour...traded flat until minutes before 4:30 p.m. -- and then took off higher anew, closing on its high of the day.
The low and high ticks in gold were recorded as $1,922.30 and $1,993.70 in the April contract. The April/June price spread differential in silver at the close in New York yesterday was $16.70...June/August was $16.90...August/October was $16.00 -- and October/December was $15.70 an ounce.
Gold finished the Friday trading session in New York at $1,989.30 spot, up a hefty $69.80 on the day. Net volume was pretty monstrous at just about 276,500 contracts -- and there were just under 76,000 contracts worth of roll-over/switch volume out of April and into future months...mostly June, but with noticeable amounts in the three remaining delivery months of the year.
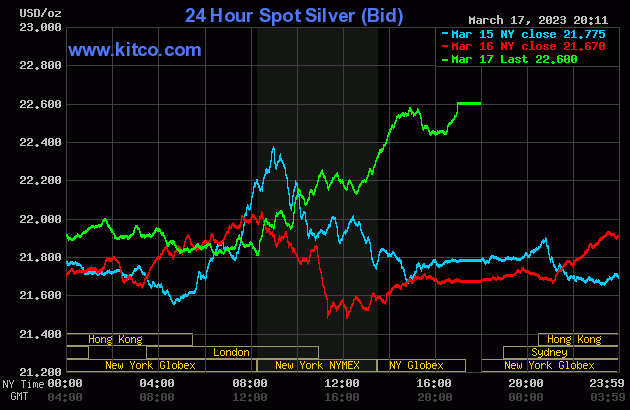
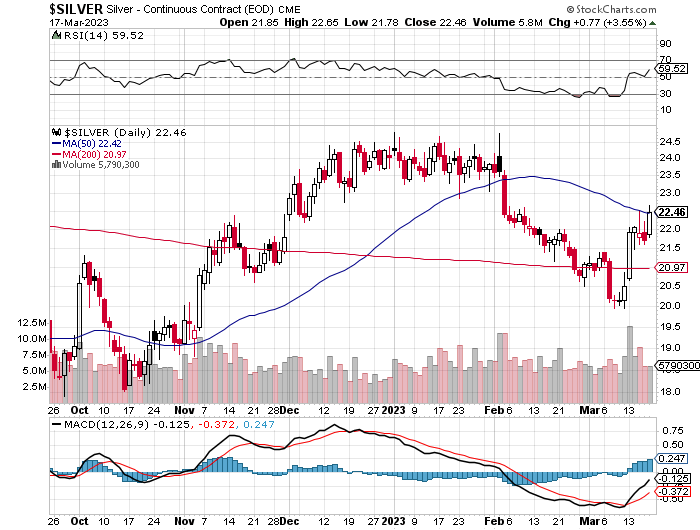
Silver's uneven rally in GLOBEX trading in the Far East ended around 1:45 p.m. China Standard Time on their Friday afternoon -- and it was then sold quietly and a bit unevenly lower until the COMEX open in New York. After that, its rally was very similar to gold's -- and it closed within a penny of its high tick of the day.
The low and high ticks in silver were reported by the CME Group as $21.785 and $22.765 in the May contract. The March/May price spread differential in silver at the close in New York yesterday was 11.1 cents...May/July was 18.0 cents...July/September was 17.9 cents -- and September/December was 24.9 cents an ounce.
Silver finished the Friday trading session in New York at $22.60 spot, up 93 cents from Thursday's close. Net volume was pretty light, considering the price action, at a bit over 67,000 contracts -- and there were about 2,400 contracts worth of roll-over/switch volume in this precious metal...mostly into July, but with a bit into September and December as well.
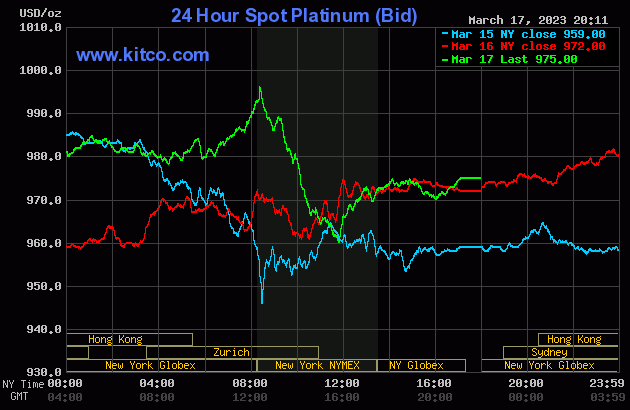
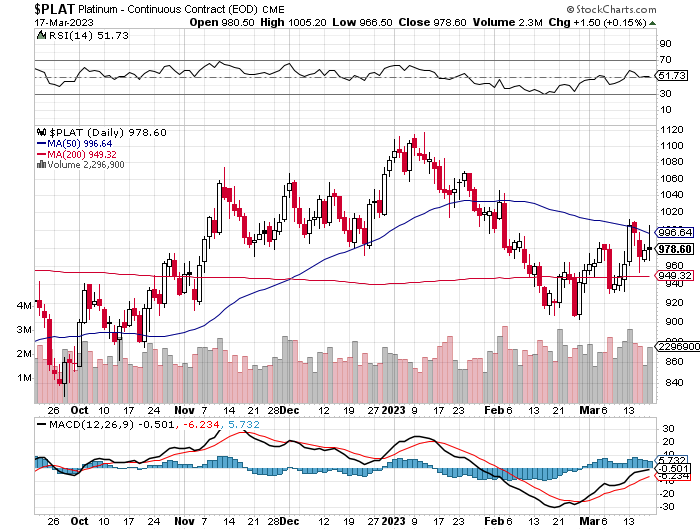
Platinum took two small steps higher in price until around 1 p.m. in GLOBEX trading on their Friday afternoon -- and was then sold quietly lower until 9 a.m. in Zurich. It didn't do much over the next few hours -- and then a solid rally began that ran into 'something' minutes after the 8:30 a.m. EDT COMEX open. It was engineered sharply lower in price from the until around 11:50 a.m. -- and then rallied a bit until 2 p.m. in after-hours trading. It had a quiet down/up move from there until the market closed at 5:00 p.m. EDT. Platinum was closed at $975 spot, up 3 dollars on the day -- and 21 bucks off its Kitco-recorded high tick.
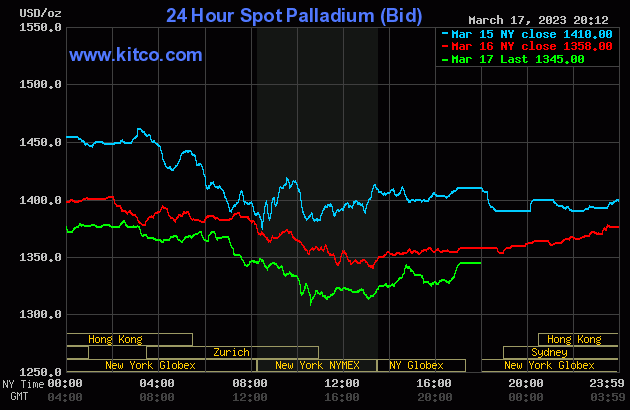
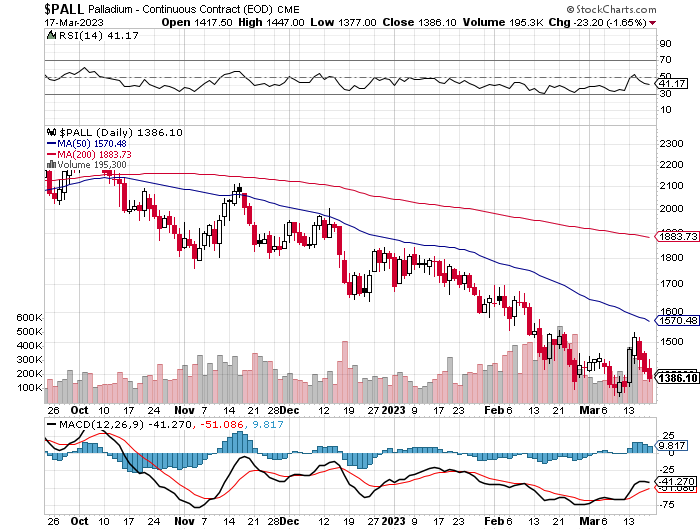
Palladium crept higher until around 11:30 a.m. CST in GLOBEX trading -- and then edged a bit lower until it ran into 'something' at noon CET in Zurich. Its low tick was set around 10:30 a.m. in New York -- and it wandered quietly and a bit unevenly higher until trading ended at 5:00 p.m. EDT. Palladium was closed at $1,345 spot, down 13 bucks from Thursday.
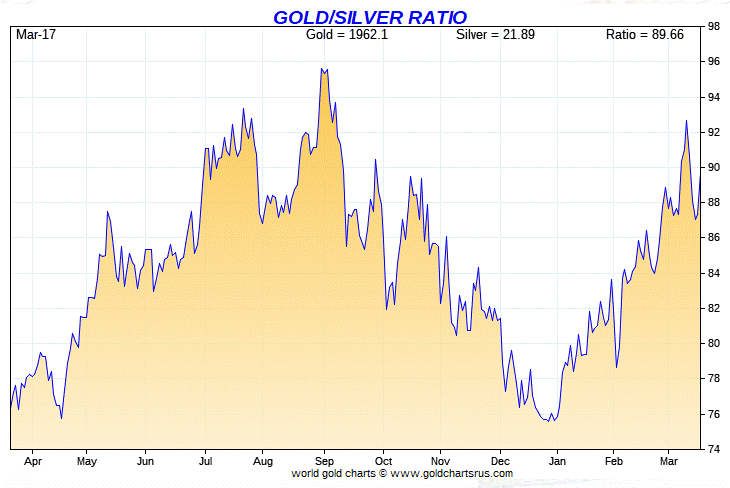
Based on the kitco.com spot closing prices in silver and gold posted above, the gold/silver ratio worked out to 88.0 to 1 on Friday...compared to 88.6 to 1 on Thursday.
Here's Nick's 1-year gold/silver ratio chart, updated with this past week's data and, for whatever reason, Friday's data point is not on it, as usual. Click to enlarge
![]()
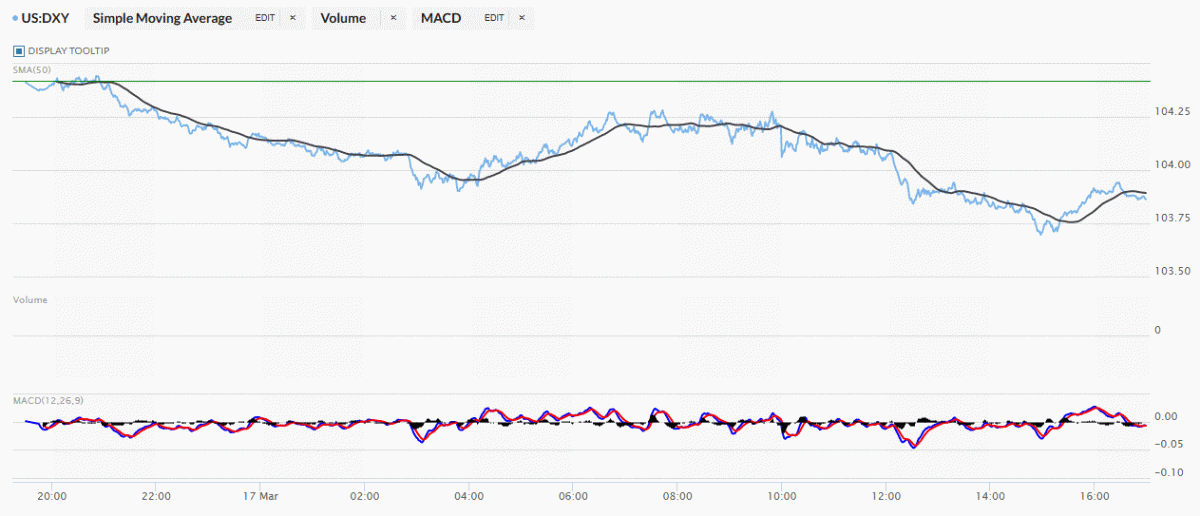
The dollar index closed very late on Thursday afternoon in New York at 104.42 -- and then opened down 1 basis point once trading commenced at 7:30 p.m. EST on Thursday evening, which was 7:30 a.m. China Standard Time on their Friday morning. It traded sideways until it began to head south around 8:52 a.m. CST. That sell-off lasted until around 3:48 p.m. CST. Its ensuing 'rally' ended around 10:40 a.m. GMT -- and it then chopped quietly sideways until it began to head south anew starting around 9:48 a.m. in New York. That sell-off ended around 3 p.m. EDT -- and it then edged higher until 4 p.m...before sliding a bit going into the 5:00 p.m. EDT close.
The dollar index finished the the Friday trading session at 103.71... down 71 basis points from its close on Thursday -- and 15 basis points below its indicated spot close on the DXY chart below.
Here's the DXY chart for Friday, courtesy of the stockcharts.com Internet site -- and the above-mentioned discrepancy should be noted, if interested. Click to enlarge.
And here's the 5-year U.S. dollar index chart from stockcharts.com that shows up in this space in every Saturday column. The delta between its close...103.36...and the close on the DXY chart above, was 35 basis points below its spot close. Click to enlarge as well.
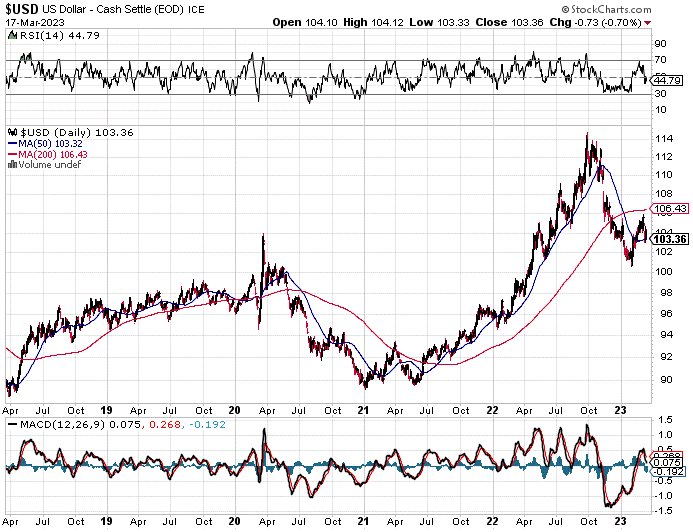
If there was any correlation between the currencies and gold and silver prices, it was purely coincidental. There was none at all in platinum and palladium, as 'da boyz' made sure of that.
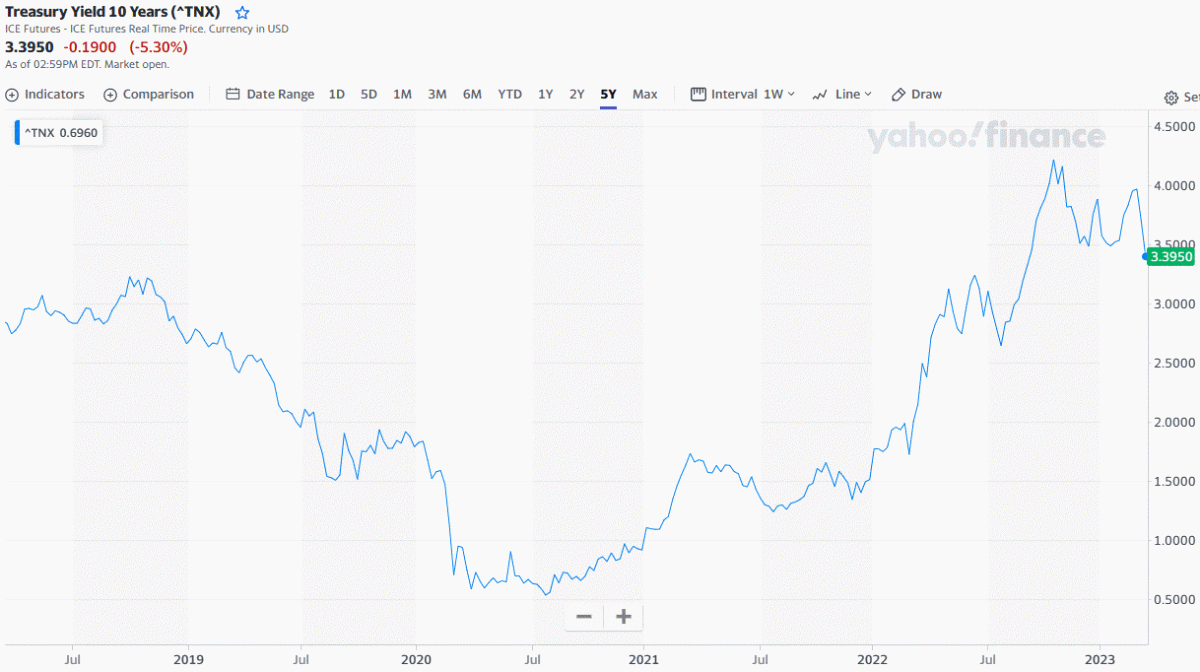
U.S. 10-year Treasury: 3.3950%...down 0.1900 (-5.30%)...as of 02:59 p.m. EDT
Here's the 5-year 10-year U.S. Treasury chart from the yahoo.com Internet site -- and it puts the yield curve into a somewhat longer-term perspective. Click to enlarge.
![]()
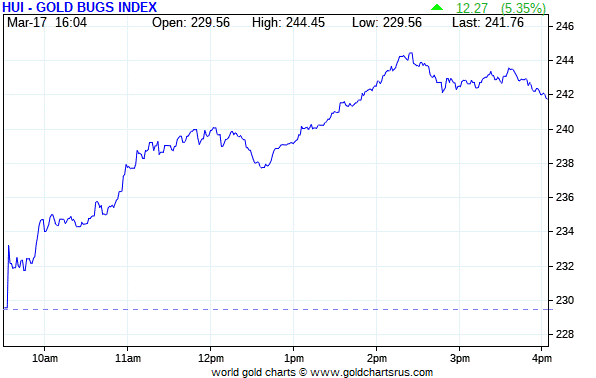
The gold stocks gapped up a hair at the 9:30 opens in New York on Friday morning -- and then wandered quietly higher from there until around 2:25 p.m. EDT, which was at least twenty minutes before the gold price hit its first high tick. From that juncture they took two quiet steps lower until trading ended at 4:00 p.m. EST. The HUI closed higher by 5.35%...which was respectable, but somewhat disappointing considering the size of the price move in gold.
Computed manually, the new Silver Sentiment/Silver 12 Index closed up 6.01 percent -- and I must admit that I was somewhat underwhelmed by this number, too.
And here's Nick's old 1-year Silver Sentiment/Silver 7 Index chart, updated with Friday's candle. It was helped mightily by Peñoles, as it closed up 17.46%...but only on 313 shares traded. But that makes up for the many days that it closes unchanged on the day. Click to enlarge.
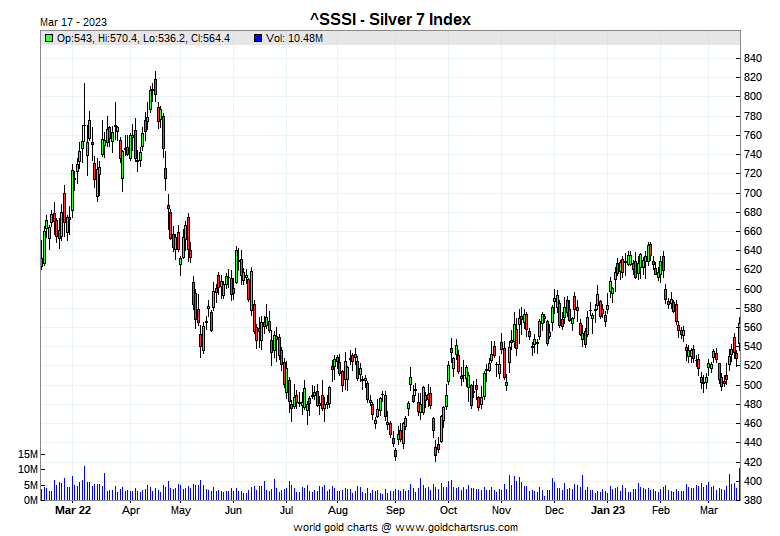
There were lots of stars yesterday -- and the two biggest were SilverCrest Metals and Aya Gold & Silver, up 8.83 and 8.16 percent respectively. The biggest underperformer by far was MAG silver, as it closed higher by only 2.80 percent.
There were huge volumes in every precious metals-related equity or ETF on Friday.
I checked with Robert Levy over at Border Gold in White Rock, B.C. yesterday -- and he said it was "nuts...people going bonkers" on Friday.
The reddit.com/ Wallstreetsilver website is still going...sort of -- and the link to that is here. The link to two other silver forums are here -- and here.
![]()
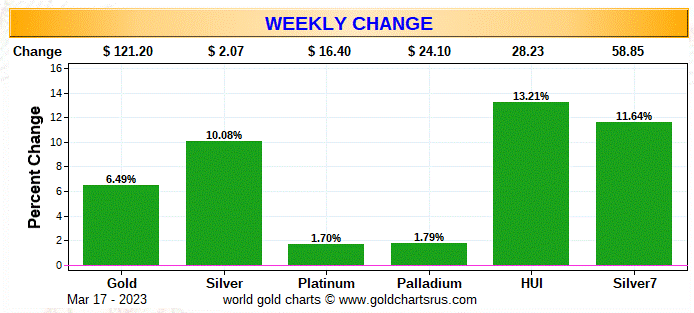
Here are the usual three charts that show up in every weekend missive. They show the changes in gold, silver, platinum and palladium in both percent and dollar and cents terms, as of their Friday closes in New York — along with the changes in the HUI and the old Silver 7 Index.
Here's the weekly chart -- and it's a lovely shade of green across the board ...don't you think? Everything gold outperformed everything silver -- and that's for the simple reason that gold is miles above any moving average that matters -- and silver was barely allowed to close above its 50-day moving average for the first late on Friday afternoon. Click to enlarge.
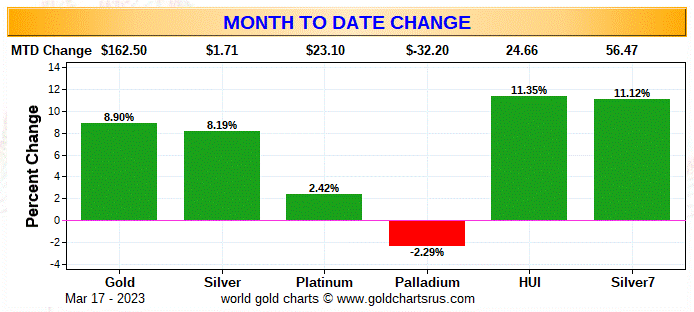
Here's the month-to-date chart -- and for except for hapless palladium, it's a nice shade of green as well. Here, silver and gold, plus their associated equities have performed about the same.
The year-to-date chart -- and it has some green on it as well...finally. The chart shows the dismal performance of the precious metal equities vs. their underlying precious metals. But silver is outperforming in a relative sense -- and has lots of catching up to do -- and that's for the reasons I spoke of in the weekly chart commentary. Palladium remains the biggest loser but, like the other three precious metals, it's only because of what the commercial traders of whatever stripe have been up to in the COMEX future market since the Fed's February 1 FOMC meeting. Click to enlarge.
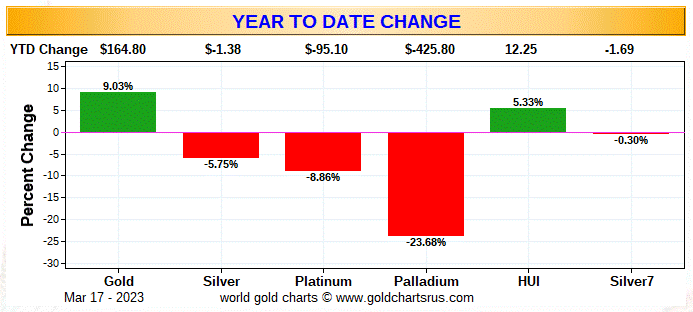
So, are we off to the races from here? Let's hope so -- because from a COMEX futures market perspective, its very bullish for gold -- and white-hot incandescent for silver.
![]()
The CME Daily Delivery Report showed that another 280 gold and 46 silver contracts were posted for delivery within the COMEX-approved depositories on Tuesday.
In gold, the only short/issuer that mattered was JPMorgan, as they issued 279 contracts out of their so-called 'client' account. The three biggest of the six long/stoppers in total were Canada's Scotia Capital/Scotiabank, JPMorgan and ADM, picking up 138, 83 and 39 contracts...Scotia Capital for their house account.
In silver, the biggest of the three short/issuers was Advantage, issuing 40 contracts out of its client account. The two long/stoppers were Dorman Trading and ADM, as they picked up 30 and 16 contracts for their respective client accounts.
The link to yesterday's Issuers and Stoppers Report is here.
So far in March there have already been 4,740 gold contracts issued/reissued and stopped, which is impressive since March is a non-scheduled delivery month for gold. That number in silver is only 3,087 contracts. In platinum it's 2 COMEX contracts -- and in palladium it's 82 contracts.
The CME Preliminary Report for the Friday trading session showed that gold open interest in March fell by 143 COMEX contracts, leaving 353 still around, minus the 280 contracts mentioned several paragraphs ago. Thursday's Daily Delivery Report showed that 209 gold contracts were actually posted for delivery on Monday, so that means that 209-143=66 more gold contract were added to March deliveries. Silver o.i. in March increased by 5 contract, leaving 73 left, minus the 46 contracts mentioned several paragraphs ago. Thursday's Daily Delivery Report showed that 31 silver contracts were actually posted for delivery on Monday, so that means that 31+5=36 more silver contract just got added to the March delivery month.
Total gold open interest at the close on Friday rose by a not surprising and hefty 18,940 COMEX contracts -- but total silver o.i. rose by a scant 1,421 contracts, which was a big surprise, as I was expecting a far larger number than that considering yesterday's price action. Both numbers are subject to some revision by the time the final figures are posted on the CME's website later on Monday morning CDT.
![]()
Not surprisingly, there was a fairly hefty deposit into GLD yesterday as one or more authorized participants added 204,517 troy ounces of gold. But over at SLV, the very counterintuitive withdrawals continued for the third day in a row, as an a.p. removed another 3,400,818 troy ounces of silver.
That makes 18,888,606 troy ounces of silver that has been removed from SLV over the last three days -- and Ted though that this was a very big deal. He figured that at least 10+ million ounces is owed SLV -- and because none of it has been visibly deposited, he's of the opinion that whoever is short SLV, is back to shorting SLV in lieu of depositing physical metal...as it just isn't available. I know that he'll have lots to say about this [amongst other things] in his weekly review this afternoon -- and I look forward to reading what they are.
In other gold and silver ETFs and mutual funds on Planet Earth on Friday, net of any changes in COMEX, GLD and SLV inventories, there were a net 50,227 troy ounces of gold taken out -- and a net 627,084 troy ounces of silver was removed as well...the largest amount being the 763,625 troy ounces taken out of iShares/SVR.
There was no sales report from the U.S. Mint.
Month-to-date the mint has sold 54,000 troy ounces of gold eagles -- 19,000 one-ounce 24K gold buffaloes -- and 450,000 silver eagles.
And still no 2022 Annual Report from the Royal Canadian Mint.
![]()
The only activity in gold over at the COMEX-approved depositories on the U.S. east coast on Thursday were the 23,417 troy ounces that departed Brink's, Inc. Nothing was reported received -- and there was no paper activity, either. The link to this is here.
There wasn't a lot of activity in silver, either...as only 15,055 troy ounces were reported received -- and 415,976 troy ounces were shipped out.
In the 'in' category, there were 7,979 troy ounces received at CNT -- and the remaining 7,076 troy ounces arrived at Delaware.
The largest 'out' amount were the 263,612 troy ounces that left Loomis International, followed by the 117,574 troy ounces that departed CNT. The remaining 34,789 troy ounces were shipped out of Brink's, Inc.
There was no paper activity here, either -- and the link to Thursday's COMEX silver activity is here.
There was decent activity over at the COMEX-approved gold kilobar depositories in Hong Kong on their Thursday. They reported receiving 1,143 of them -- and shipped out 67 kilobars. Except for the 128 kilobars that arrived at Loomis International, the rest of the in/out activity took place over at Brink's, Inc. as always. The link to this, in troy ounces, is here.
![]()
Here are the usual 20-year charts that show up in this space in every Saturday column. They show the total amount of physical gold and silver held in all know depositories, ETFs and mutual funds as of the close of business on Friday.
During the week just past, there were a net 514,000 troy ounces of gold added -- but a net and eye-watering 19.731 million troy ounces of silver was taken out...mostly from SLV. Click to enlarge for both.
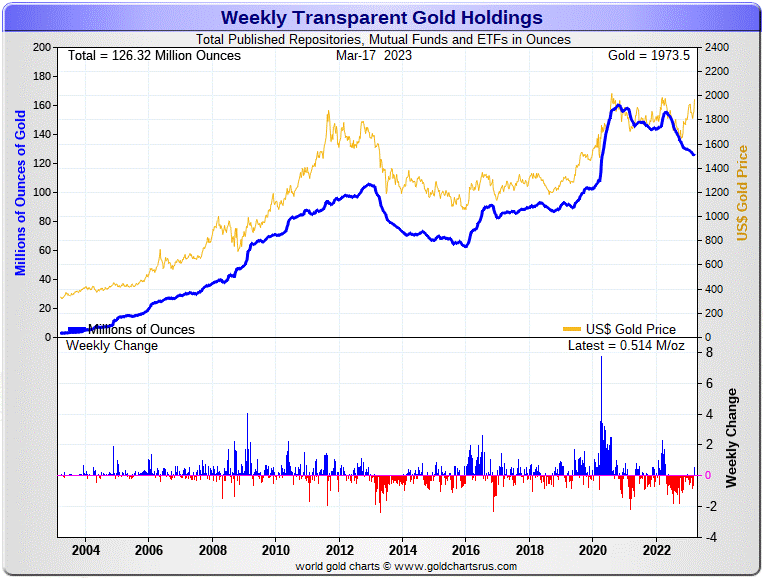
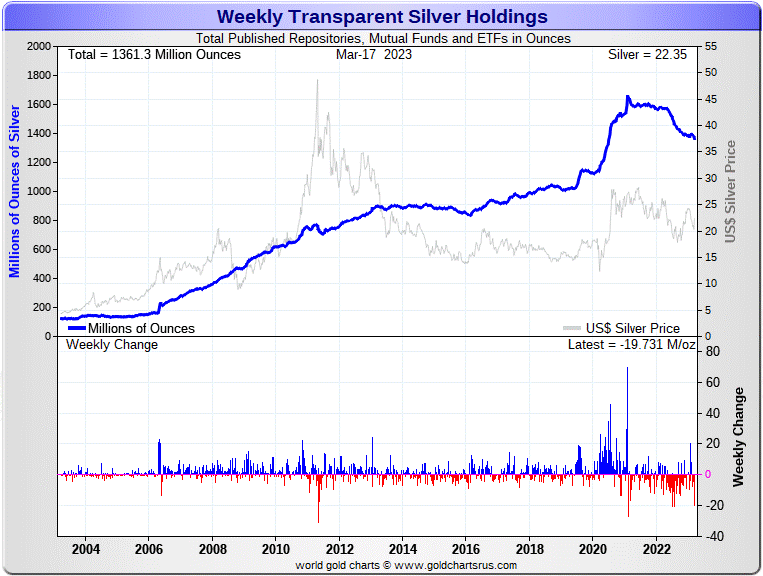
According to Nick Laird's data on his website, there has been a net 889,500 troy ounces of gold removed -- and a net 32.70 million troy ounces of silver was also taken out of all the world's known depositories, mutual funds and ETFs during the last four weeks.
Despite the rallies over the last week and a bit, all gold ETFs and mutual funds, with the odd minor exception, have been shedding gold like mad over the last four weeks. This is particularly true of the COMEX...down 451,000 troy ounces, iShares/IAU...down 152,000 troy ounces -- and UBS, down 255,000 troy ounces.
In silver -- the biggest drop was in SLV inventories, down a whopping 27.035 million troy ounces, followed by the COMEX, down 5.160 million troy ounces. After them came SIVR, down 1.816 million troy ounces...and 843,000 troy ounces out of iShares/SVR.
Retail bullion sales have exploded around the world. Most the available inventory has vanished -- and higher premiums have returned. I have a bit more about this in The Wrap.
The physical shortage in silver at the wholesale level continues unabated and at an ever-increasing rate....as just pointed out above, with the 19 million ounces out of SLV over the last three days being the poster child for that. How much silver is left in these depositories that is available for sale at current prices is something that Ted has been going on about for a long while now -- and he's of the opinion that there isn't a lot. Whatever that number is, we got a lot closer to it this week.
The vast majority of precious metals being held in these depositories are by those who won't be selling until the silver price is many multiples of what it is today. That's particularly true of PSLV.
Not only is there an obvious shortage in wholesale silver, but the fact that central bank gold demand exploded to 1,136 tonnes last year, means that there's a lot less gold in good delivery form around too. That amount, plus the 551 tonnes that was reported being held by Russia's sovereign wealth fund a month or so ago, most likely means that the wholesale physical market in gold is getting tight as well. It's a good bet that it's gotten a lot tighter in the last ten days because of the banking crisis.
Turkey's purchases of 68+ tonnes in January -- and another 57+ tonnes in February, is an indication that the central banks of the world are still at it. I'll certainly be interested in the next report that comes out of the World Gold Council.
And as you're more than aware, this extraordinary demand in both of these precious metals has not yet been allowed to manifest itself in their respective prices. The Big 4/8 commercial shorts still have them in their iron grip...but that iron grip slipped a lot yesterday.
And there's still this not so little matter of the 36.28 million shares currently sold short in SLV. That's down only 1.78% as of the last published short report on March 9.
Ted thinks that whoever is depositing silver into SLV recently, has to have leased it from JPMorgan...as they and their friends are the only ones that have that quantity of silver that they're willing or able to part with, but with obvious strings attached. I know that he is going to have a lot to say about this in his weekly review this afternoon.
The next short report is due out on Friday, March 24...for positions held at the close of business on Wednesday, March 15 -- and when that shows up, we should learn more. But because of those big withdrawals in the last few days, Ted is of the opinion that whoever is short SLV, is short a lot more now, as there haven't been any big deposits into SLV for awhile, so they're shorting the shares in lieu of depositing physical metal.
Then there's that other little matter of the 1-billion ounce short position held by Bank of America...with JPMorgan & Friends on the long side. Ted says it hasn't gone away -- and as he pointed out, the latest OCC Report, for positions held at the end of September, shows that it's still there, but now hidden by their market-neutral spread trades in gold.
The latest OCC Report, for positions held at the end of Q4/2022 won't appear for another week or so.
![]()
Much to my [and Ted's] surprise and disappointment, there was no Commitment of Traders or Bank Participation Reports yesterday -- and the link to the announcement from the CFTC is here.
Those reports, for positions held at the close of COMEX trading on Tuesday, March 14...would have brought us up to date on what was happening from a futures market perspective in all four precious metals. Hopefully they'll be posted either on Monday or Tuesday.
Am I suspicious about this, you ask? Yes, I am -- and I'll see if they're justified when these reports do appear. But for the moment, I just upped my meds a bit until that feeling went away.
![]()
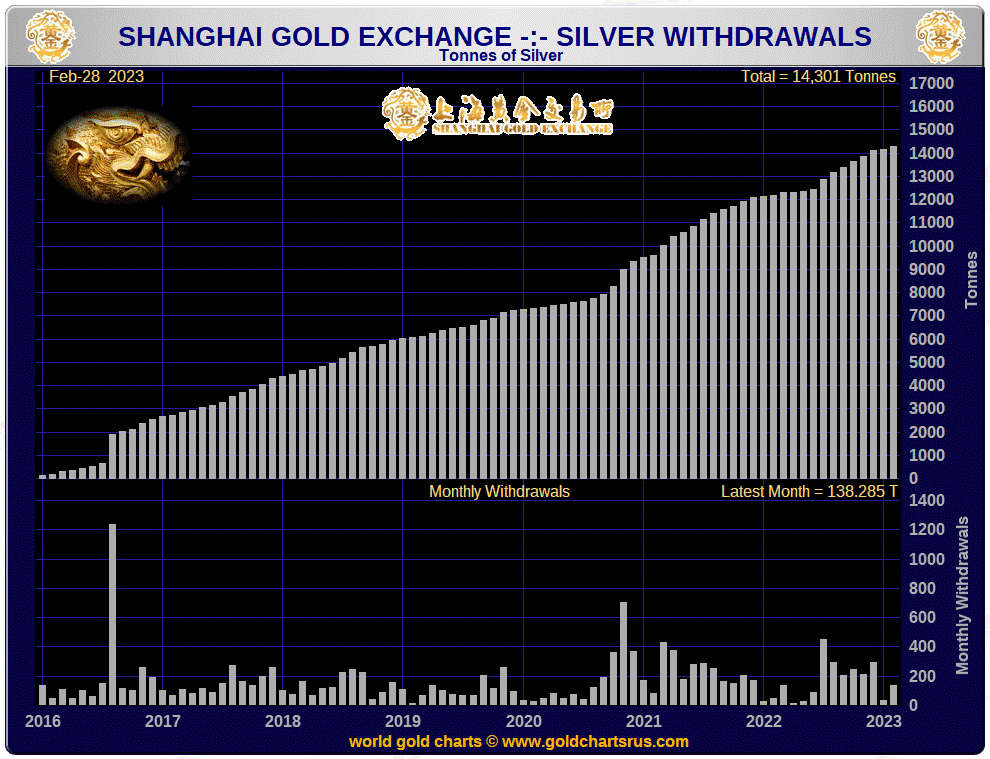
In lieu of that, I have two charts that I pulled from Nick Laird's website yesterday evening. They show gold and silver withdrawals from the Shanghai Gold Exchange, updated with February's data.
During that month there were 168.75 tonnes/5.43 million troy ounces of gold take out...plus 138.29 tonnes/4.45 million troy ounces of silver. Click to enlarge for both.

I have a very decent number of stories, articles and videos for you today, including a couple I've been saving for today's column for length reasons.
![]()
CRITICAL READS
JPMorgan’s High Risk Footprint; Bloomberg News as PR Agent for Jamie Dimon; and the Untold Story of the Failed “Rescue” of First Republic by the Mega Banks
At 6:33 a.m. this morning, this big, bold headline appeared at the very top of Bloomberg News web page: “How Dimon and Yellen Helped Secure $30 Billion Lifeline for First Republic.” This headline is part of a very long, highly questionable promotion of Jamie Dimon by Bloomberg News as the wunderkind of Wall Street banking.
In reality, under Dimon’s tenure as Chairman and CEO, JPMorgan Chase has been on an unprecedented crime spree, including being charged with five felony counts by the U.S. Department of Justice, and his bank is annually ranked by U.S. banking regulators as well as the Basel Committee on Banking Supervision as the riskiest bank on the planet.
This morning’s headline at Bloomberg News was clearly meant to suggest that Dimon was the modern reincarnation of John Pierpont (J.P.) Morgan, who famously came to the rescue during the financial panic of 1907 with a private pool of money. The Bloomberg headline refers to the fact that JPMorgan Chase, along with Bank of America, Citigroup and Wells Fargo, each ponied up $5 billion to place as uninsured deposits into the teetering First Republic Bank, which has lost 72 percent of its market value year-to-date (as of yesterday’s close). The balance of the $30 billion came from seven additional banks.
The Federal Deposit Insurance Corporation (FDIC) caps federal deposit insurance at $250,000 per depositor, per bank. The stock market looked at the teacup of $30 billion in rescue money, weighed it against the tsunami of facts in First Republic’s regulatory filings which showed, among other things, that the bank at year end had total deposits of $176.25 billion, of which $119.47 billion (or 68 percent) were uninsured by the FDIC, and said to itself, the last thing First Republic Bank needs is more uninsured deposits. The stock of First Republic Bank (ticker FRC) fell 14.7 percent in after-hours trading.
This commentary from Pam and Russ Martens showed up on the wallstreetonparade.com Internet site on Friday -- and I thank Brad Robertson for sharing it with us. Another link to it is here. A related Zero Hedge story, also courtesy of Brad, is headlined "Buyers Emerge For First Republic Bank After Big-Bank Bailout: Report" -- and linked here.
![]()
Fed's emergency bank lending soars to new record
Emergency loans to banks spiked to a new record in the week through Wednesday, surpassing previous highs reached during the 2008 financial crisis.
Why it matters: The details came in a weekly Federal Reserve report released Thursday, which is sure to attract more attention for what it may reveal about stresses in the banking system after the failures of Silicon Valley Bank and Signature Bank.
By the numbers: As of Wednesday, banks had $153 billion in loans at the "discount window," a longstanding tool through which the Fed provides cash to banks in need of liquidity by lending against solid collateral.
- The previous record for discount window borrowing was $111 billion in 2008. It also reached $51 billion in the early days of the pandemic.
- Banks also had $12 billion in credit from the Bank Term Funding Program, announced Sunday night, to make bank lending available on highly favorable terms. The report does not say which (or how many) banks tapped the facility and won't do so for another year.
- The Fed also extended $143 billion to support the FDIC's guarantee of all depositors in failed Silicon Valley Bank and Signature Bank.
Between the lines: Banks looking to access loans through the emergency facility can pledge long-term securities like Treasury bonds at their original value, allowing them to borrow against that even if those assets have fallen in value.
This brief article appeared on the axios.com Internet site on Thursday -- and I thank Swedish reader Patrik Ekdahl for pointing it out. Another link to it is here.
![]()
"What Else Can it Do?": Credit Suisse Deposit Run Continues Despite SNB Rescue
We knew this was the endgame more than two weeks ago when we reported that "Credit Suisse Crashes To All Time Low After Boosting Deposit Rates To Reverse Bank Run" in which we reported that after a quarter of "staggering" bank runs, the second largest Swiss bank - clearly panicking - was offering a 6.5% annual rate on new three-month deposits of $5 million or above - and a rate as high as 7% for one-year deposits - far above matched maturity Bills, and suggesting that to attract a client, the bank is forced to eat a loss.
The hope, we explained, "was that after it attracts enough new clients, the bank will then be able to quietly lower the rates and make the new accounts profitable, however as the various DeFi blow ups of 2022 showed, it never quite works out that way."
This time was no different, and as the bank run accelerated, the Swiss bank ended up getting an (interim) $50 billion rescue financing from the SNB to cover the most recent deposit run, and it will get much more before it's all said and done. To underscore this point, two days ago - in our post summarizing the SNB bailout - we said that "this is a last-ditch liquidity infusion, and all it does is prevent forced asset liquidations (a la SVB). Meanwhile it does nothing to halt the depositor flight because once confidence is gone, it rarely returns."
Again we were right, and one day after the failed bailout attempt, Bloomberg writes that while the $54 billion lifeline won by Credit Suisse on Thursday gives it a fighting chance to rebuild its business, "some clients aren’t waiting around to find out how that goes."
This Zero Hedge article was posted on their Internet site at 10:30 a.m. on Friday morning EDT -- and I thank Brad Robertson for sending it our way. Another link to it is here. A directly related Bloomberg story was posted on the yahoo.com Internet site yesterday afternoon after the markets closed, headlined "UBS to Explore Credit Suisse Deal in Crisis Combination" -- and I found that in a GATA dispatch. The link to that is here.
![]()
It is commonly believed that the “Great Financial Crisis” could have been avoided had the Federal Reserve bailed out Lehman Brothers. This is along the same lines as the Milton Friedman/Ben Bernanke thesis, that the Great Depression was the result of the Fed’s failure to print sufficient money to recapitalize the U.S. banking system. It’s a central tenet of CBB analysis that “money” – monetary inflation – is the problem, not the solution.
Bernanke concluded his November 8th 2002 speech, “On Milton Friedman’s Ninetieth Birthday”: “I would like to say to Milton and Anna [Schwartz]: Regarding the Great Depression. You’re right, we did it. We’re very sorry. But thanks to you, we won’t do it again.”
Federal Reserve total assets were $836 billion when Bernanke became Fed Chairman in February 2006. Fed assets had inflated five-fold to $4.0 TN by the end of his term (Feb. 2014) –on the way to a peak of $8.97 TN in April of last year (10-fold increase in 14 years!).
Federal Reserve Total Assets surged $297 billion last week to $8.639 TN, in one week reversing four months – and over half - of recent QT (quantitative easing). A $10 TN balance sheet by year end would not be surprising.
I appreciate that officials last weekend believed they needed to ensure all SVB and Signature depositors to stem a potential systemic bank run. Just as the Bernanke Fed had justification for opening the floodgate for unprecedented money printing; the Yellen Fed for holding the policy rate below 1% until June 2017; the Powell Fed restarting QE in non-crisis September 2019 (unemployment rate multi-decade low 3.6%); and the Fed to full-throttle the printing presses for $5 TN during the pandemic, while holding rates at zero well into 2022 in the face of surging inflation.
Where does it all end? For one thing, the Fed’s balance sheet will be getting much larger. I’ll assume global central bank balance sheets will also inflate. Gold surged $121 this week, second only to the $130 weekly surge in late-March 2020.
How can it not be a “blanket government guarantee”? So, Washington will bail out wealthy depositors at SVB and Signature and deny the same treatment to depositors when more traditional banks begin to fail?
Yes, precisely, dear reader...very well put. Doug's weekly commentary is always a must read for me -- and that is certainly the case this week. It was posted on his website very shortly after midnight PDT on Saturday morning -- and another link to it is here. Gregory Mannarino's sometimes mildly "ADULT" rated post market close live rant for yesterday is linked here -- and lasts for 33 minutes. I thank Brad Robertson for this.
![]()
Credit chaos -- Alasdair Macleod
Following the day-to-day twists and turns of a banking crisis can make us lose sight of the bigger picture. It is tempting to think that the banking authorities are in control, and they will secure the integrity of their commercial banking networks. Unfolding events may or may not prove this to be true.
The bigger picture is that the forty-year decline in interest rates is over, as well as the financial bubble that has built up with it. And we should also be aware that there is a cycle of bank credit, the downturn of which is long overdue. The two have come together to create chaos in credit markets.
The reality is that central banks have already lost control over monetary policy and interest rates. Interest rates are now being driven by contracting bank credit, not by monetary policy. The point which is commonly missed is that contracting credit at a time when credit demand is still increasing inevitably leads to higher interest rates and bad debts.
Having lost control over interest rates, the Fed has been forced into its much-heralded pivot, not by reducing interest rates, but by offering to buy Treasury and Agency debt at face value whatever the coupon and maturity. This rescues banks from the immediate fate that collapsed Silicon Valley Bank. And it makes it easier for the US Treasury to fund its deficit while containing borrowing costs.
But it is highly inflationary.
The pivot has now been made. The Fed has decided to rescue financial markets at the expense of the currency. Other central banks can be expected to follow suit to help rescue their banking systems. But in the process, they are writing the death warrants for their fiat currencies.
This short novel from Alasdair put in an appearance on the goldmoney.com Internet site on Wednesday -- and I've been saving it for today's column. I found it embedded in a GATA dispatch -- and another link to it is here. There's also this 44-minute video interview with Alasdair -- and that's linked here. I thank George Whyte for that one.
![]()
LME rocked by new nickel scandal after finding bags of stones
The London Metal Exchange has discovered bags of stones instead of the nickel that underpinned a handful of its contracts at a warehouse in Rotterdam, in a revelation that will deliver another blow to confidence in the embattled exchange.
The amount of metal represents just 0.14% of live nickel inventories on the LME, worth about $1.3 million at current prices, so the immediate impact on metals markets is limited. But the shock announcement has much wider implications: in an industry riddled with scandals, the LME’s contracts are viewed as unquestionably safe. The news that even a few of them have been compromised will raise fresh questions about its systems and procedures while the 146-year old exchange is still wading through the fallout of its last nickel crisis.
“LME warehouse warrants used to be the gold standard of warehouse warrants around the world, treated as a near-cash equivalent,” John MacNamara, chief executive officer of Carshalton Commodities Ltd. and a veteran commodity trade finance banker, wrote on LinkedIn. “Something has gone horribly wrong at the LME.”
It also comes at a fraught time for the wider metals world, after trading giant Trafigura Group revealed in February that it had been the victim of a vast alleged fraud involving missing nickel cargoes. The news that a powerful player like Trafigura is facing hundreds of millions of dollars in losses has spooked others in the industry and prompted some to check on their own metal cargoes.
This Bloomberg story was picked up by the mining.com Internet site at 10:01 a.m. on Friday morning EDT -- and I found it on the gata.org Internet site. Another link to it is here.
![]()
Chinese Gold Demand Continued to Surge in February
After ending 2022 on an upward trend that continued into January, Chinese gold demand surged again in February as the economy continues to rebound from government-imposed COVID policies.
Gold withdrawals from the Shanghai Gold Exchange (SGE) totaled 169 tons in February. This is a reflection of strong wholesale demand and signals an ongoing rebound in the world’s biggest gold market.
SGE withdrawals in February were up by 30 tons month-on-month and by a healthy 76 tons year-over-year. It was the strongest February for wholesale gold demand since 2014.
The World Gold Council pinpointed two primary drivers of strong demand for gold in February.
- Healthy consumption amid the economic recovery and the release of pent-up demand
- Retailers’ restocking activities after the Chinese New Year (CNY) holiday
The Shanghai-London gold price premium also continued to pick up in February, reflecting strong Chinese gold demand during the month.
This gold commentary from the SchiffGold.com Internet site was posted on Zero Hedge at 8:30 a.m. EDT on Friday morning -- and another link to it is here. I thank Brad Robertson for sharing it with us.
![]()
Fear of Collapse is Driving People to Gold and Silver -- an Interview with Andy Schectman
This 37-minute rant/commentary/interview from Friday was posted on the youtube.com Internet site the same day -- and I thank Robert in Denver for sending it our way. Another link to it is here.
![]()
The Photos and the Funnies
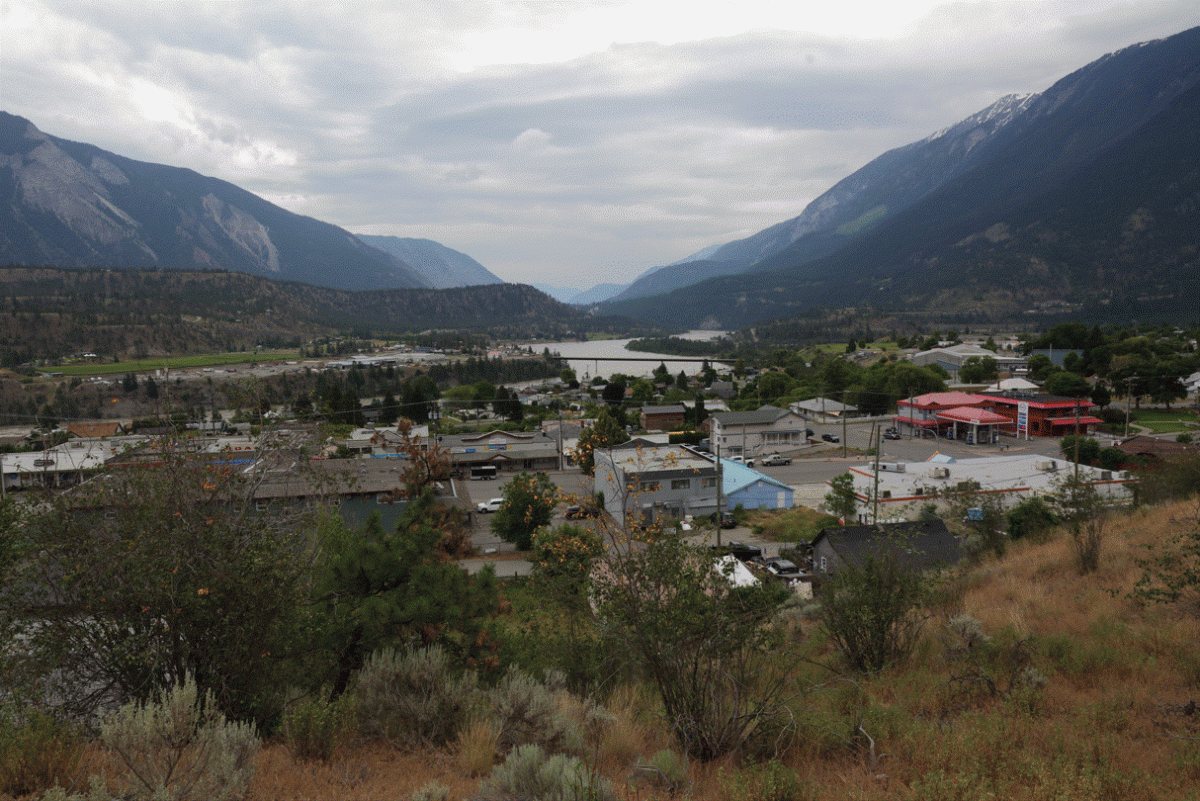
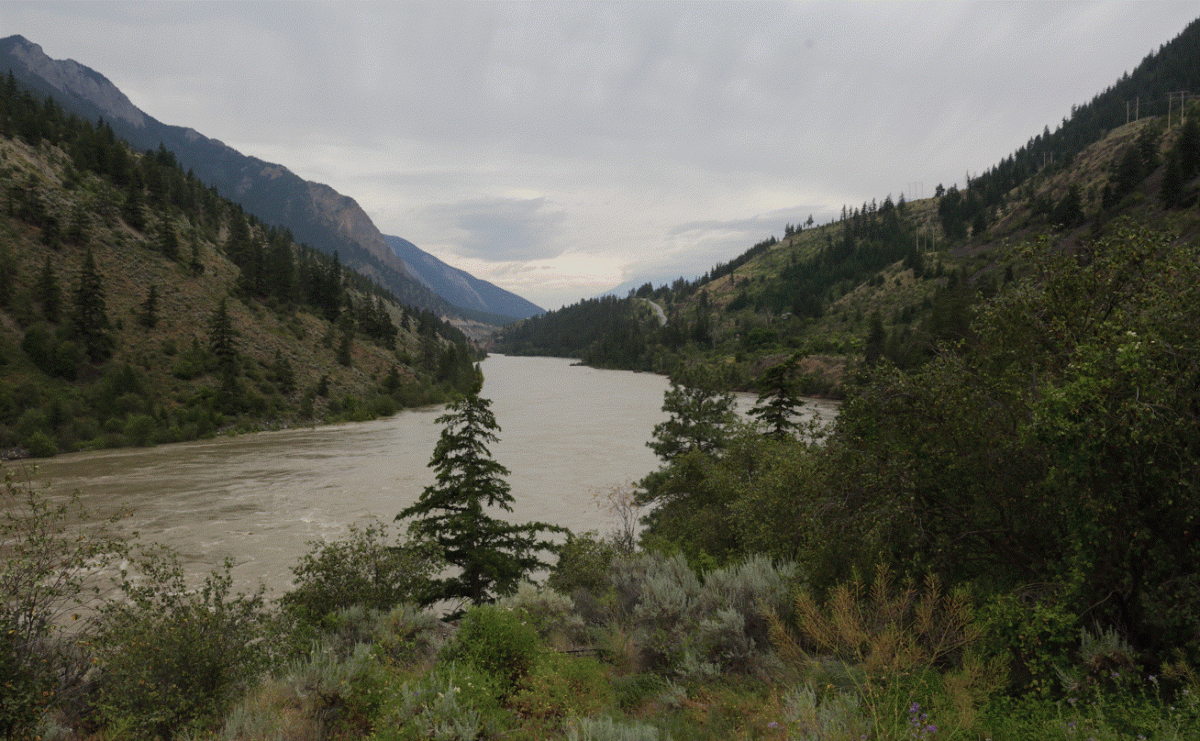
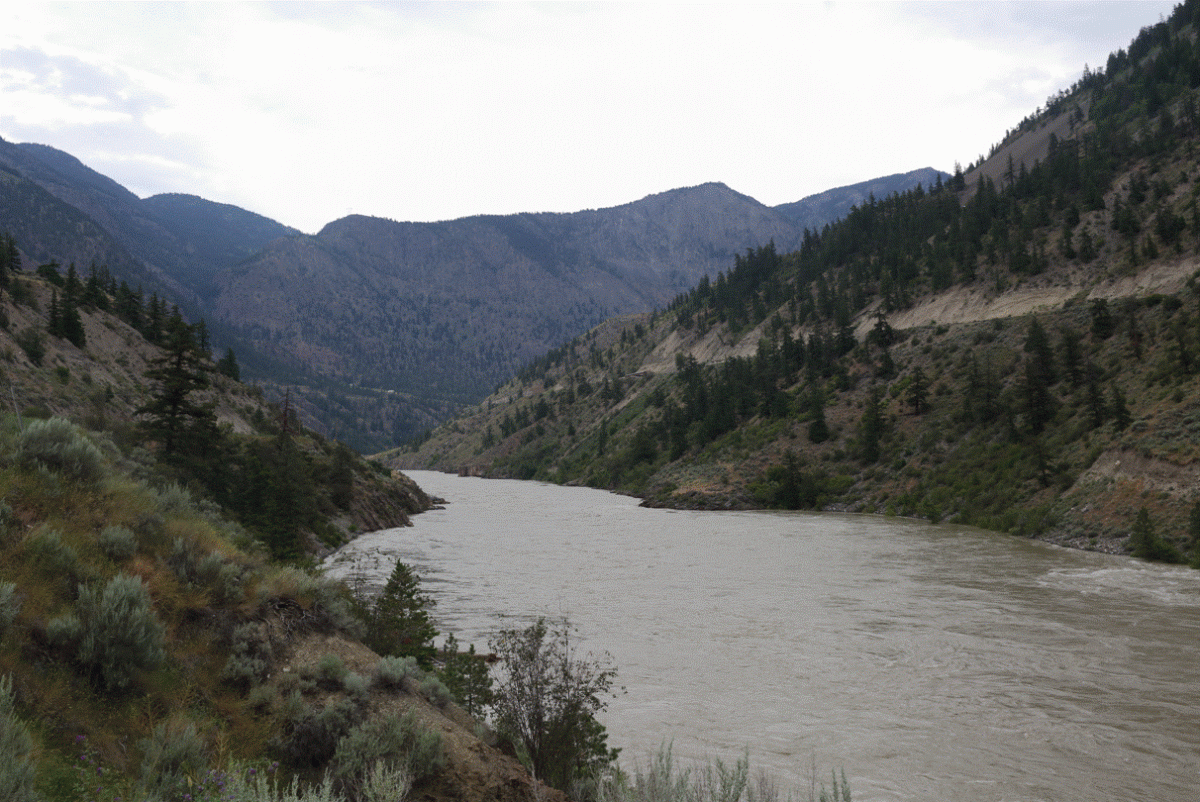
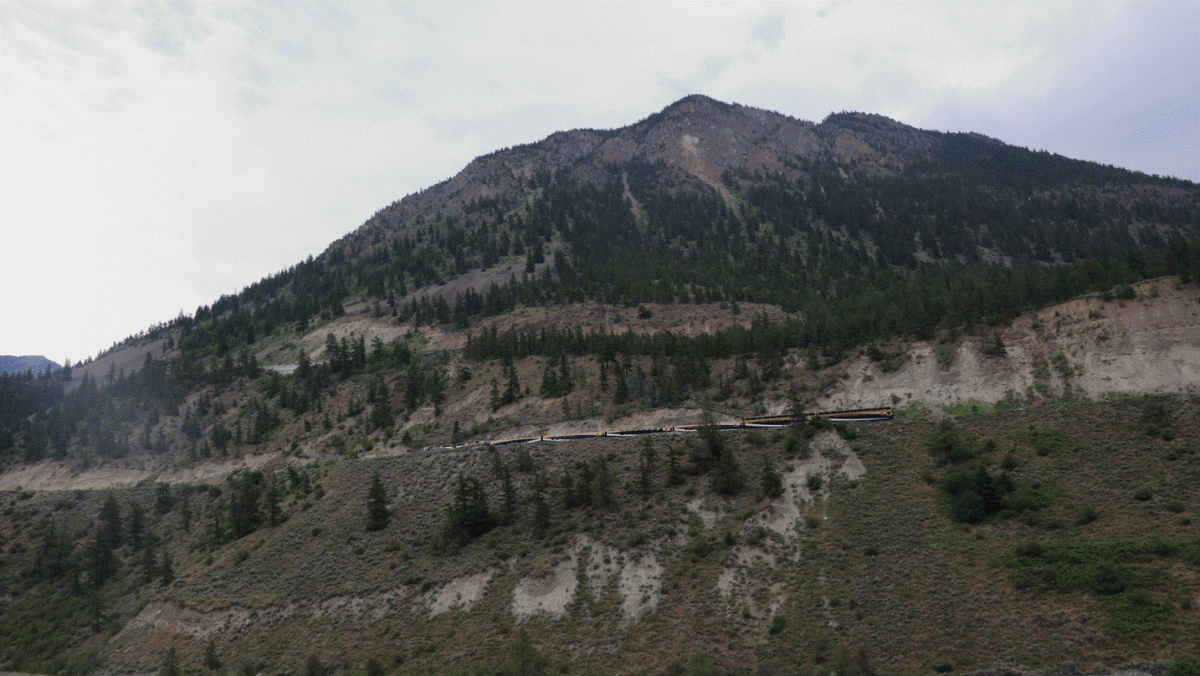
We woke up on July 3 -- and headed out. A frontal system had passed through during the night -- and it was much cooler, thankfully...but overcast. The first shot was one more I took overlooking Lillooet -- and we then headed north to where the Bridge River flows into the Fraser -- and I took the last three photos along the way, looking down and up the Fraser River. The fourth shot shows the famed Rocky Moutaineer as it crawls along the CN Rail track bed on its way to Jasper in Alberta. Click to enlarge.
![]()
The WRAP
"Understand this. Things are now in motion that cannot be undone." -- Gandalf the White
![]()
Today's pop 'blast from the past' was written by the same person the wrote and performed last week's pop 'blast from the past' -- and that was Barry Gibb of the Bee Gees, because he was commissioned to do the work. Frankie Valli [of Four Seasons fame] was approached to provide the vocals, due to his vocal range being similar to that of Gibb -- and his status as a popular singer from the pre-British Invasion era that the song represented. Gibb had a long-standing respect for Valli as "one of the hallmark voices of our generation".
The rest, as they say, is history. It was a No. 1 hit just about everywhere on Planet Earth in 1978 -- and sold 7 million copies. You should know it instantly -- and the link is here. The bass line in this tune is a prominent part of the song -- and that's linked here.
Since spring in the northern hemisphere is only three days away, today's classical 'blast from the past' reflects that. It's Antonio Vivaldi's Concerto No. 1 in E major, Op. 8, RV 269, "Spring".
Here is the San Francisco-based Voices of Music featuring Alana Youssefian as soloist -- and the link is here.
![]()
Gold closed on its high tick of the day in after-hours trading yesterday afternoon -- and well above any moving average that matters. It's also showing a bit overbought on its RSI trace on its 6-month chart below.
Silver also closed on its high of the day in after-hours trading in New York yesterday afternoon. It closed above its 50-day moving average by 4 cents at the COMEX close...finally...and further above it by the time trading ended at 5:00 p.m. EDT. It's not even close to being overbought yet.
Gold volume was pretty awesome -- and total open interest blew out by quite a bit as I mentioned earlier. The Managed Money traders et al. were most certainly buying longs and covering shorts -- and Ted's raptors, the small commercial traders other than the Big 8 shorts, were selling long positions to them for big profits. The $64,000 question is...what were the Big 4/8 commercial shorts doing? Sitting on their hands, hopefully -- and letting the raptors do all the work.
Silver's volume was only slightly elevated, which was quite amazing -- and its increase in total open interest was fumes and vapours...nothing much at all -- and even more surprising. I'll certainly be interested in getting a look at the next COT Report -- and I'm more than miffed that it was 'delayed'.
At its high tick in GLOBEX trading overseas, platinum blew through its 50-day moving average, but the commercial traders of whatever stripe showed up -- and closed it well below it. Palladium's price was also engineered lower -- and was closed down for the third straight day.
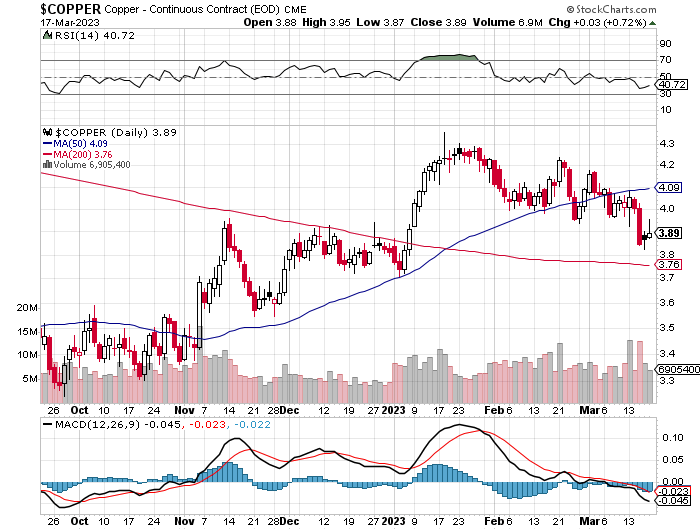
Copper traded as high as $3.95 yesterday, but was closed at $3.89/pound...up only 3 cents.
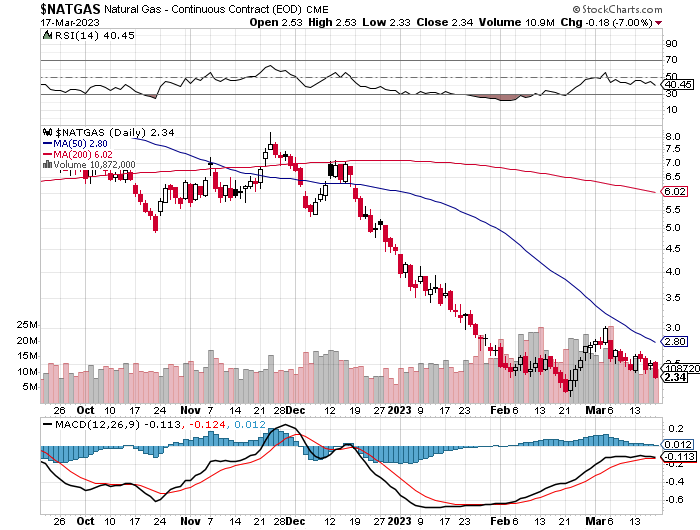
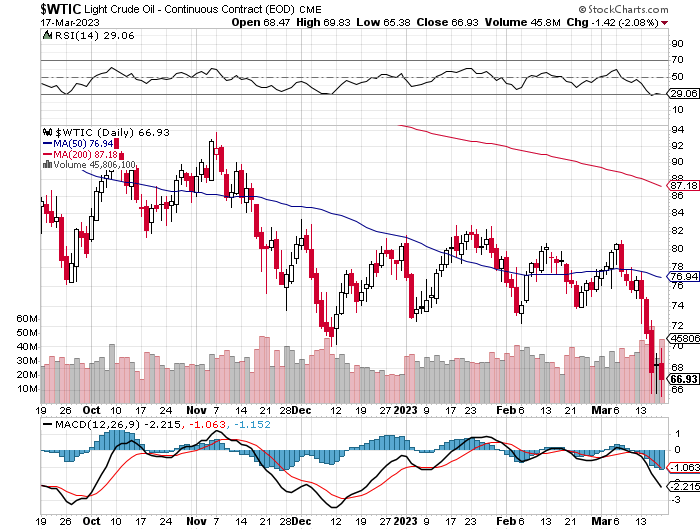
Natural gas [chart included] continues its quite price trend lower. It finished the Friday trading session at $2.34/1,000 cubic feet...down another 18 cents/7.00%. WTIC also had a losing day, as it was closed lower by $1.42 at $66.93/barrel.
Here are the 6-month charts for the Big 6+1 commodities, thanks to the fine folks over at the stockcharts.com Internet site -- and yesterday's closing prices in their current front months should be noted. Click to enlarge.
I mentioned further up in today's column -- and almost every week, that there was lots of retail silver and gold around -- and that sales had softened up so much that premiums were the lowest they'd been in many, many years... something that Andy Shectman had also been pointing out in his recent videos.
Well, those days are gone. The premiums are back -- and inventories are vanishing at an unprecedented rate. Although I don't know for sure, I suspect that all the mints, both domestic and private, are back to running flat out once more...except for the U.S. Mint, of course.
And as I've pointed out quite frequently, retail supply is limited to what these mints can produce...regardless of demand. Those that are early will get what's left of available inventory -- and after that it will hand-to-mouth...with a return to wild premiums...and even wilder demand.
As Andy correctly pointed out in the video interview in the Critical Reads section above...the last couple of years of over-the-top retail buying was based on greed. Now the public is buying because of of fear...which is a far greater motivator than greed.
I've been mentioning for many years now that there will come a tipping point, when investors take the leap from all thing paper and fiat -- and into hard assets...gold and silver in particular. I'm sure you'll excuse me for thinking that that day has arrived.
Of course the central banks of the world have been scarfing up gold in ever-increasing quantities, around 1,136 tonnes last year -- and with these banking issues that started about ten days ago, it's a given that their physical gold purchases in size, have accelerated as well.
One has to wonder just how much gold is left at the COMEX, LBMA and at the various and sundry ETFs that can be purchased at current prices. Once the central banks have the world have taken all they can, there won't be any left at anywhere near the price it is now. We're already beyond that point in silver -- and have been for a long time.
One also has to wonder if all banks...U.S. or otherwise...regardless of size, are now too big to fail -- and have to bailed out for systemic reasons. However, it now appears that it will be a political decision as to which banks will be saved -- and which ones won't. And if you want to hear it right from the horse's mouth, listen to what Yellen has to say starting at the 1:18 minute mark in this must watch video clip that Pete Weddell sent our way yesterday. Let's see how long that policy lasts.
The world's central banks now have another problem...interest rates. Another interest rate hike at next week's FOMC meeting could put even more banks in financial jeopardy -- and not just in the U.S. But if the Fed gives in to the markets and does not raise rates, there's no question in anyone's mind that their fight against inflation will be dead in the water. The U.S. dollar will bear the brunt of that, being the world's reserve currency and all...however no country's currency will be immune -- and the run to hard assets will accelerate.
Governments and the banking system, along with their toadies in the main stream media, have been working overtime trying to convince "We, the people..." that they have everything under control -- but we know they lie about other things too.
There's no question that more bank failures are in our future, both at home and abroad -- and the bank failures we've had to date, have been of the Hemingway variety..."slowly at first...then suddenly."
They say that there's no run like a bank run -- and no rush like a gold rush. We're living through the beginnings of that scenario in real time right now. This one has started out "slowly at first"...but in this era of instant electronic communication, everyone with a cell phone and a brokerage account...of which there are legions around the world...are in a position to turn the flight from paper assets to precious metals into a stampede in a New York minute.
As I said further up in this missive..."from a COMEX futures market perspective, its very bullish for gold -- and white-hot incandescent for silver."
I await the Sunday 6:00 p.m. EDT open in New York with some interest -- and wonder if the Plunge Protection Team will be waiting...or not.
I've never been as content to be "all in" in the precious metals as I am right now -- and will remain that way to whatever end.
I'm done for the day -- and the week -- and I'll see you here on Tuesday.
Ed
About the author

SUBSCRIBE: https://edsteergoldsilver.com/

Ed Steer’s Daily Analysis of the Gold and Silver Markets
After eight years of writing about the precious metals for Casey Research, the folks at Stansberry & Associates—who just recently purchased controlling interest in the company—decided that my ‘niche market’ column didn’t fit into their plans.
Since the time that Casey Research was kind enough to offer me a stand-alone column, it became their most highly-rated blog almost from the outset—and has remained that way up to this date...