As the global stock markets continue to crash, demand for precious metals will continue to increase. Already, the U.S. Mint had to ration Silver Eagles sales due to a shortage of silver blanks. Sales of Silver Eagles in a little more than a week have reached nearly five million oz.
While Silver Eagle sales in January are normally very high compared to the rest of the year, initial sales this month are starting off with a real bang. The Authorized Dealers purchased all of the four million oz of Silver Eagles allocated last week and have already taken delivery of 950,000 of the 1 million oz allotment this week. There are only 50,000 Silver Eagles remaining until next week’s allotment (Source: CoinNews.net).
As I am writing this article, the Hang Seng stock market is down 701 points and the Nikkei is off 518. I would imagine the U.S. stock indices will be deeply in the red when they open, unless the magicians at the Fed and U.S. Treasury decide to bring out their bag of tricks.
Regardless, investors are becoming quite worried about a market that makes no sense whatsoever. Even though many investors didn’t understand the fundamental valuations of the market over the past 2-3 years, when the indices were rising, they held their noses and went along for the ride. However, now that the U.S. and global markets are in free-fall, things could get down right ugly in 2016.
Forget The Paper Price Of Silver… Look At The 20 Year Change
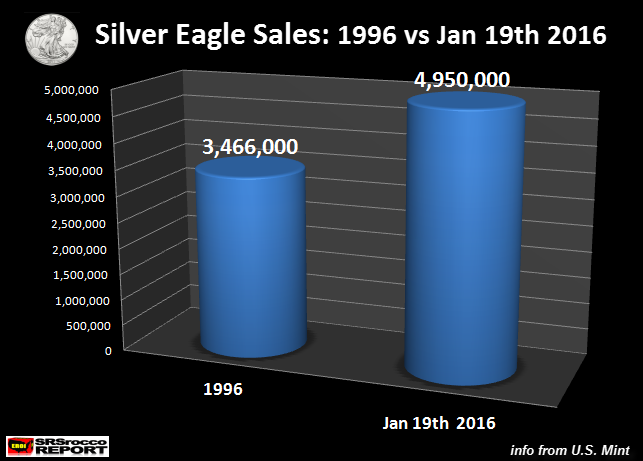
While many precious metal investors belly ache about the falling paper price of gold and silver, demand for the physical metals continues to rise…. especially silver. To get an idea of how much more physical silver investment is currently taking place, let’s look at the following chart:

In 1996, total Silver Eagle sales for the year were 3,466,000. Now compare that to the 4,950,000 Silver Eagles sold in the first half of January. We must remember, Silver Eagle sales in 2016 started on January 11th. So, in just six working days (this Monday was a holiday), the U.S. Mint sold 43% more Silver Eagles than all of 1996.
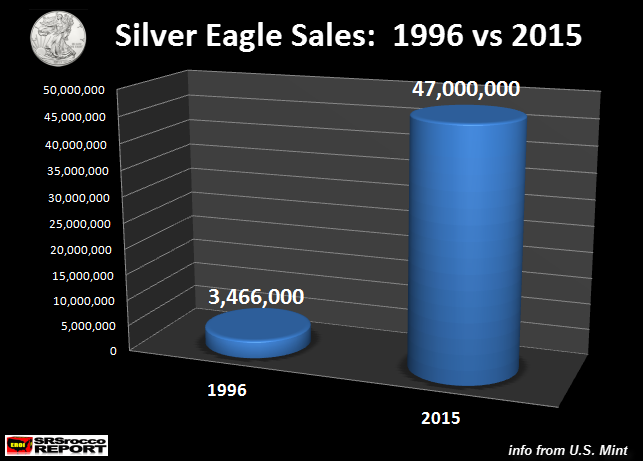
Furthermore, if we compare sales of Silver Eagles in 1996 versus 2015, this was the result:

Investors purchased a record 47 million Silver Eagles in 2015 compared to 3.5 million in 1996. Basically, investors bought 13.5 times more Silver Eagles in 2015 than they did in 1996. Even though precious metals investors are frustrated by the low paper price of silver, they fail to realize the horrible fate coming to most paper assets in the future.
The surge in physical silver investment demand indicates that intelligent minds realize it’s a rising “High-quality store of value” compared to most other paper assets trading by mindless computer algorithms.
The Key To Silver Investment: It’s A Matter Of Acquiring Ounces
The key to investing in silver is focusing on acquiring ounces and not worrying about its current paper value. The true value of silver has been masked by the “Massive financialization of Paper Garbage” on the poor slobs in the United States and the rest of the world. Now, when I say “slob”… I don’t mean to be derogatory. In many ways, I am also a poor slob when it comes to the Fed’s policies that enrich the 1% while destroying the middle class.
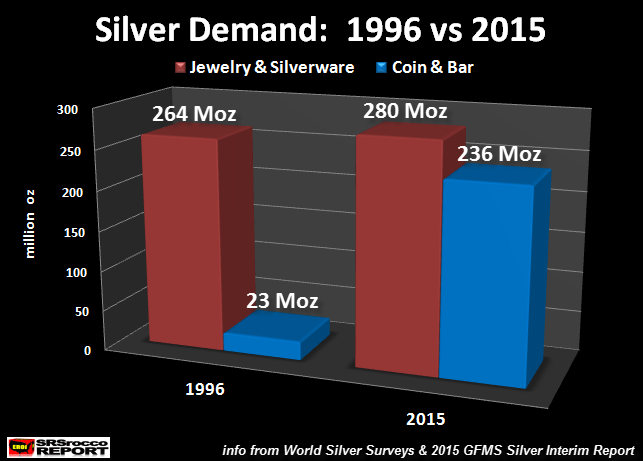
That being said, investors are acquiring a record amount of physical silver to try to hedge against the collapse of the Greatest Financial Ponzi Scheme in history. This next chart compares the 20-year change of silver investment versus Jewelry and Silverware demand:

In 1996, total global Silver Coin and Bar investment was only 23 million oz (Moz) versus 264 Moz of Jewelry & Silverware. However, 20 years later… we see a much different picture. While global Jewelry & Silverware demand increased to 280 Moz, Silver Coin & Bar investment surged to 236 Moz.
NOTE: GFMS who publishes the World Silver Surveys, didn’t provide silver bar demand in early years such as 1996. The figure of 23 Moz is GFMS Coin & Medal demand. I would imagine silver bar investment in 1996 was very low due to a lack of interest. Furthermore, GFMS estimates total Silver Coin & Bar demand for 2015 to be 206 Moz. I added 30 Moz to the figure due to the fact that private silver rounds and bars are not apart of the official figures. However, I had an email exchange with the folks at GFMS and they will be soon adding an annual figure for private rounds and bars. They estimate that 2015 private round and bar to be at least 30 Moz due to the huge shortages of official coins from June-Sept.
Unfortunately, investors are under the trance that deflation will be bad for silver as the paper price could fall further. While this is true, I believe the downside of silver is much less than the broader stock markets such as the Dow Jones which is only off 12% from its peak last year. Silver is down 71% from its peak of $49 in 2011.
We have already witnessed the majority of Deflation in the precious metals, however the Bloodbath in the broader stock markets is just beginning. Hedge Fund and Institutional investors better wake up and realize stock valuations, dividends and yield will only head south going forward.
The DEATH OF YIELD IS COMING. Unfortunately, there are only a few wise investors who continue to acquire silver while the majority play Russian Roulette in the paper markets.
Please check back for new articles and updates at the SRSrocco Report. You can also follow us at Twitter below:


