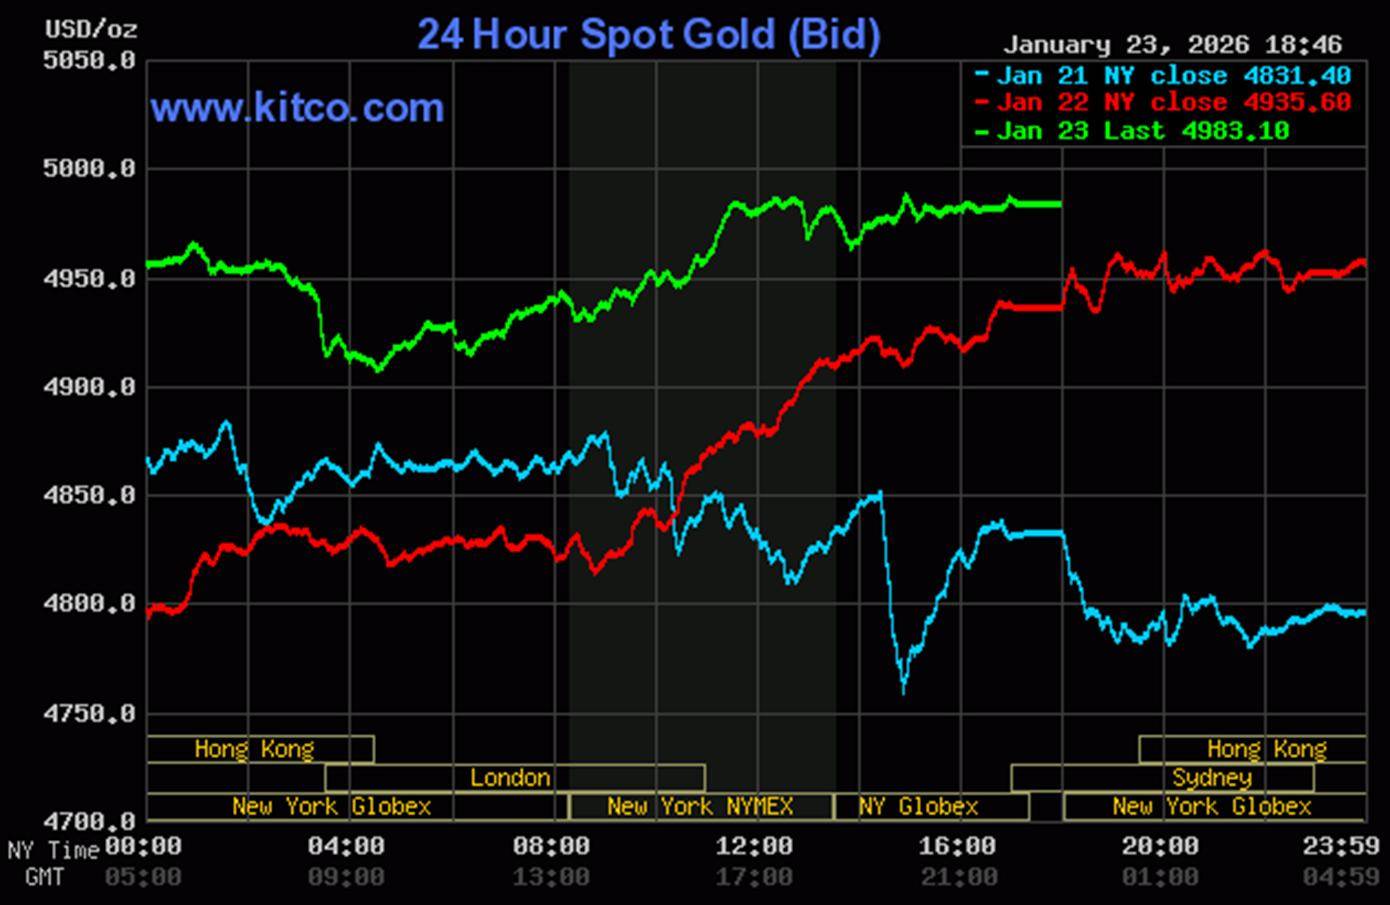
Gold's rally attempt in early Globex trading was met with resolute selling every time it tried to tick higher -- and that lasted until 2 p.m. China Standard Time on their Friday afternoon. It was then engineered lower until its low tick was set around 9:40 a.m. in London. Its ensuing quiet rally was turned sideways at 11:30 a.m. in COMEX trading in New York -- and it wasn't allowed to do much after that.
The low and high ticks in gold were reported as $4,901.20 and $4,991.40 in the February contract...an intraday move of $90.20 an ounce. The February/ April price spread differential in gold at the close in New York yesterday was a hefty $37.30...April/June was $38.00...June/August was $37.90 -- and August/October was $33.30 an ounce.
Gold was closed on Friday afternoon in New York at $4,983.10 spot...up $46.70 on the day -- and $6.00 off its Kitco-recorded high tick. Net volume was only a bit on the heavier side for the second day in a row, at around 178,500 contracts -- and there were a bit over 98,000 contracts worth of roll-over/switch volume on top of that.
I saw that 169 gold, plus 283 silver contracts were traded in January yesterday and, as is always the case, it remains to be seen just how much of these amounts show up in tonight's Daily Delivery and Preliminary Reports further down in today's column.
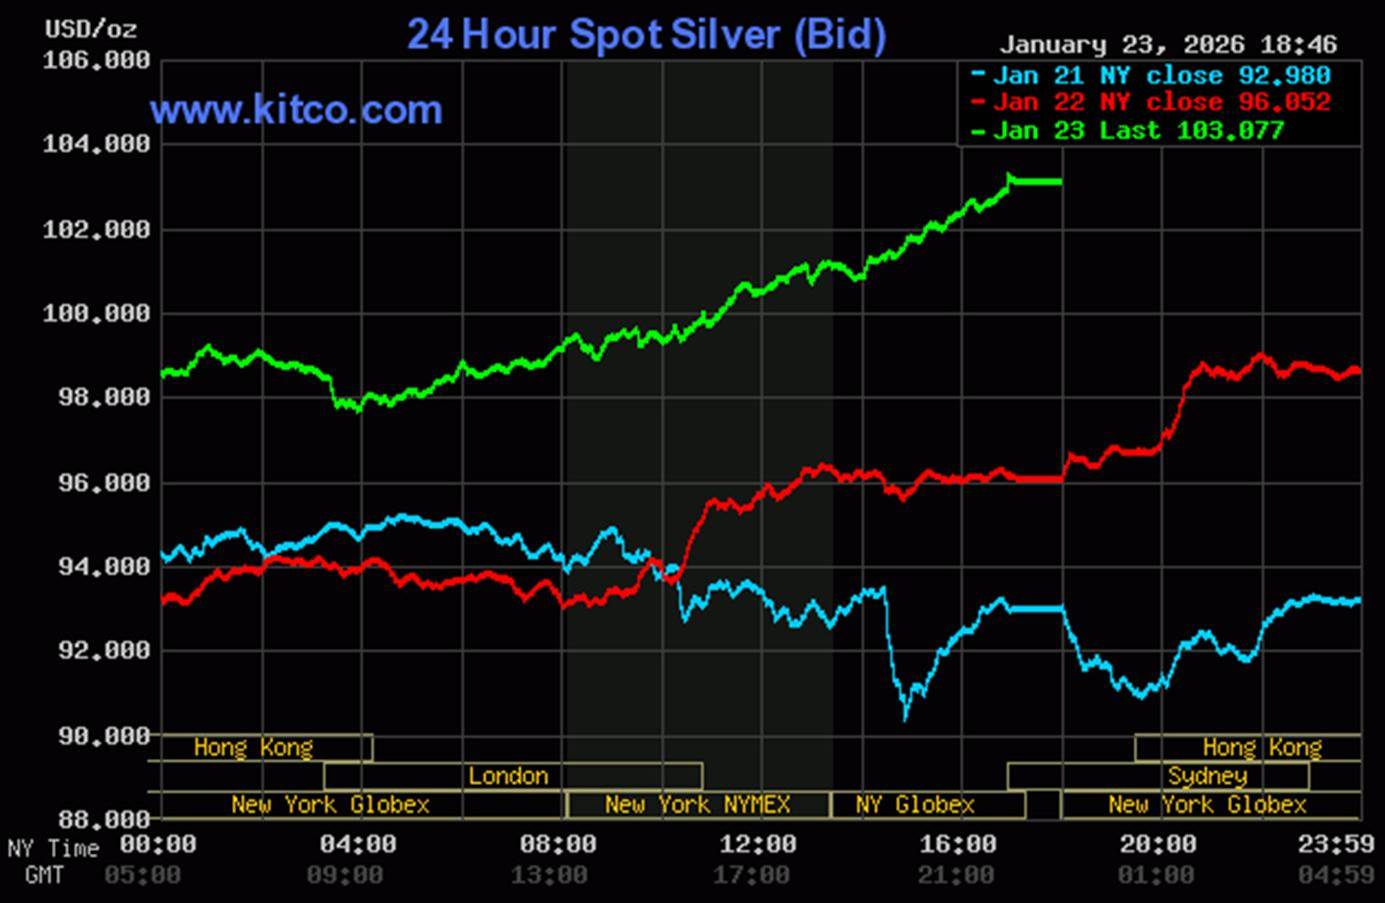
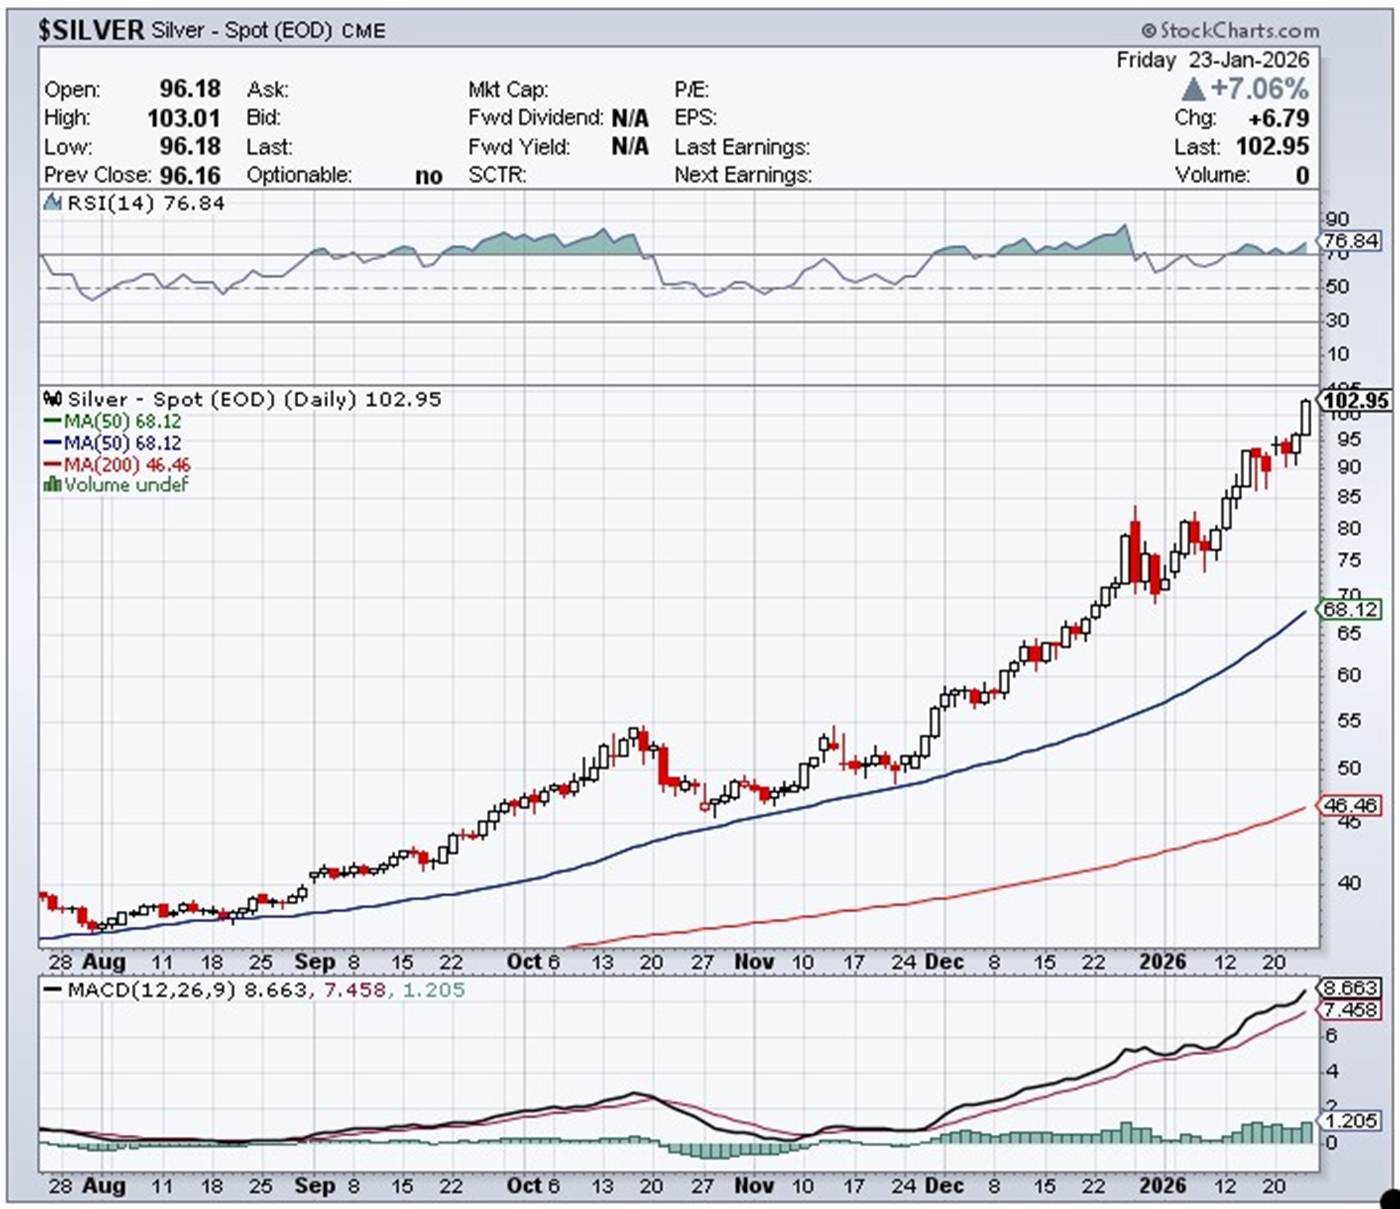
The silver price took two steps higher in early Globex trading in New York on Thursday evening -- and that lasted until around 9:45 a.m. China Standard Time on their Friday morning. From there it had a very quiet and slightly descending up/down move that lasted until 9 a.m. in London. From that juncture it began to crawl higher at an ever-increasing rate until a minute or so before trading ended at 5:00 p.m. EST.
The low and high ticks in silver were recorded by the CME Group as $96.22 and $103.53 in the March contract...an intraday move of $7.31 the ounce. The March/May price spread differential in silver at the close in New York yesterday was a knee-wobbling 78.5 cents...May/July was 77.3 cents -- and July/ September was 69.1 cents. These are the highest price spread differential numbers for silver I've ever seen. The CME Group is just bleeding the traders white on these rolls in silver -- and a bit in gold as well. Ted would have been aghast.
Silver finished the Friday trading session at $103.077 spot...up $7.02 on the day/7.31% -- and 18 cent off its Kitco-recorded high tick. Net volume was yet another impressive six-digit number at around 115,500 contracts -- and there were a bit under 24,000 contracts worth of roll-over/ switch volume in this precious metal.
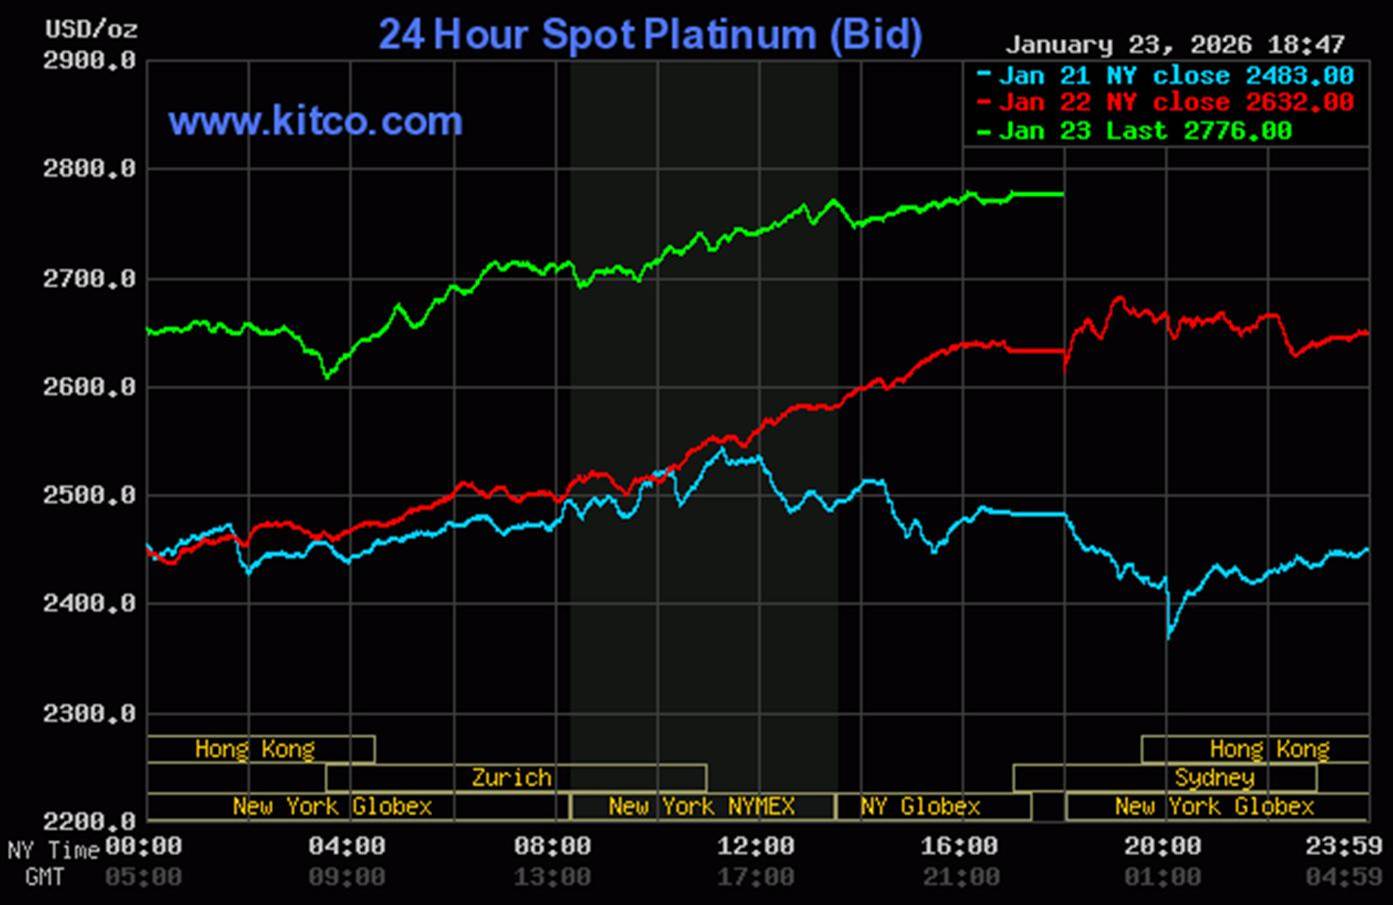
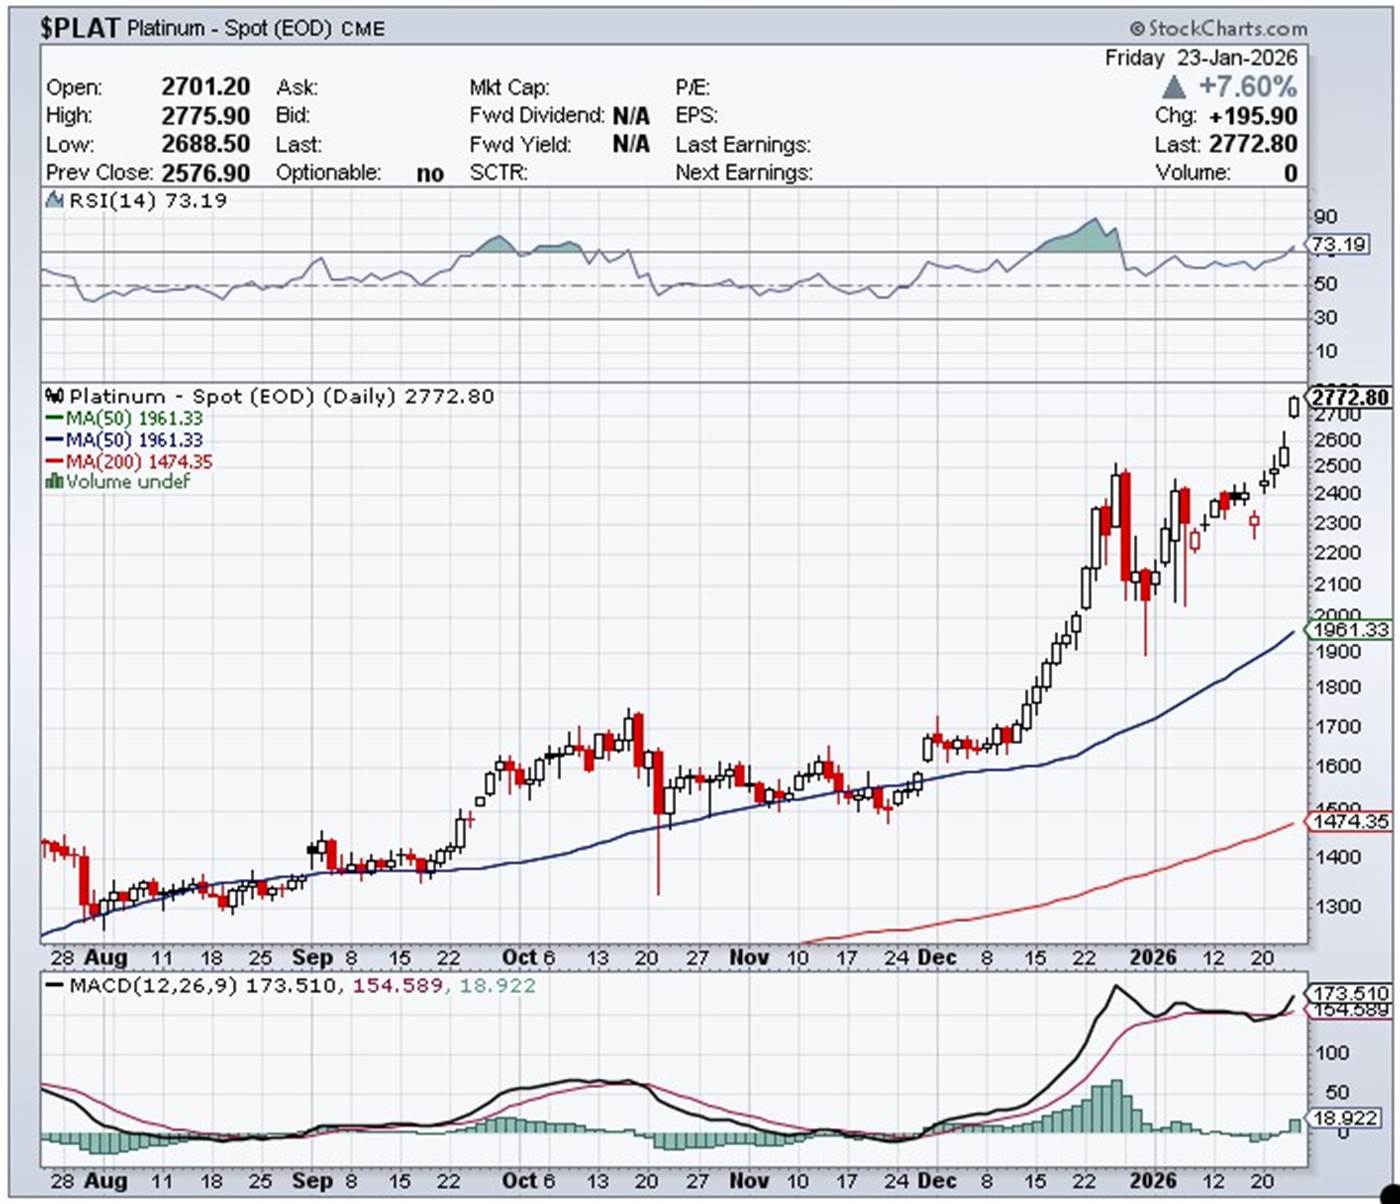
Platinum's early Globex trading rally was only allowed to last an hour -- and it then traded sideways until minutes before the Zurich open, where it was sold down to its engineered low tick around 9:35 a.m. in Zurich. It then rallied quietly and steadily at an ever-decreasing rate until the market closed at 5:00 p.m. in New York. Platinum finished the Friday trading session at $2,776 spot ...up 144 dollars on the day -- and only 3 bucks off its Kitco-recorded high tick.
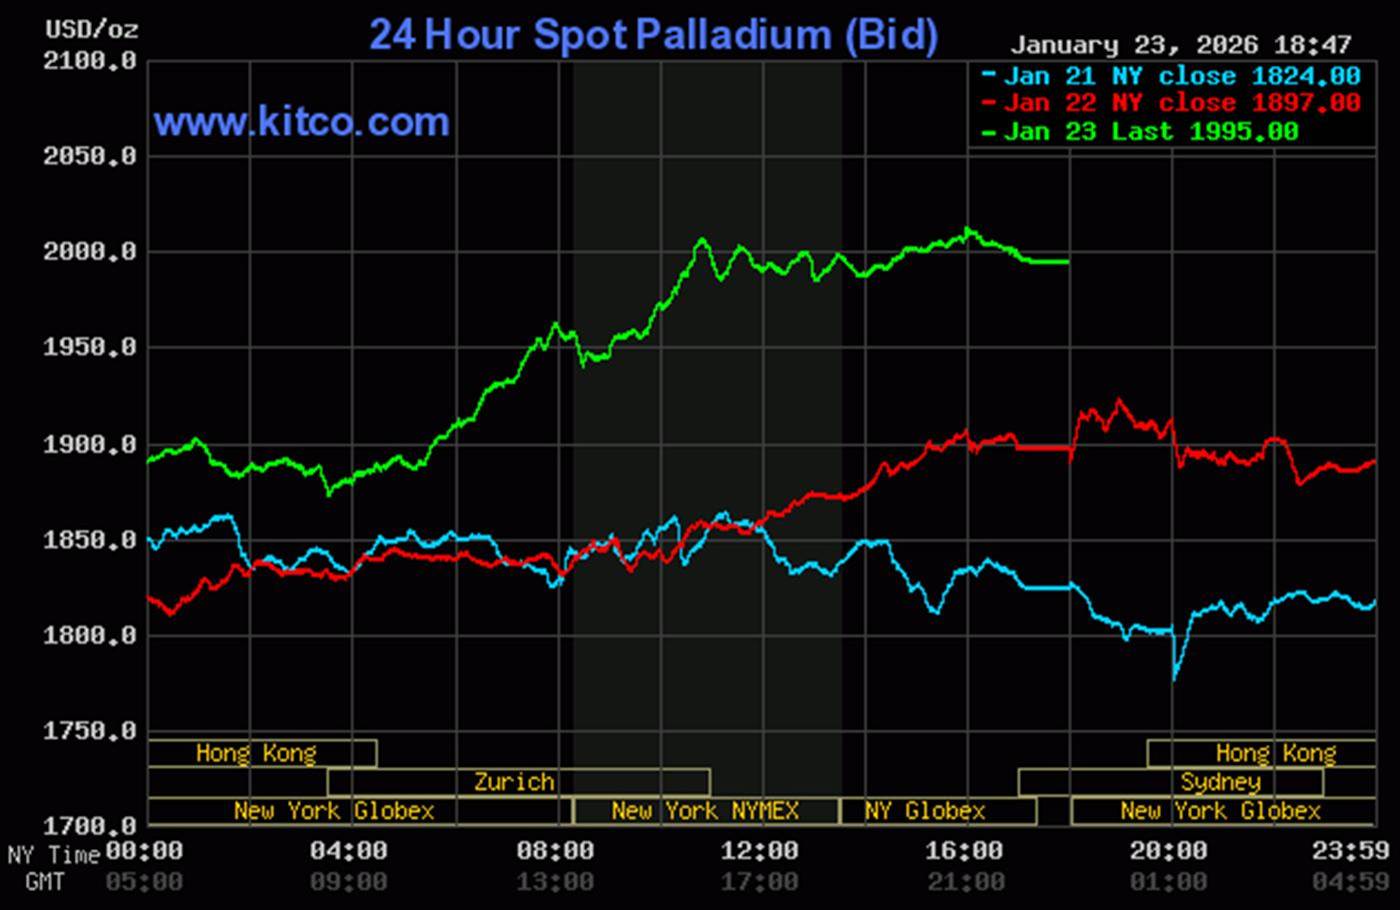
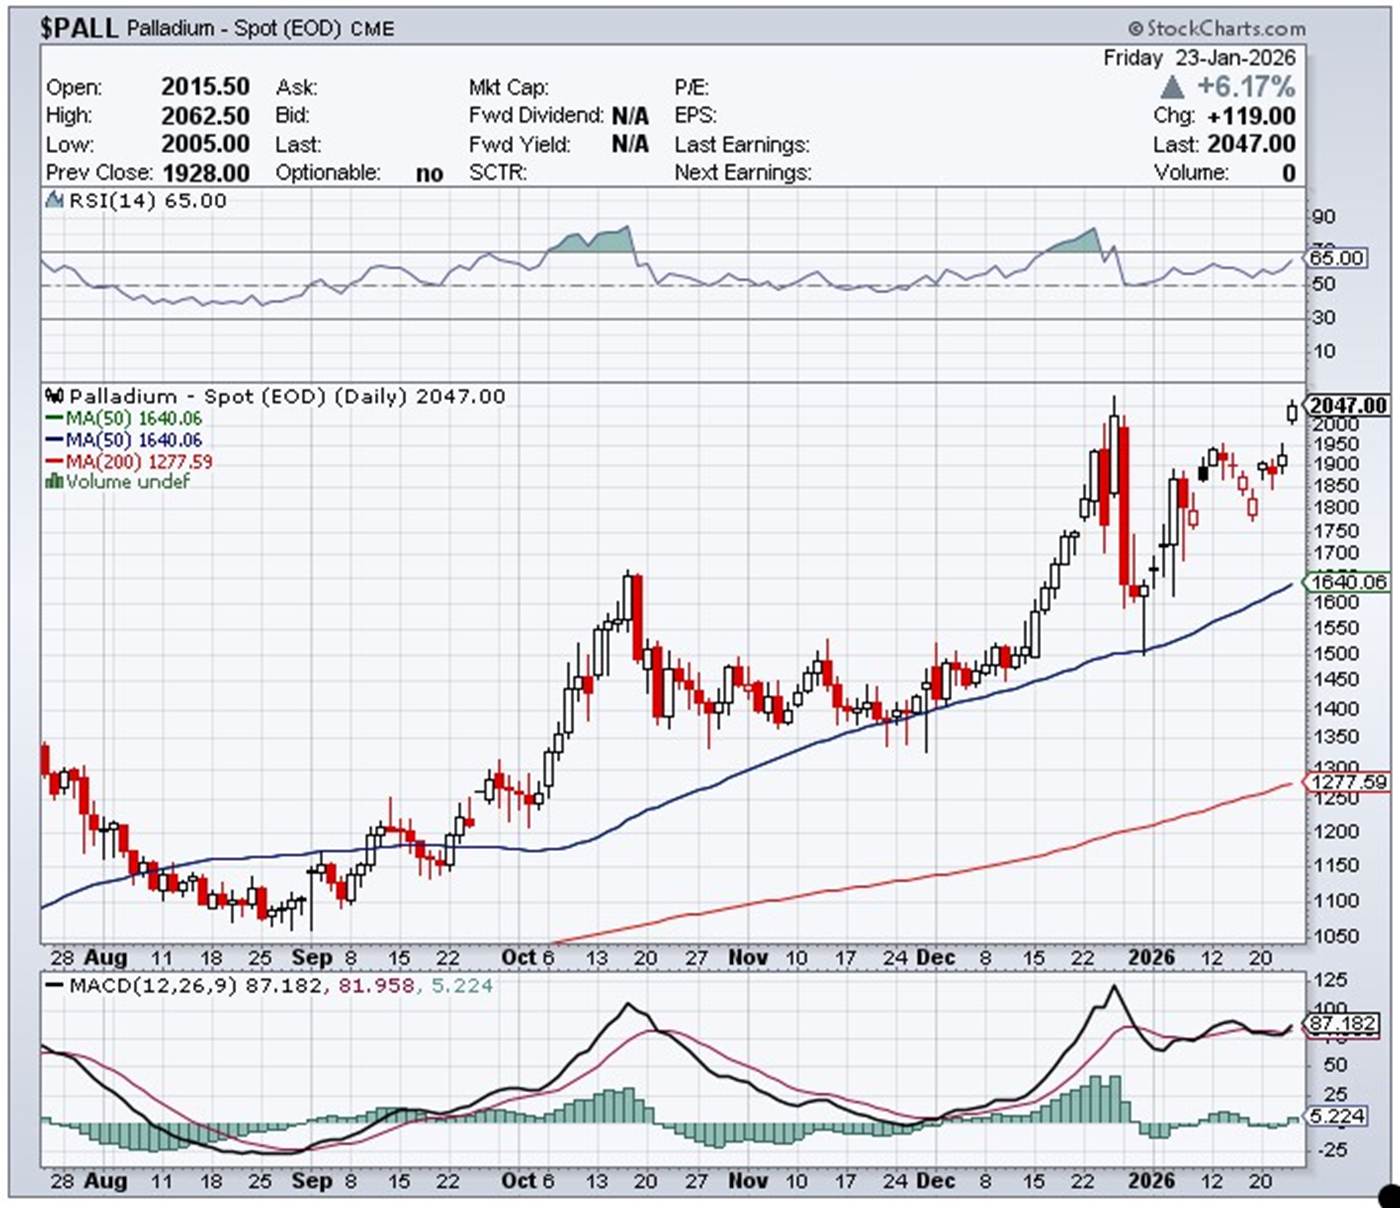
Palladium's price path in Globex and COMEX trading was managed in a similar fashion as platinum's up until its price was capped very shortly before the 11 a.m. EST Zurich close...shortly after it broke above $2,000 spot. It wasn't allowed to do much of anything after that. Palladium was closed at $1,995 spot...up 98 dollars on the day -- and 19 bucks off its Kitco-recorded high tick.
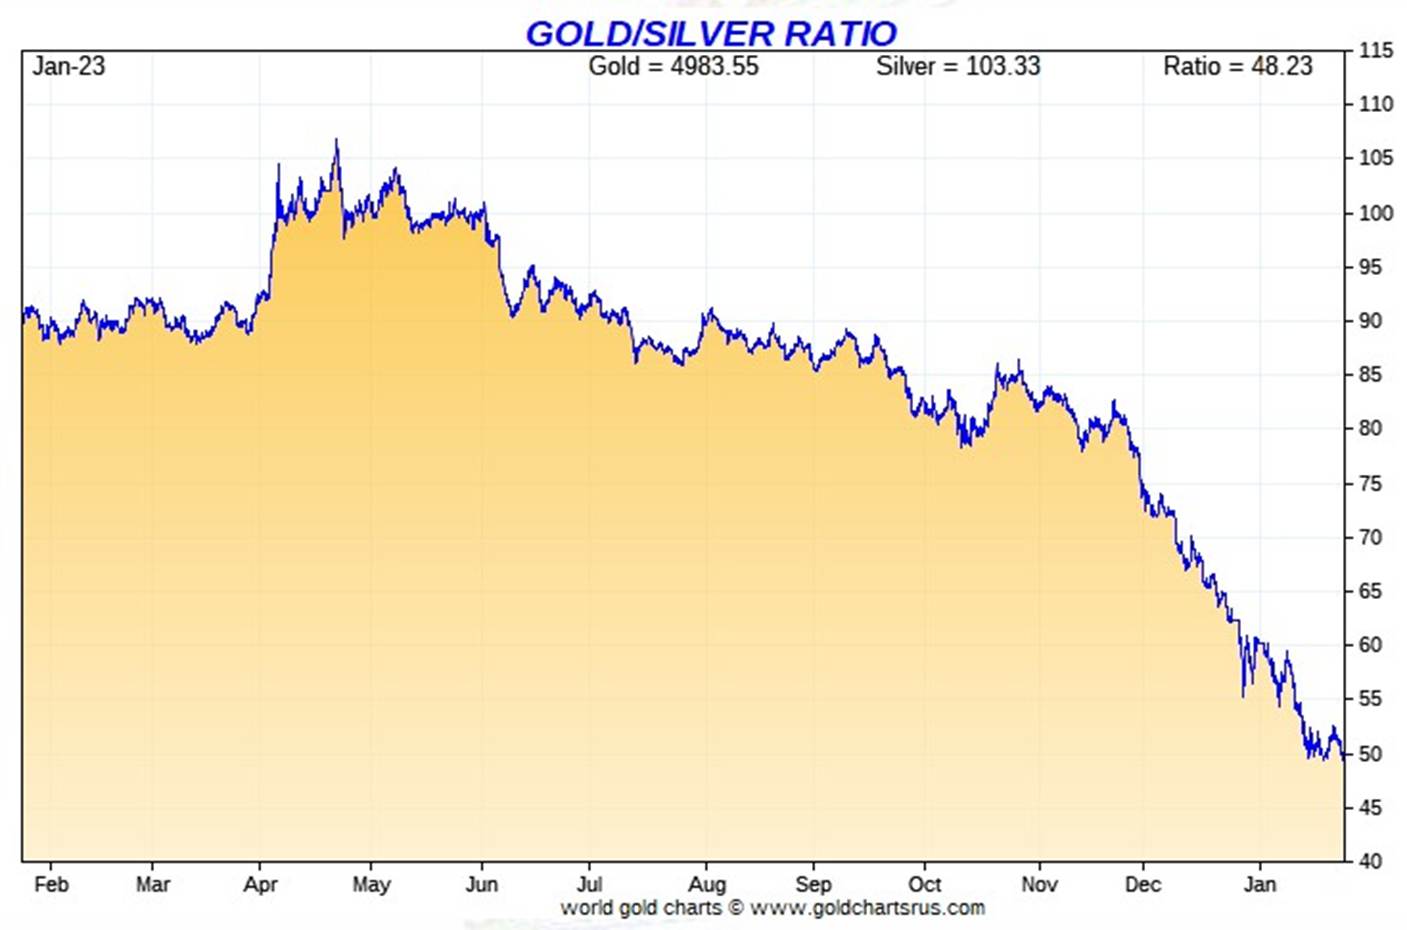
Based on the kitco.com spot closing prices in silver and gold posted above, the gold/silver ratio worked out to 48.3 to 1 on Friday...compared to 51.4 to 1 on Thursday, a monster drop.
Here's the 1-year Gold/Silver Ratio chart from Nick Laird -- and updated with this past week's data. Click to enlarge.
![]()
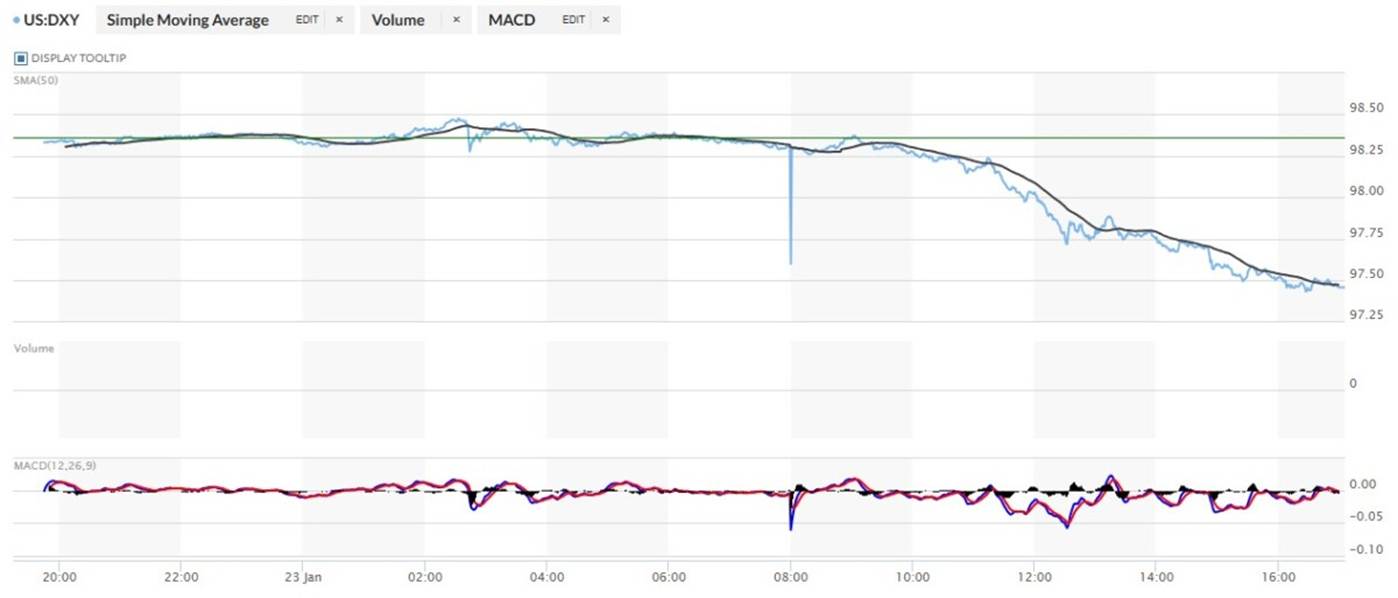
The dollar index was marked-to-close on Thursday afternoon in New York at 98.36 -- and then opened lower by 3 basis points once trading commenced at 7:45 p.m. EST on Thursday evening...which was 8:45 a.m. China Standard Time on their Friday morning. It then had an exceedingly broad, shallow and very quiet up/down move centered around 3:33 p.m. CST -- and ending at a couple of minutes after 9 a.m. in New York. Then its rate of descent increased sharply, until its low tick was set around 4:28 p.m. EST -- and it ticked a bad higher from there until the market closed at 5:00 p.m.
The dollar index finished the Friday trading session in New York at 97.46...down 90 basis points from its close on Thursday.
Here's the DXY chart for Friday...thanks to marketwatch.com as usual. Click to enlarge.
Here's the 6-month U.S. dollar index chart...courtesy of stockcharts.com as always. The delta between its close...97.46..and the close on DXY chart above, was about zero basis points. Click to enlarge.
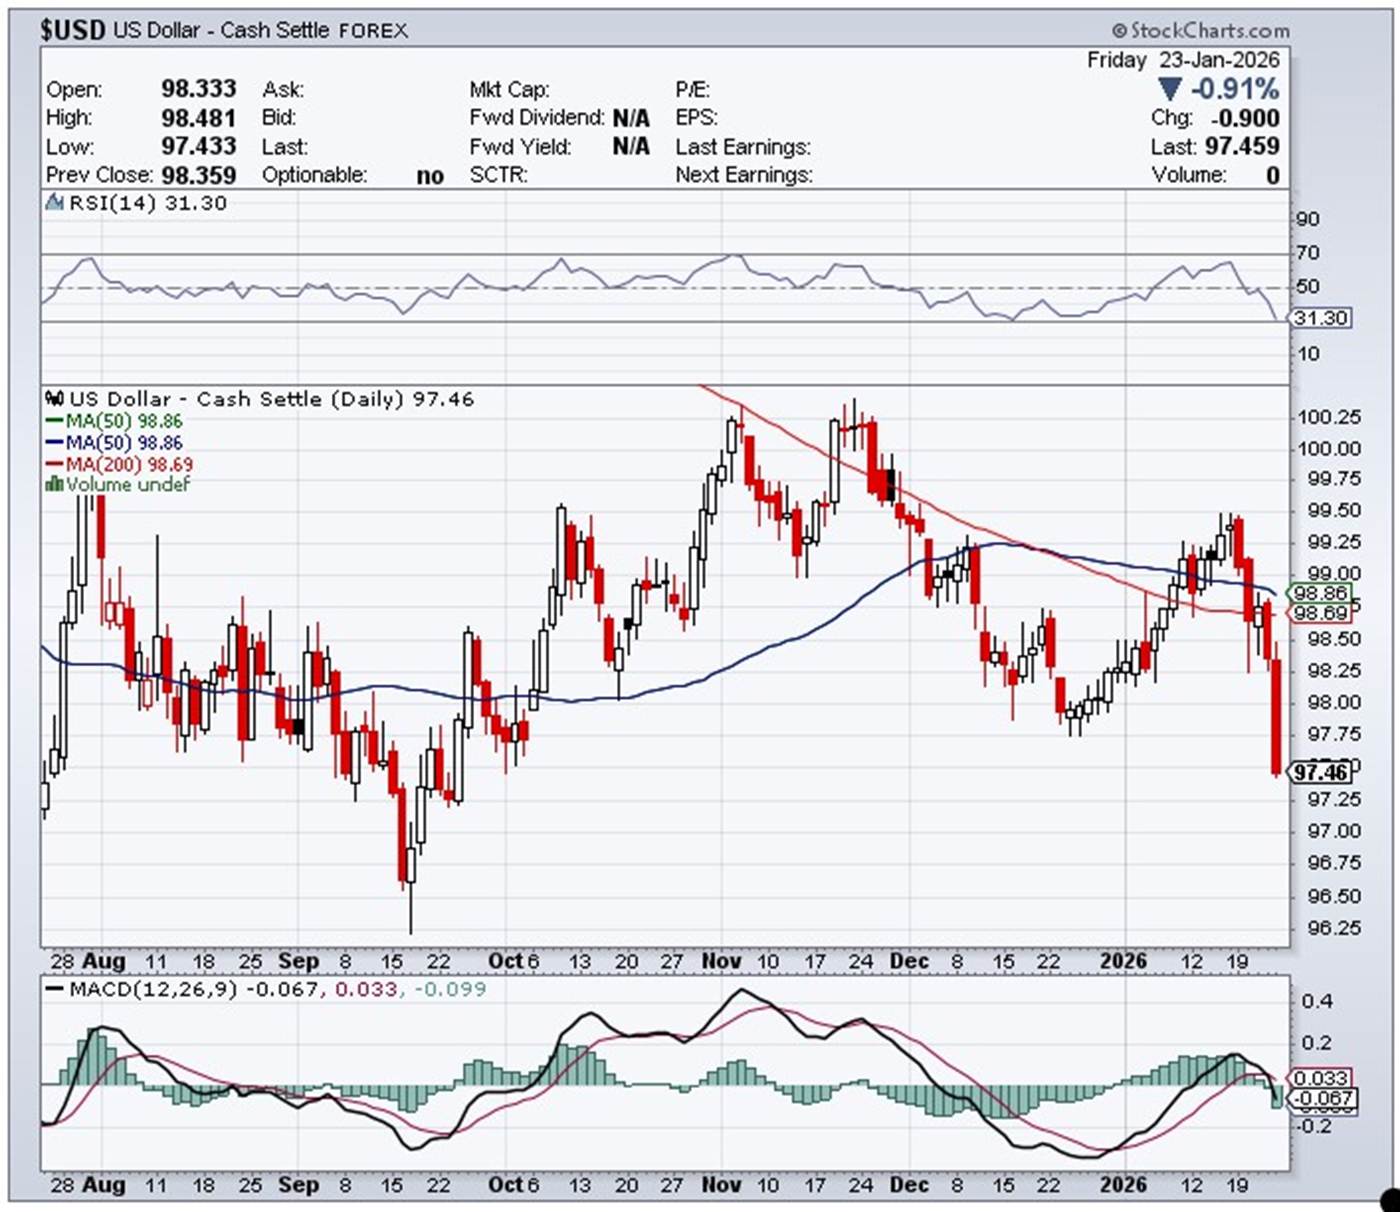
The precious metals were all in strong rally modes long before the dollar index headed south at 9 a.m. in New York.
U.S. 10-year Treasury: 4.2390%...down 0.0100/(-0.24%)...as of the 1:59:56 CST close
The Fed had to step into the treasury market on at least two separate occasions on Friday to ensure that the ten-year yield didn't close up on the day.
For the week, the ten-year yield closed higher by 0.8 basis points. The reason it wasn't up more, came courtesy of the continuing interventions by the Fed.
Here's the 5-year 10-year U.S. Treasury chart from the yahoo.com Internet site -- which puts the yield curve into a somewhat longer-term perspective. Click to enlarge.
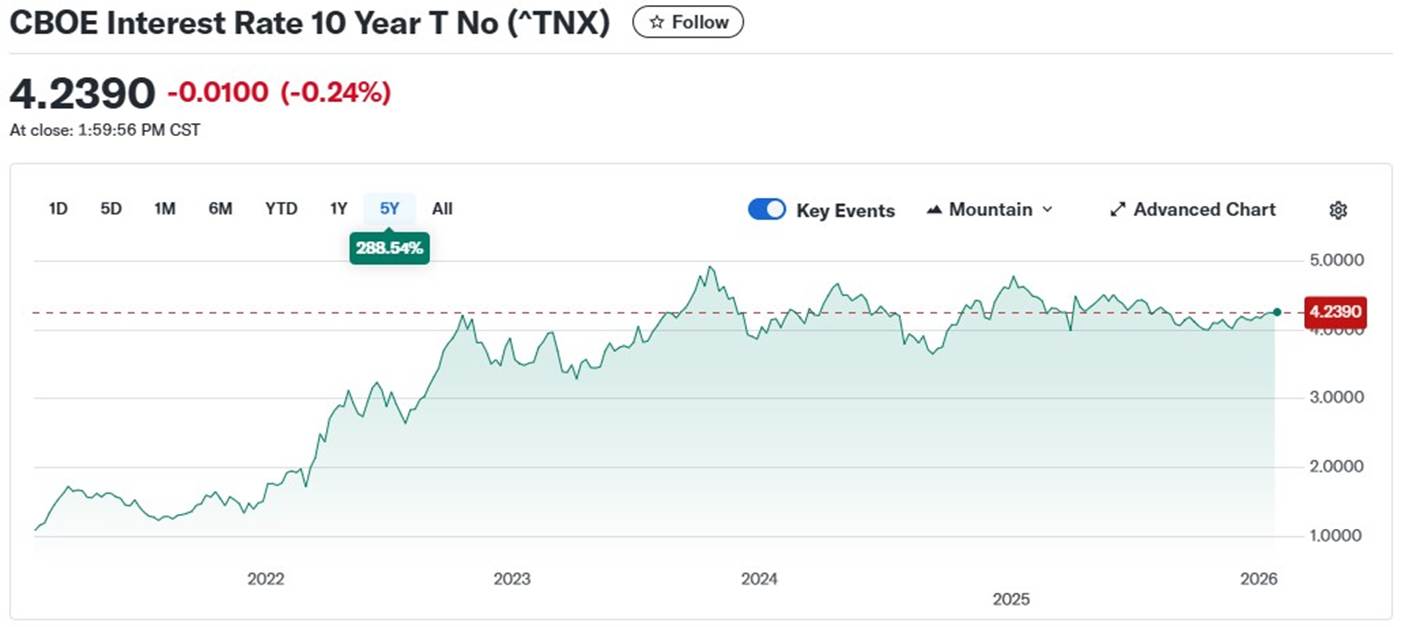
As I keep pointing out in this spot every Saturday, the 10-year hasn't been allowed to trade above its 4.92% high tick set back on October 15, 2023...but I still suspect that we've seen the 3.9482% low for this cycle...which was set back on October 22, 2025. QT came to an end over a month ago now -- and more rate cuts in 2026 are expected...as is the return of QE. It's here already, but being cleverly disguised. But after Davos this past week, all bets are off in everything.
![]()
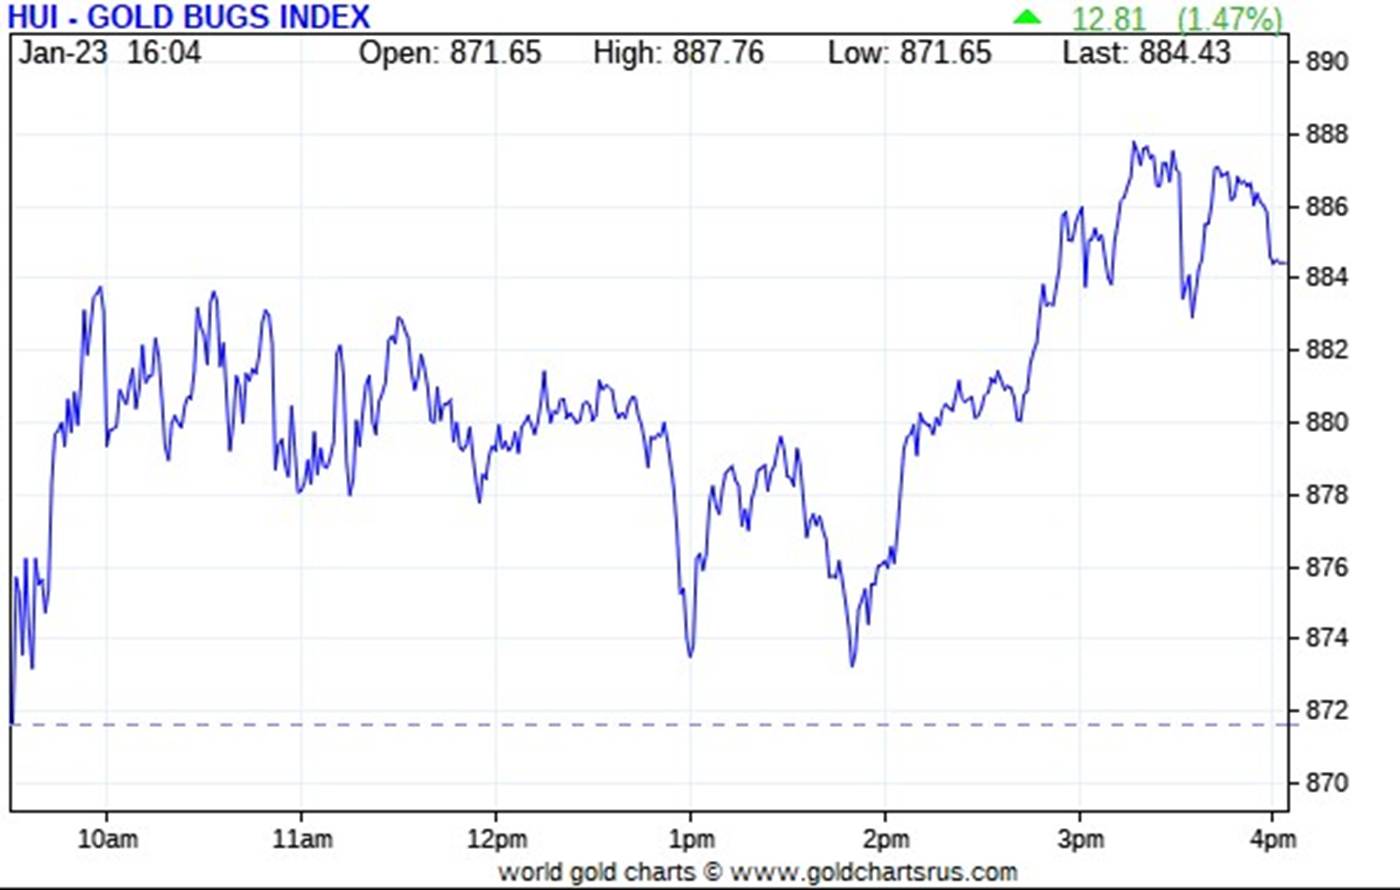
Although the gold shares rallied starting at the 9:30 opens in New York on Friday morning, they ran into resolute not-for-profit selling right away -- and that continued until shortly before 2 p.m. They were then allowed to rally a bit...but not too much -- and the HUI was only allowed to close higher by 1.47 percent.
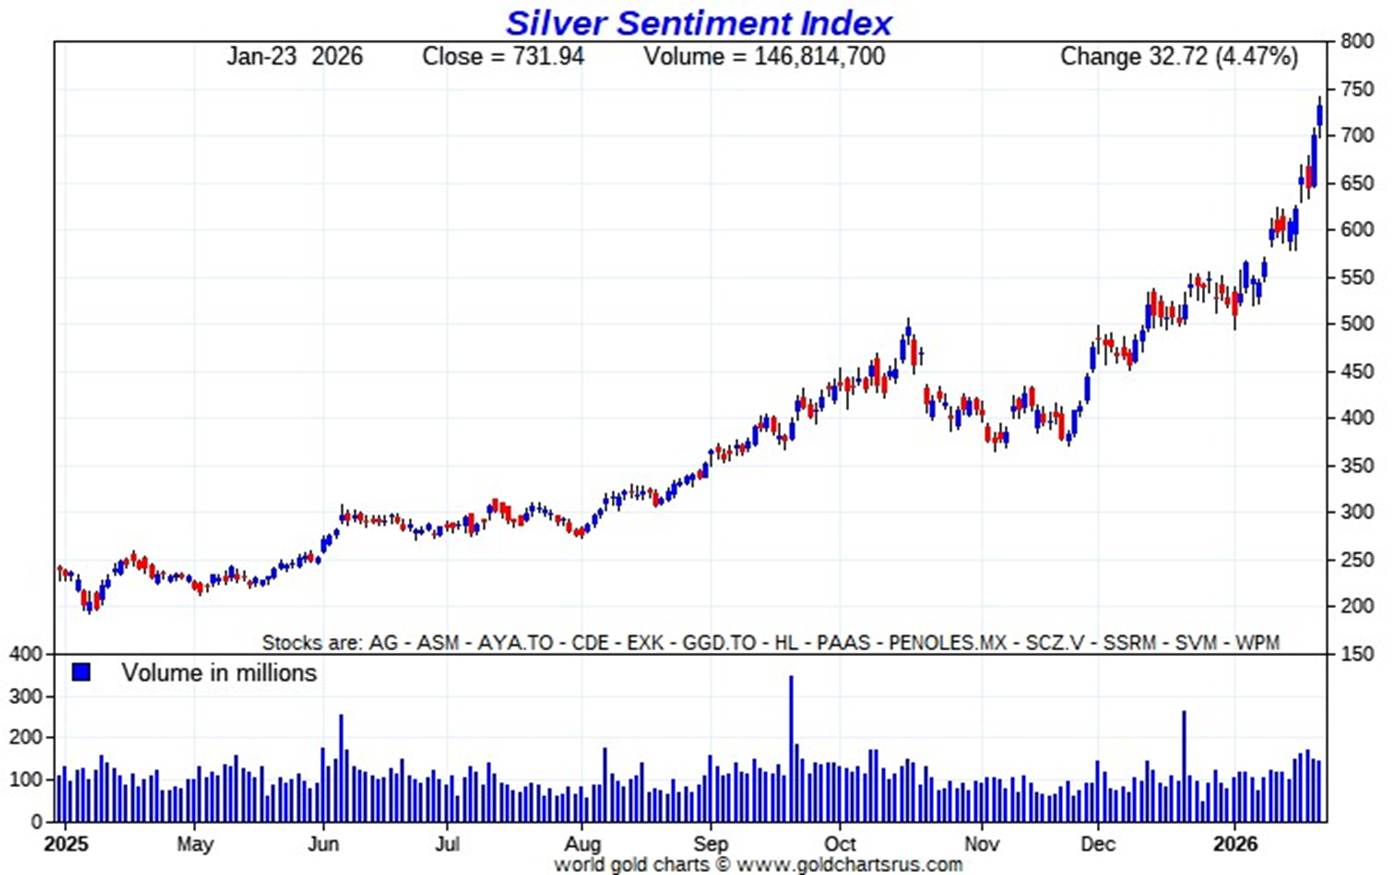
It was, as it usually is, far more egregious in silver. Despite the fact that silver closed above $100 spot for the first time in history...up 7.31 percent...Nick Laird's Intraday Silver Sentiment Index only closed higher by only 4.47 percent. Click to enlarge.
The hands-down star was Avino Silver & Gold Mines, closing up a whopping 19.41 percent...most likely on this news that I linked in Friday's column. The next two down the list were Santacruz Silver Mining and Aya Gold & Silver, closing higher by 7.23 and 6.42 percent respectively.
The biggest underperformer was Peñoles for the second day in a row...as it finished the Friday session up only 0.31 percent. And, for the second day in a row it opened up big...but was aggressively sold lower until it was basically closed at unchanged on the day. What profit-maximizing seller would do that, one wonders -- and the answer is...none. I have more on this in The Wrap.
I didn't see any news on any of the thirteen silver miners that comprise the above index.
The silver price premium in Shanghai over the U.S. spot price on Friday was a hefty 14.14 percent...the highest on record since a spike to 16% back in August 2011. I wouldn't be at all surprised to see it even higher than that in the coming days and weeks considering the budding silver mania over there.
The reddit.com/Wallstreetsilver website, now under 'new' and somewhat improved management, is linked here. The link to two other silver forums are here -- and here.
![]()
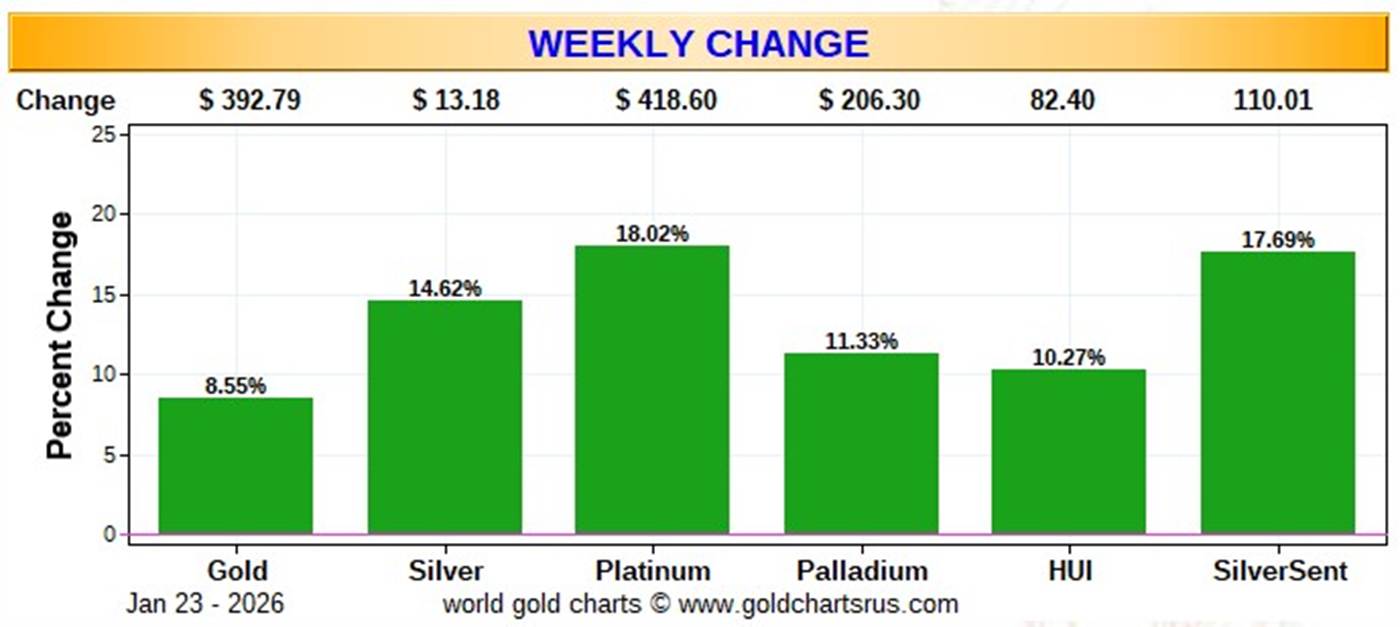
Here are two of the usual three charts that appears in this spot in every weekend missive. They show the changes in gold, silver, platinum and palladium in both percent and dollar and cents terms, as of their Friday closes in New York — along with the changes in the HUI and the Silver Sentiment Index.
Here's the weekly chart -- and everything silver-related blew the doors off everything gold on an absolute basis -- and mostly on a relative basis as well. But the HUI and Silver Sentiment Index should be up 2x the amount they are. Click to enlarge.
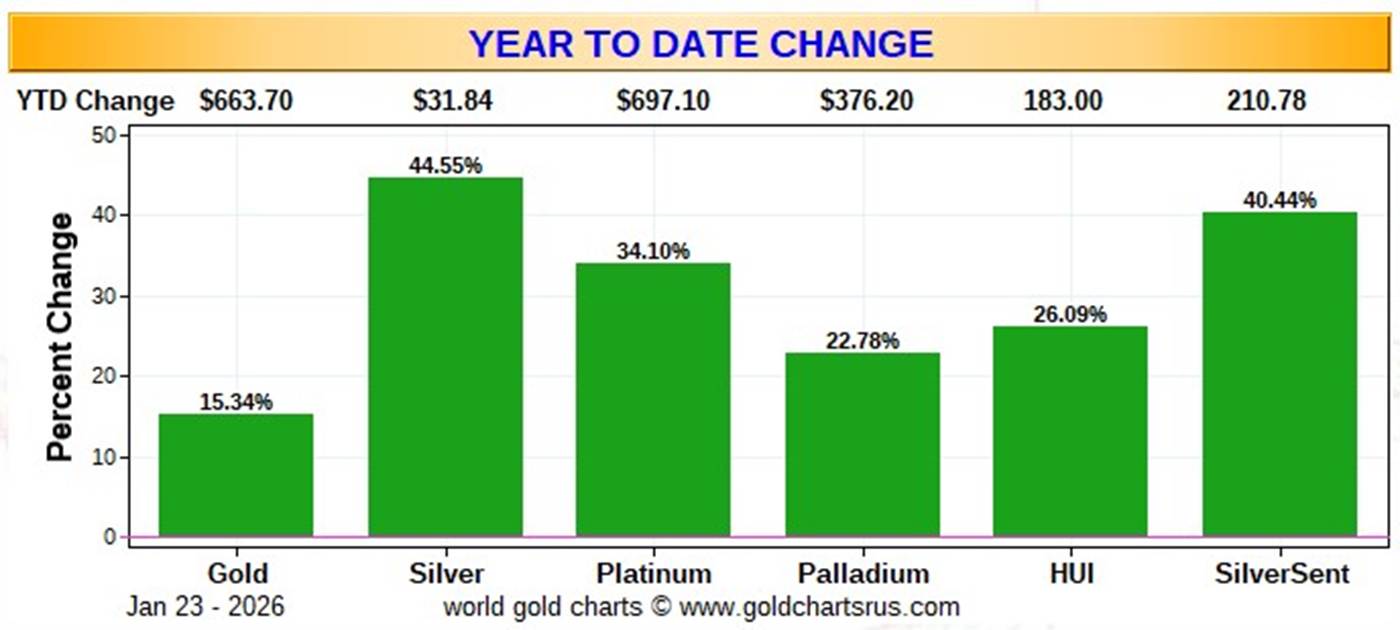
Here's the year-to-date chart...which does double duty as the month-to-date chart for this one month only. The ugly and stand-out feature once again...which is particularly ugly so far this year...continues to be the laughable underperformance of the silver shares vs. its underlying precious metal, with silver up 44.55% -- and the Silver Sentiment Index higher by only 40.44% year-to-date. The gold stocks are hardly setting the world on fire, either. BUT, as I pointed out in commentary earlier this week -- and again in The Wrap in today's column, it has now become obvious that the precious metal share prices are being managed. Click to enlarge.
Despite the fact that silver has now broken the $100 barrier -- and the silver well in London is close to running on empty...the gold/silver ratio remains at a farcical 48.3 to 1 as of the Friday's close. The 'normal' and historical ratio is around 15 to 1...which would put silver at a bit over $330. And if priced at the ratio of 7:1 that it comes out of the ground at, compared to gold...that would put silver at around $710 an ounce. So a rather impressive triple-digit silver price is in our future. As I say in this spot every Saturday...all that remains to be resolved is what that number will be -- and how soon 'da boyz' allow it to happen.

The CME Daily Delivery Report for Day 17 of January deliveries showed that 90 gold, plus 355 silver contracts were posted for delivery within the COMEX-approved depositories on Tuesday.
In gold, the four biggest short/issuers were Wells Fargo Securities, JPMorgan, R.J. O'Brien and BofA Securities...issuing 30, 22, 15 and 10 contracts respectively...Wells Fargo from their house account. The two long/stoppers were BofA Securities -- and JPMorgan...picking up 45 contracts each...BofA for their house account.
In silver, the two largest of the four short/issuers in total were JPMorgan and ADM, issuing 289 and 52 contracts out of their respective client accounts. There nine long/stoppers in total -- and the three biggest were Japanese trading house Mizuho, JPMorgan and Australia's Macquarie Futures, picking up 87...79 and 70 contracts respectively...JPMorgan for their client account.
In platinum and palladium, there were 39 and 20 contracts issued and stopped respectively.
In copper, another 622 contracts were issued and stopped...making the total month-to-date 13,172 COMEX contracts...329.3 million pounds of the stuff.
The link to yesterday's Issuers and Stoppers Report is here.
Month-to-date there have been 11,667 gold, plus 9,181 silver contracts issued/ reissued and stopped. Those numbers in platinum and palladium are 2,804 and 234 contracts respectively.
Back on the evening of December 30, the First Day Notice numbers for gold and silver in January were 4,075 contracts in gold -- and 4,461 COMEX contracts in silver...so you can see that 17 days into the current delivery month, there have been huge numbers of silver and gold contracts added to January deliveries...more than double in each. The rush to convert paper precious metals into physical remains "rapacious."
The CME Preliminary Report for the Friday trading session showed that gold open interest in January decreased by 1,015 COMEX contracts, leaving 180 still open...minus the 90 contracts out for delivery on Tuesday, as per the above Daily Delivery Report. Thursday's Daily Delivery Report showed that 1,090 gold contracts were actually posted for delivery on Monday, so that means that 1,090-1,015=75 more gold contracts were added to January deliveries.
Silver o.i. in January declined by 79 contracts, leaving 414 still around... minus the 355 contracts out for delivery on Tuesday as mentioned a bunch of paragraphs ago. Thursday's Daily Delivery Report showed that 265 silver contracts were actually posted for delivery on Monday, so that means that 265-79=186 more silver contracts were added to January deliveries.
Total gold open interest in the Preliminary Report on Friday night only increased by 6,716 COMEX contracts. Total silver o.i. rose by a decent 5,601 contracts...but not at all surprising considering the size of its price move yesterday.
[I checked the final total open interest number for gold for Thursday -- and it showed a very decent decline...from +23,173 COMEX contracts, down to +8,897 contracts. Final total silver o.i. for Thursday also took a pretty big hit, which I was more than happy to see...from +5,684 contracts, down to +2,253 contracts.]
Gold open interest inFebruary in the CME's Final Report on Thursday morning fell by a net and further 11,183 COMEX contracts, leaving 213,667 COMEX contracts still around -- But silver o.i. in February rose by 17 contracts, leaving 2,216 contracts still open.
![]()
Not surprisingly, there was huge chunk of gold added to GLD on Friday, as an authorized participant added 220,636 troy ounces, plus 7,917 troy ounces of gold were added to GLDM. But over at SLV, the counterintuitive withdrawals continued for the third day in a row, as an a.p. took out a further 453,177 troy ounces.
I just can't image how many tens of millions of ounces of silver is owed SLV -- and by how much the authorized participants have been forced to short it shares in lieu of depositing physical metal. But to give you some idea, SLV traded 138.9 million shares yesterday...2.28x its average daily volume.
The SLV borrow rate started the Friday session at 0.39% -- and ended it at 0.29% with 10.0 million shares available to short. The GLD borrow rate began the day at 0.55% -- and also finished it at 0.55%...with 7.2 million shares available.
In other gold and silver ETFs and mutual funds on Earth on Friday ...net of any changes in COMEX, GLD, GLDM and SLV activity, there were a net 362,887 troy ounces of gold added -- but a very hefty 2,287,144 troy ounces of silver were taken out...with the largest amount being the 1,578,313 troy ounces that left iShares/SSLN...plus 429,944 troy ounces out of Deutsche Bank.
And nothing from the U.S. Mint -- and there won't be until the first week in February.
There was no in/out activity in gold over at the COMEX-approved depositories on the U.S. east coast on Thursday.
There wasn't much let-up in silver. There were 317,245 troy ounces reported received...all of which ended up at Loomis International -- and 2,054,085 troy ounces were shipped out, with five different depositories involved.
The three largest amounts...654,458...647,816 and 571,636 troy ounces, departed HSBC USA, Loomis International and CNT respectively.
There was no paper activity -- and the link to Thursday's COMEX silver action is here.
As I mention further down as well..."COMEX silver deliveries have been monstrous since the start of the year...38.467 million oz. shipped out in the first 16 business days of 2026."
The Shanghai Futures Exchange updated their silver inventories as of the close of business on their Friday -- and it showed that a net and further 255,986 troy ounces/ 7.962 metric tonnes of silver were removed... leaving their silver inventories at 18.683 million troy ounces/581.090 metric tonnes.
This is their lowest inventory level since very early in 2016...ten years ago.
![]()
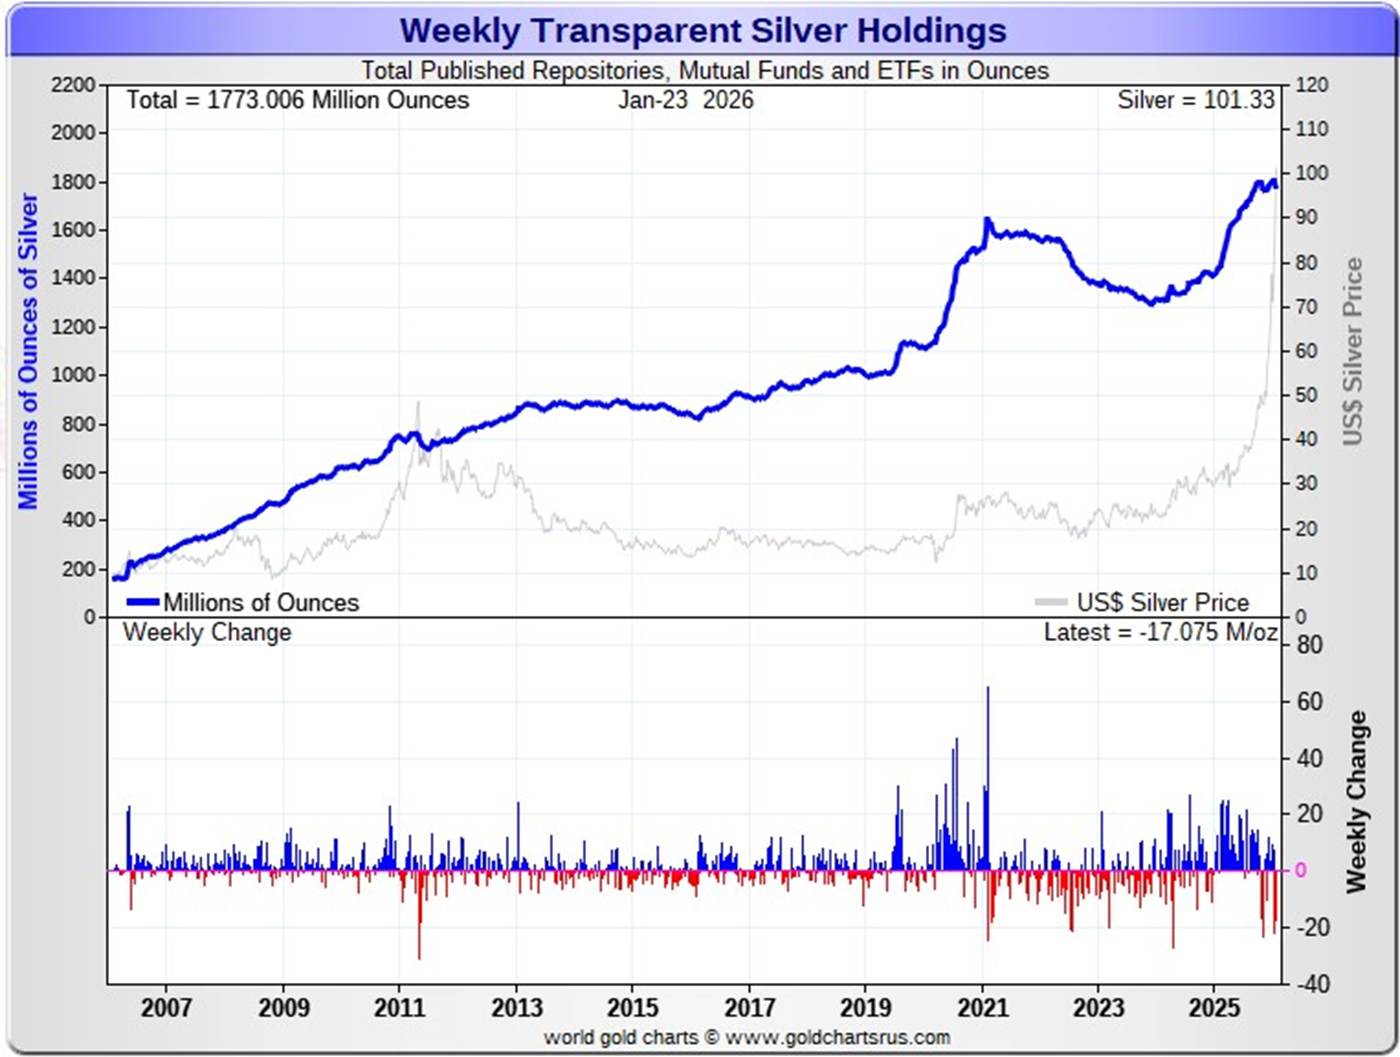
Here are the usual 20-year charts that show up in this space in every weekend column. They show the total amounts of physical gold and silver held in all known depositories, ETFs and mutual funds as of the close of business on Friday.
During the business week just past, there were a net and further 468,000 troy ounces of gold added...the ninth straight week that gold has been added.But for the second week a row there were huge withdrawals in silver, as a hefty 17.075 million troy ounces of silver were removed. That's on top of thewhopping and net 21.649 million troy ounces of silver were withdrawn last week.
So, on a parabolic price rise in silver over the last couple of weeks, just under 39 million oz. of silver have been removed from all of the world's ETFs, mutual funds -- and other depositories. WTF?
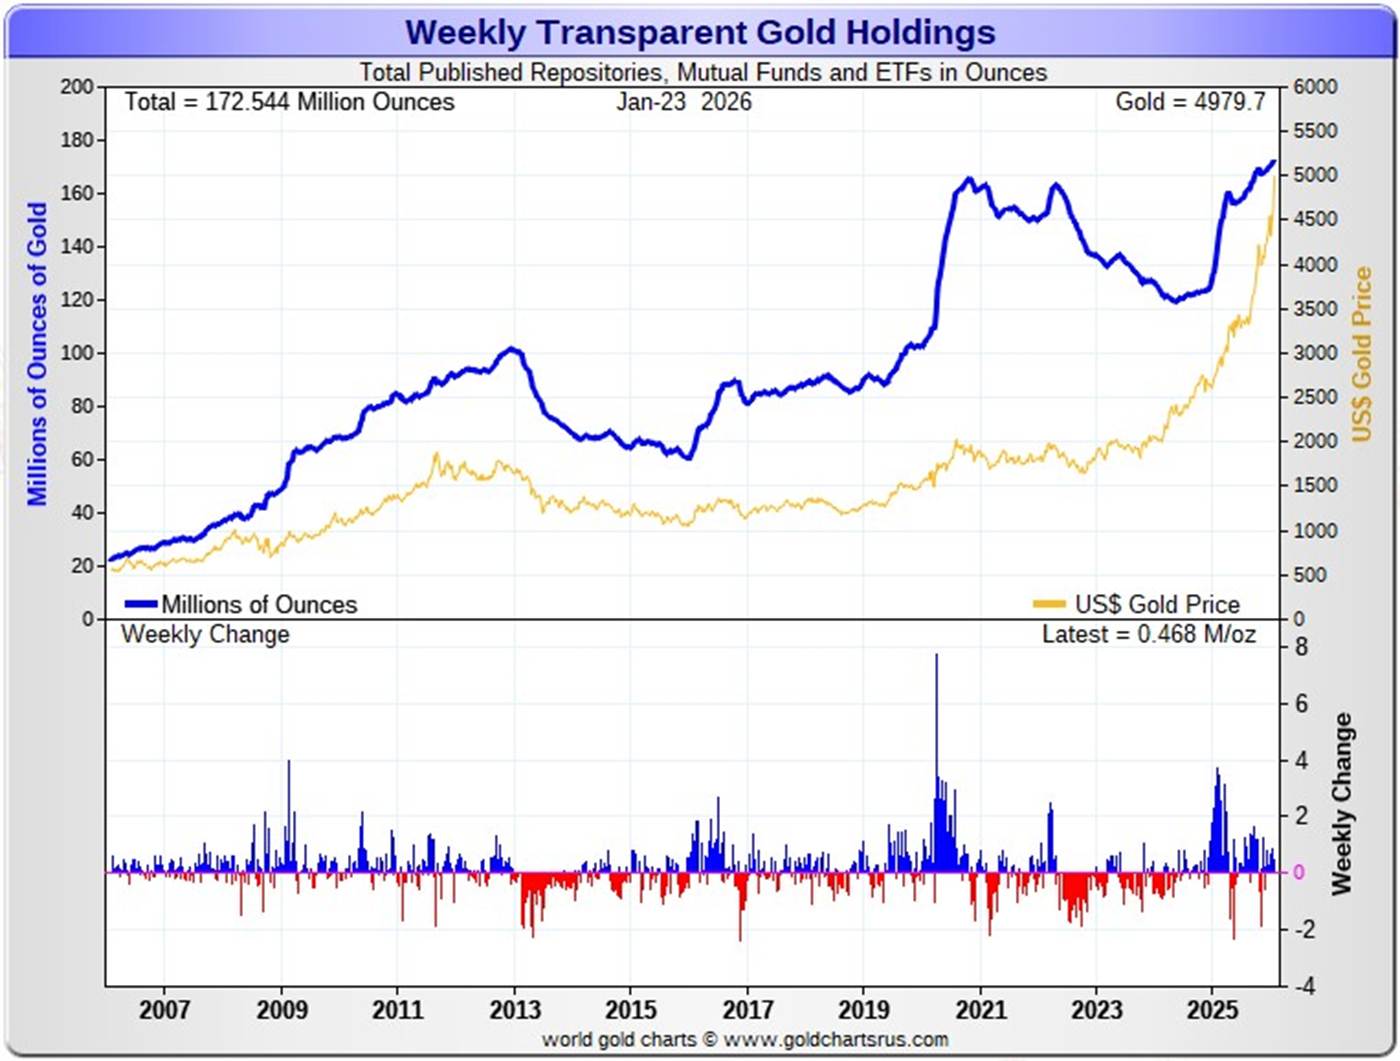
According to Nick Laird's data on his website, a net 2.432 million troy ounces of gold were added to all the world's known depositories, mutual funds and ETFs during the last four weeks. The two largest 'in' amounts were the 913,000 troy oz. that went into GLD, followed by the 352,400 troy ounces into India's gold ETFs. There were no 'out' amounts worthy of the name.
The amount of gold in all the world's ETFs and mutual funds remains barely above its old all-time high of late 2020...but should be far higher, more than double its current amount, considering that gold is now sitting at a tad under 5,000 the ounce...far more than twice the price it was back then. Why it isn't, is beyond me...but there's been a bit of a pickup in the last month or so, so hopefully that's the start of something.
On the other hand, a net 32.149 million troy ounces of silver were taken out during that same 4-week time period. The largest 'out' amount were the 34.928 million oz. out of the COMEX...followed by the 11.477 million out of SLV. Next down the list were the 8.079 million out of iShares/SSLN -- and the 4.428 million out of ZKB. They were followed by the 2.839 million troy ounces out of Aberdeen -- and the 2.576 million out of Wisdom Tree.
Looking at the above silver number you'd think silver had fallen by 50 bucks.
The biggest 'in' amount over that four-week period were the 23.538 million troy ounces shipped into India's silver ETFs...followed by the 9.565 million oz. into Sprott's PSLV. The rest of the 'in' amounts aren't worth mentioning.
It's been a wild four weeks in the physical silver space -- and the only explanations for these massive withdrawals was a conversion of paper silver shares for physical metal and/or the silver was more desperately needed elsewhere.
It should be noted that the amount of silver held in all these depositories, ETFs and mutual funds is a noticeable amount above its old all-time high inventory level of January 2021. But it should be far higher than it is as well, because silver is almost 4x the price it was back then.
Back at its previous inventory peak in late January 2021, silver was around $27 an ounce. Now its $76 higher. Why the precious metal ETFs aren't doing better is a mystery for which I have no answer, except for what I mentioned two paragraphs ago.
Retail sales are sky high world wide -- and it's now obvious that most of the more popular silver products are out of stock at almost all on-line retail bullion stores...with deliveries now stretched out to a bit over a month from the mints. Here in Canada, the price of a 1 oz. Canadian maple leaf is now around CAN$149...which is up a further 15 dollars from last week -- and 38 bucks over the last two weeks.
As you can see from the numbers a few paragraphs ago, physical demand in silver at the wholesale level remains enormous/ rapacious. COMEX silver deliveries have been monstrous since the start of the year...38.467 million oz. shipped out in the first 16 business days of 2026.
And, as mentioned further up in the Daily Delivery Report, there have been 1.167 million troy ounces of gold...plus a whopping 45.905 million troy ounces of silver issued and stopped so far in January, with new contracts being added to both every day. This has to be some sort of record for January...at least in silver.
The "rapacious" silver demand mentioned two paragraphs ago will continue until available supplies are depleted -- and we're also at the start of the sixth year of a structural deficit in silver according to the ongoing reports from The Silver Institute.
The vast majority of precious metals being held in these depositories are by those who won't be selling until the silver price is many multiples of what it is today...if ever.
Sprott's PSLV is the third largest depository of silver on Planet Earth with 217.7 million troy ounces...up another 200,000 troy ounces on the week -- and a great distance behind the COMEX, which has now been demoted to the second largest silver depository, where there are 416.4 million troy ounces being held...down a further 12.8 million troy ounces this past week...but minus the 103 million troy ounces being held in trust for SLV by JPMorgan.
That 103 million ounce amount brings JPMorgan's actual silver warehouse stocks down to around the 71 million troy ounce mark...quite a bit different than the 178.9 million they indicate they have...down a net and further 4.5 million troy ounces on the week. They've parted with a lot of silver in the last four months...a bit under 40 million oz.
PSLV remains a very long way behind SLV as well -- now the largest silver depository by a country mile...with 517.3 million troy ounces as of Friday's close...up 500,000 troy ounces from last week.
Everyone is hemorrhaging silver...except for Sprott -- and a handful of smaller players in this space.
The latest short report [for positions held at the close of business on Wednesday, December 31] showed that the short position in SLV rose by a further 9.95%...from the 51.45 million shares sold short in the prior report... up to 56.57 million shares in this latest short report that came out this past Monday...9.93% of total SLV shares outstanding. This amount is grotesque, obscene -- and fraudulent beyond all description...as there is no physical silver backing any of it as the SLV prospectus requires.
BlackRock issued a warning five or so years ago to all those short SLV that there might come a time when there wouldn't be enough metal for them to cover. That would only be true if JPMorgan decides not to supply it to whatever entity requires it. However, we appear to be far beyond that point now, as the short position in SLV will never be covered through the deposit of physical silver, as it just doesn't exit -- and never will. And if it does exist, it will only be available at a price far higher than what's being quoted in the public domain now. Those short SLV shares are in equal dire straits as those short silver in the COMEX futures market -- and I suspect that they're the same entities.
The next short report...for positions held at the close of trading on Thursday, January 15 will be posted on The Wall Street Journal's website on Tuesday afternoon EST on January 27.
Then there's that other little matter of the monster short position in silver and gold held by Bank of America in the OTC market...with JPMorgan & Friends on the long side. Ted said it hadn't gone away. He wrote an article about this back in April 2021 headlined "A New Piece of the Puzzle" -- and linked here.
In the article, the OCC Report stated that BofA had $8.3 billion in precious metal derivatives at the end of Q4/2020 -- and as you'll see in the paragraphs that follow, the BofA's derivatives position is now up to $47.9 billion as of the end of Q3/2025...an almost six-fold increase -- and all because of the increases in the price.
A while after that article came out, he also come to the conclusion that they're short around 25 million ounces of gold with these same parties as well. Once the silver price approaches three digits -- and gold hits $5,000...we'll see if they need to get taken over, like Bear Stearns did back in 2008 -- and for the same reason.
The latest OCC Report for Q3/2025 was posted on their website a month ago now -- and it showed that the precious metal derivatives held by the four largest U.S. banks increased by $137.54 billion/24.4% from Q2/2025...up to $704.05 billion...which is a very hefty amount.
JPMorgan's precious metals derivatives rose from $358.5 billion, up to $437.4 billion from Q2/2025 -- and Citigroup's also rose...from $150.7 billion, up to $204.3 billion. BofA's increased by a tiny bit...from $44.7 billion, up to $47.9 billion -- and the derivatives position held by Goldman Sachs is a piddling and immaterial $614 million -- up from the equally piddling $219 million it held in Q2/2025.
But with JPMorgan holding 62.1% of all the precious metals derivatives... Citibank holding 29.0% -- and Bank of America about 7% of the total of the four reporting banks, it's only JPMorgan and Citigroup that matter.
But the caveat to the above would be the precious metals derivatives position held by Wells Fargo and Morgan Stanley. The reason that their data is not included, is because they are not one of the USA's four largest banks by total derivatives held. But you can bet your entire net worth that they hold also hold a derivatives position in the precious metals that would choke a horse...Wells Fargo in particular.
This would indicate that these six U.S. banks held a derivatives position in the precious metals something north of $1 Trillion dollars at the end of Q3/2025 -- and is more than comfortably above that amount now.
But as I keep pointing out in this spot every weekend -- and mentioned just above...the OCC indicator is flawed for two very important reasons, as way back 10-15 years ago, this report used to include the top dozen or so U.S. banks -- and included the likes of Wells Fargo and Morgan Stanley, amongst others...that hold derivatives positions, both long and short, in the precious metals. Now the list is down to just four banks...so a lot of data is hidden ...which is certainly the reason why the list was shortened. On top of that, the list doesn't include the non-U.S. banks that are short and long the precious metals: British, French, German, Canadian -- and Australian.
Including all theirs, the derivatives/paper held in the precious metals...mostly on the short side...is an eye-watering multi-trillion dollar number...which can never be covered, either in the paper market, or through the delivery of physical metal...without driving the prices of all four precious metals beyond the moon in the process.
The next OCC Report for Q4/2025 won't be due out until sometime around the end of March 2026.
![]()
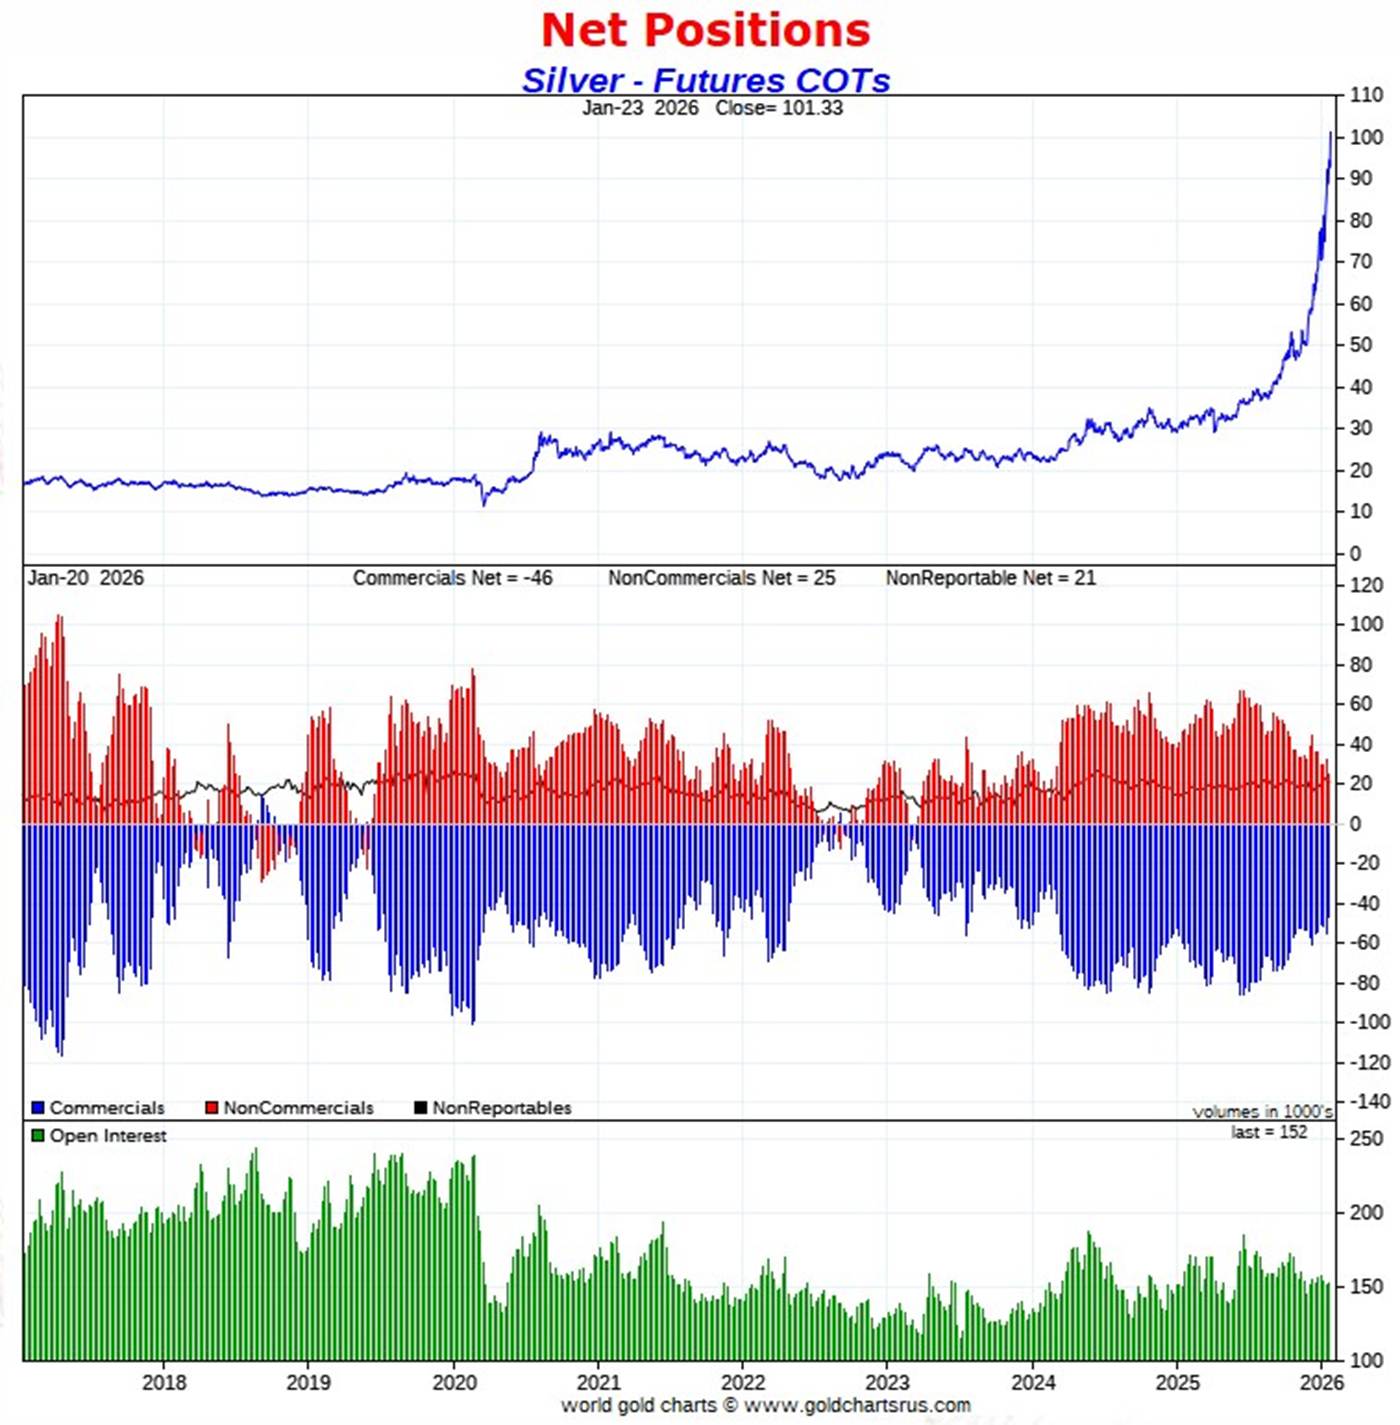
The Commitment of Traders Report, for positions held at the close of COMEX trading on Tuesday, showed a monster drop in the Commercial net short position in silver -- and a modest decline in the commercial net short position in gold.
However, the good news ended there...as virtually all of this 'improvement' in silver came via Ted Butler's raptors...the small commercial traders other than the Big 8 shorts...as they increased their net long position by 8,635 long contracts during the reporting week, which has the mathematical effect of reducing the commercial net short position which, in reality, isn't a decrease at all.
In silver, the Commercial net short position declined by a rather dramatic 8,903 COMEX contracts...44.515 million troy ounces of the stuff.
They arrived at that number through the purchase of 1,128 long contracts -- and also bought back/covered 7,775 short contracts. It's the sum of those two numbers that represents their change for the reporting week.
Under the hood in the Disaggregated COT Report, all three categories reduced their net long positions...the Managed Money traders by 3,846 contracts...the Other Reportables by 3,000 contracts -- and the Nonreportable/small traders by 2,057 COMEX contracts.
Doing the math: 3,846 plus 3,000 plus 2,057 equals 8,903 COMEX contracts ...the change in the Commercial net short position.
The Commercial net short position in silver now stands at 46,389 COMEX contracts...231.945 million troy ounces of the stuff, down those 8,903 contracts from what they were short in last Friday's COT Report.
The Big 4 commercial traders increased their net short position by an inconsequential 133 contracts -- and are currently net short 39,829 COMEX contracts/199.145 million troy ounces of the stuff.
The Big '5 through 8' traders reduced their net short position by 599 COMEX contracts -- and are net short silver by 15,962 contracts/79.810 million troy ounces.
Ted Butler's raptors...the 36 small commercial traders other than the Big 8...were the huge buyers -- and had to be...increasing their net long position in silver from 767 contracts...up to 9,402 contracts -- an increase of an eye-watering 8,635 COMEX contracts. Their purchase of those 8,635 long contracts had the mathematical effect of decreasing the net short position which, as mentioned a few paragraphs ago, isn't a decrease at all.
What matters is what the Big 8 shorts did in total -- and that wasn't much... reducing their net short position by a piddling 268 COMEX contracts.
But, having said that, the Big 4/8 commercial traders hold their smallest short position silver since mid November of 2023 -- and because of the data in the latest Bank Participation Report of two weeks ago now, it's safe to say that a maximum of 3 of these are U.S. banks.
The Big 8 commercial traders/'da boyz' are net short 36.7 percent of total open interest in the COMEX futures market...down a tad from the 37.0 percent they were short in last week's COT Report.
Here's Nick's 9-year COT chart for silver -- and updated with the above data. Click to enlarge.
As for any sign of short covering, the commercial traders in total reduced their gross short position by 6,435 contracts...but remain gross short 77,600 COMEX contracts, with no hope of covering without booking huge multi-billion dollar loses. The other three groups of traders that are net long silver, as all added to their gross short positions...to the tune of 4,623 COMEX contracts in total.
Since last October, while this bull market in silver has been unfolding, the Big 8 commercial traders have reduced their net short position from 64,483 contracts...down to 55,791 contracts -- and have shown little appetite for increasing it.
From a COMEX futures market perspective, the set-up in silver is very bullish -- and helped along by the fact that the Managed Money traders are only net long 9,946 COMEX contracts...an historically small amount for them.
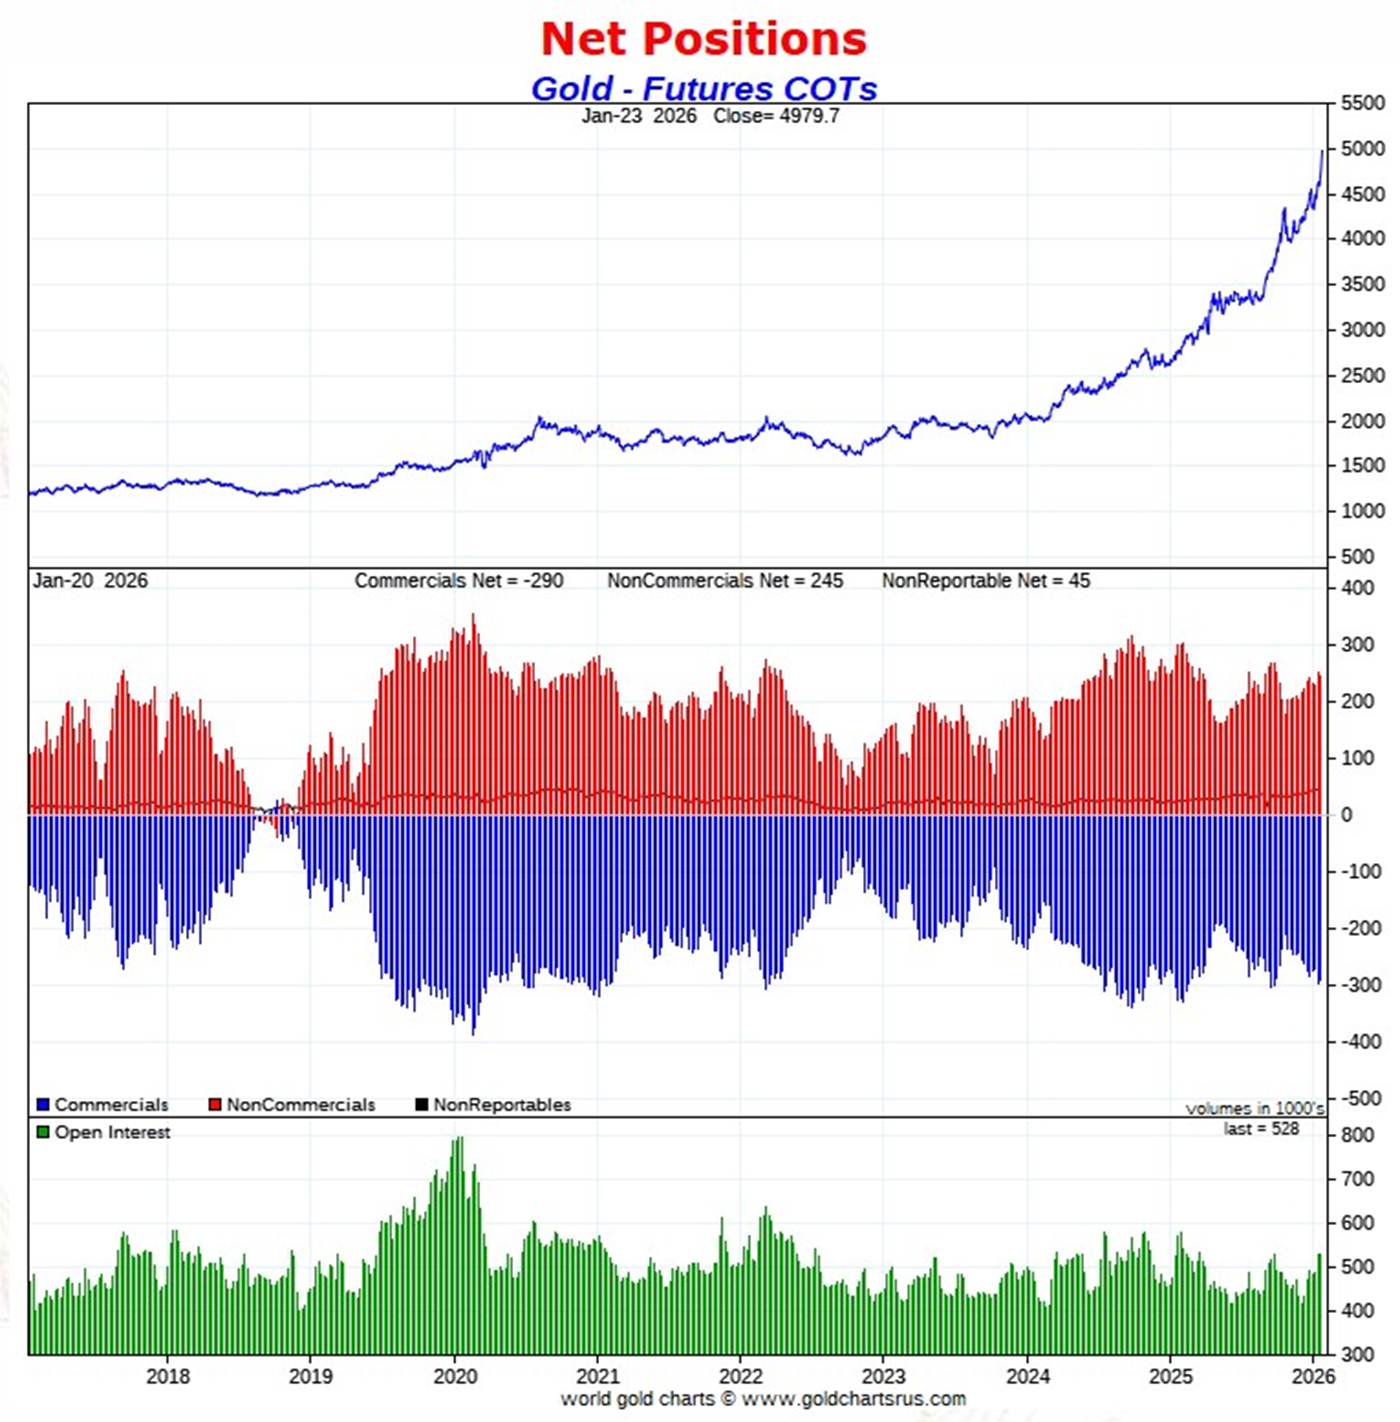
In gold, the commercial net short position declined by a modest 7,417 COMEX contracts...741,700 troy ounces of the stuff.
They arrived at that number through the purchase of 2,487 long contracts -- and also bought/covered 4,930 short contracts. It's the sum of those two numbers that represents their change for the reporting week.
Under the hood in the Disaggregated COT Report, only the Managed Money traders increased their net long position...them by only 2,699 contracts. The Other Reportables and Nonreportable/small traders were net sellers, with the former decreasing their net long position by a hefty 9,167 contracts -- and latter by 949 COMEX contracts.
Doing the math: 9,167 plus 949 minus 2,699 equals 7,417 COMEX contracts ...the change in the commercial net short position, which it must do.
The Commercial net short position in gold now sits at 289,689 contracts/ 28.969 million troy ounces...down those 7,417 contracts from what they were short in last Friday's COT Report.
Like in silver, the Big 4 commercial traders in gold increased their short position by a tiny amount...1,228 contracts...up to 166,321 contracts.
And also like in silver, the Big '5 through 8' commercial shorts decreased their net short position by a bit...down 2,601 COMEX contracts, to 82,369 COMEX contracts held short.
Ted's raptors, the 43 small commercial traders other than the Big 8, like in silver...were the biggest buyers, as they decreased their net short position through the buyback of 6,094 short contracts -- and are now down to 40,999 COMEX contracts net short. This remains a grotesque amount for them.
The commercial net short position in gold, which includes the Big 8...plus Ted's raptors...are net short 54.9 percent of the the total open interest in gold in the COMEX futures market...down from the 56.3 percent they were short last week...which is a perversion.
Here's Nick's 9-year COT chart for gold -- and updated with the above data. Click to enlarge.
As far reductions in their gross short positions, the commercial traders combined reduced theirs by 3,958 COMEX contracts -- and the Nonreportable/ small traders by 3,135 contracts. On the other end of the spectrum the Managed Money and Other Reportables traders added a total of 6,057 contracts to their gross short position.
There's no sign whatsoever of panic short covering by any group of traders... commercial, or otherwise.
Gold was up about $160 on the week -- and the fact that the commercial traders were able to reduce their short position came as a surprise.
Since mid-October, all three categories of commercial traders have been increasing their net short positions by around 77,000 contracts in total -- and although bearish from a COMEX futures market perspective, it's not extreme. However, total open interest has been rising recently, which I'm not happy to see.
So unless these collusive commercial trader of whatever stripe decided to step into the market in a major way, these rallies in silver and gold will continue. But as you already know, when they do step in, the recovery times are now down to hours, instead of days or weeks...so they accomplish nothing.
But the relentless margin calls for the shorts continue to roll in -- and their unbooked losses continue to pile up. At what price points will large number of them begin to panic and cover? Who knows...but we're not there yet. So far, the short covering we have seen, has been very orderly.
In the other metals, the Managed Money traders in palladium increased their net short position by by 239 COMEX contracts -- and are net short by 255 contracts. But their current gross short position is 6,809 COMEX contracts for whatever reason...the largest short position by far of any of the other categories...commercial traders included. Why this continues to be the case, I have no idea.
The commercial traders in the Swap Dealers category are net long palladium by 655 contracts...up 261 contracts on the week. The traders in the Producer/ Merchant category are net short 3,417 COMEX contracts...an increase of 133 contracts from last week. The traders in the Other Reportables and Nonreportable/small trader categories remain net long palladium...but not by much.
The world's banks are now net short 10.6 percent of total open interest in palladium in the COMEX futures market as of the January's Bank Participation Report that came out two weeks ago...which is an increase from the 4.5 percent that they were net short in December's Bank Participation Report.
This is a very strange and twisted market once you get a look into its internal structure...with platinum not that far behind.
In platinum, the Managed Money traders decreased their net long position by 2,367 COMEX contracts during the reporting week -- and are now net long platinum by only 5,498 contracts. The traders in the Other Reportables and Nonreportable/small trader category remain net long platinum by very respectable amounts...although their gross short positions are pretty hefty.
The commercial traders in the Producer/Merchant category in platinum are net short 14,475 COMEX contracts...down 758 contracts from what they were net short last week. The Swap Dealers in the commercial category also decreased their net short position, them by 1,226 contracts this past week -- and are net short platinum by 7,307 COMEX contracts.
It's mostly the world's banks in the Producer/Merchant category that are 'The Big Shorts' in platinum in the COMEX futures market, as per January's Bank Participation Report that came out two weeks ago -- and mostly European banks. They and the U.S. banks increased their short positions by a bit in December, but not by a lot considering its price rise.
In copper, the Managed Money traders decreased their net long position by a tiny 585 COMEX contracts during the past reporting week -- but remain net long copper by 62,806 contracts...about 1.570 Billion pounds of the stuff. That's down from the 63,391 COMEX contracts/1.585 billion pounds of the stuff that they were net long last week.
Copper, like palladium, continues to be a wildly bifurcated market in the commercial category. The Producer/Merchant category is net short a grotesque 89,963 copper contracts/ 2.249 billion pounds -- while the Swap Dealers are net long 20,777 COMEX contracts/519 million pounds of the stuff.
Whether this dichotomy in copper means anything or not, will only be known in the fullness of time. Ted Butler said it didn't mean anything as far as he was concerned, as they're all commercial traders in the commercial category. But this bifurcation has been in place for as many years as I've been keeping records -- and that's a very long time.
In this vital industrial commodity, the world's banks...both U.S. and foreign... are now back to being net short copper by 1.1% of total open interest in the January Bank Participation Report. Back in the October BPR, these same banks were net long 0.9% of the total open interest in copper in the COMEX futures market. So basically they're market neutral...but only numerically, as that dichotomy between the two groups of commercial traders is still there.
At the moment it's all the commodity trading houses such as Glencore and Trafigura et al., along with some hedge funds, that are mega net short copper in the Producer/Merchant category, as the Swap Dealers are net long, as pointed out above.
The next Bank Participation Report is due out on Friday, February 6.
![]()
Here’s Nick Laird’s “Days to Cover” chart, updated with the COT data for positions held at the close of COMEX trading on Tuesday, January 20. It shows the days of world production that it would take to cover the short positions of the Big 4 — and Big '5 through 8' traders in every physically traded commodity on the COMEX. Click to enlarge.
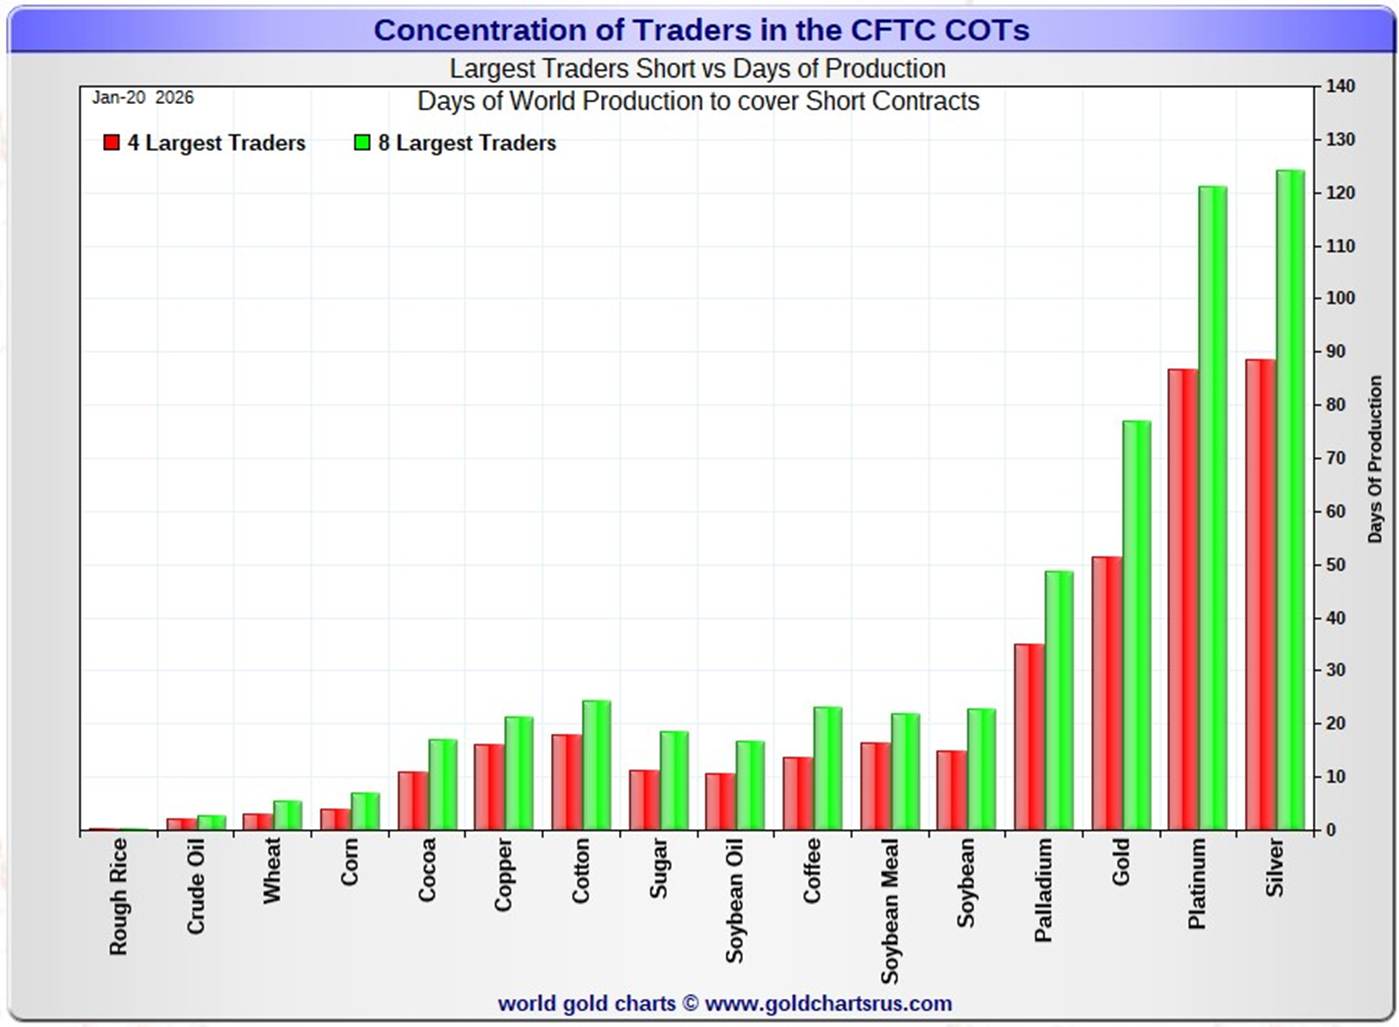
In this week's data, the Big 4 traders are short 89 days of world silver production...up 1 day from the prior COT report. The ‘5 through 8’ large traders are short an additional 35 days of world silver production... down 2 days from last week's report...for a total of 124 days that the Big 8 are short -- and obviously down 1 day from that last COT Report.
Those 124 days that the Big 8 traders are currently short, represents around 4.1 months of world silver production, or 278.955 million troy ounces/55,791 COMEX contracts. That's down from the 280.295 million troy ounces/56,059 contracts in last Friday's COT Report.
In gold, the Big 4 are short about 52 days of world gold production...up 1 day from the prior report -- and the Big '5 through 8' are short an additional 25 days of world production...down 2 days on the week, for a total of 77 days of world gold production held short by the Big 8 commercial traders -- and down 1 day from last Friday's COT Report.
The other standout of these Days-to-Cover charts, this one included, is the fact that the vast majority of the short positions in the four precious metals, plus other commodities, is held by the four largest traders...the red bars. Whereas the short positions held by the '5 through 8' large traders....the green bars, minus the red bars...is very small. That's how 'concentrated' these short positions are.
The short interest position in SLV now sits at 56.57 million shares/troy ounces as of the last short report that came out about two weeks ago, for positions held at the close of COMEX trading on Wednesday, December 31 -- up 7.80 million shares/troy ounces sold short from the prior report...an increase of 9.95%. This number, which represents 9.93% of total SLV shares outstanding, is off-the-charts grotesque and obscene -- and yet another way that 'da boyz' are keeping a lid on the silver price.
The next short report is due out on Tuesday, January 27...for positions held at the close of business on Thursday, January 15 -- and I must admit that I'm expecting another big increase.
In the overall in yesterday's COT Report, the short positions of the Big 8 commercial traders in both gold and silver changed by very little. The set-up in silver from a COMEX futures market perspective is bullish now in most respects -- but in gold, it's bearish for the Big 8 shorts...but very bearish when you add in the short positions of Ted's raptors.
As Ted Butler had been pointing out ad nauseam, the resolution of the Big 4/8 short positions will be the sole determinant of precious metal prices going forward...although that short position in gold held by Ted's raptors continues to be a negative factor as well.
But as he also pointed out over the years, there would come a time when what the numbers show in the COT Report won't matter, as events in the real world...whatever they may be...will overtake them -- and that time is upon us. All that we await now, is its resolution.
![]()
CRITICAL READS & VIDEOS
"The Expansion Has Cooled": U.S. Manufacturing, Service PMIs Both Miss, Signal 1.5% GDP Growth
With global PMIs today printing on the softer side (especially in France where the service PMI tumbled to 47.9 on expectations of a 50.3 print), moments ago it was the U.S.'s turn to join the parade of soggy prints. Here is what S&P Global reported for the January Prelim PMIs:
- Manufacturing PMI: 51.9, up from 51.8 in December but missing estimates of 52.0
- Services PMI: 52.5, unchanged from December's 52.5, and also missing estimates of 52.9
- Composite PMI Output Index: 52.8, up from December's 52.7), and also missing estimates of 53.0
While U.S. business activity growth ticked higher in January, it remaining subdued compared to the typical rate of expansion seen in the second half of 2025, according to the PMI report. Manufacturing growth accelerated to outpace that of services, but the January survey brought further signs that underlying order book growth has softened in both sectors recently, led by falling exports. Job numbers consequently remained little changed in January.
Curiously, when taking a closer look at the data, we find improvement across both employment and inflation:
Employment rose in January following a similarly weak increase reported in December. The near-stalled job market reflected concerns from companies over rising costs and softer sales growth in recent months. Only a marginal rise in payroll numbers was reported across the service sector while manufacturing jobs growth weakened to a six-month low. Some companies also continued to report difficulties finding staff, often struggling to fill vacancies and meet demand. These capacity issues contributed to the largest rise in backlogs of work since last August, albeit largely confined to the service sector.
Also, so much for inflation: input costs moderated from December’s seven-month high to sit at the weakest since last April. The moderation reflecting a cooling of input cost inflation in the service sector, as manufacturing input prices rose at the fastest pace since last September, once again widely blamed on tariffs.
Commenting on the report, S&P GMI chief economist, Chris Williamson, said that "The flash PMI brought news of sustained economic growth at the start of the year, but there are further signs that the rate of expansion has cooled over the turn of the new year compared to the hotter pace indicated back in the fall."
This news story showed up on the Zero Hedge website at 10:00 a.m. EST on Friday morning -- and another link to it is here.
![]()
"Expect the unexpected” is just not going to cut it. For 2026, I’m adopting “Expect the Unbelievable.”
Three weeks into the new year, markets hint at “unbelievable” possibilities.
Sanae Takaichi and JGBs following in the footsteps of Liz Truss and the gilts market from 2022? That’s one major predicament for Japan – and markets across the globe. At upwards of $13 TN, outstanding Japanese government debt is about three-times the size of the UK’s. Weighing in around 250% of GDP – and almost half owned by the BOJ – a Japanese bond crisis has unbelievable possibilities.
Thirty-year JGB yields surged 27 bps in wild Tuesday trading, to 3.85%, before reversing lower to end the week up 14 bps at 3.60%. After trading Tuesday to the highest level since September 1997, 10-year JGB yields closed the week seven bps higher to 2.26% (up 19 bps y-t-d).
Ten-year Treasury yields rose to a five-month high 4.30% in Tuesday trading (up 30bps from late-November lows). When JGBs falter, it’s curious to watch the old bond vigilante fears set in. Greek yields surged 18 bps in two sessions to 3.52%, the high back to April’s “liberation day” instability. Interestingly, German (10yr) yields rose seven bps this week to 2.91%, a more than two-year high, and within only five bps of the highest yield since July 2011.
Swedish yields added five bps to 2.92%, within two basis points of highs since 2011. Australian yields jumped 11 bps to 4.82%, only a couple bps from highs back to 2011. New Zealand 10-year yields surged 15 bps to 4.59%.
Worryingly, UK 10-year gilt yields jumped 11 bps this week to 4.51%.
A deeply divided Fed is a key Issue 2026: Deeply unstable markets will only compound the problem, whether it’s Rieder or Warsh at the helm. The rates market is pricing about two cuts (45bps) by year-end. So long as the boom persists, the hawkish contingent will have none of that. The new Fed Chair will come with a Trump mandate to cut rates. I’ll assume the non-economist Rieder will have an especially challenging task of pushing through lower rates.
Issue 2026: QE and the Fed’s balance sheet. Things turn unbelievably fascinating if the fledgling Rieder Fed confronts de-risking/deleveraging and market crisis – a scenario these days with uncomfortably elevated odds. Markets would demand a big liquidity bailout to the tune of many hundreds of billions (for starters). And Rick Reider would have his work cut out selling monster QE to the Committee, the American people, and global investors – especially ahead of unbelievably consequential midterm elections. Time will be of the essence. The QE number(s) will be unbelievably massive – and any Fed flinching could unleash unbelievable instability. The podium will say “Federal Reserve,” but many folks will see and think Blackrock. Potentially unbelievably messy.
Unbelievable to most, Silver ended the week at $103, with Gold just shy of $5,000. Gold has jumped 15.5% in the initial three weeks of the year, adding to 2025’s spectacular 64.6% advance. Unbelievably, Silver has jumped 44%, after last year’s 148%, with Platinum rising another 18.7%, following 2025’s 127%.
A Wednesday Fortune headline gets to the crux of an Issue 2026: “Ray Dalio Warns that the Monetary Order is Breaking Down, Leaving us with a Terrible Choice: ‘Do Your Print Money or Let a Debt Crisis Happen.” Trapped.
Yes, dear reader, there's no way out. Doug's weekly missive is definitely worth your while this week -- and another link to it is here.
Trump is engineering a 'crack-up boom' -- Lawrence Lepard
Lawrence Lepard, investment manager for Equity Management Associates in Sherborn, Mass., and author of "The Big Print," makes compelling observations in his fourth-quarter report for the firm's gold and silver fund.
Maybe the most compelling one is this: "When you have the president saying they intend to grow, and the treasury secretary saying that the Fed and treasury need to be melded into one entity, it is not hard to connect the dots.
They are going to force us into a 'crack-up boom.' They are telling us what they are going to do. We need to believe them. None of us owns enough hard assets in this environment. We must own what cannot be printed."
But Lepard also argues that even as the prices of gold and silver mining companies have risen sharply lately, they have not begun to reflect the far sharper increases in the prices of the metals they mine.
I have all the time in the world for whatever Larry has to say. This very long 32-page quarterly report is full of revealing charts -- and I found it on the gata.org Internet site early on Friday evening EST. Another link to it is here.
INTEL Roundtable w/Larry Johnson & Ray McGovern: Weekly Wrap -- 23 January
This very informative and worthwhile 29-minute video with former CIA analysts McGovern and Johnson was posted on the youtube.com Internet site very late on Friday afternoon EST -- and was hosted by Judge Andrew Napolitano as always. I thank Guido Tricot for sending it -- and another link to it is here.
Silver $100, Gold $5,000 as Trump's 'Rupture' Turns on J.P. Morgan -- Bullion Vault
The SILVER PRICE broke above $100 per ounce and gold jumped within 0.3% of $5,000 on Friday, both setting fresh record prices with the steepest weekly jump since the Covid pandemic as U.S. President Trump followed his political attack on NATO allies by suing the USA's largest bank J.P. Morgan for $5 billion.
While the S&P500 index today edged up towards last week's record high, shares in J.P. Morgan Chase fell for the 8th time in 12 sessions, losing over 10% from early January's peak.
"We are in the midst of a rupture, not a transition," said Canada's Prime Minister Mark Carney of the 2026 geopolitical outlook at this week's World Economic Forum in Davos, Switzerland.
"Great powers have begun using economic integration as weapons, tariffs as leverage, financial infrastructure as coercion, supply chains as vulnerabilities to be exploited."
Peaking at the end of today's London trading $4,987 per Troy ounce, gold bullion in the world's global hub had earlier fixed around $4,940 at the City's 3pm bench-marking auction, rising 7.1% from last Friday's finish with its sharpest rise since the U.K. went into lock-down in March 2020 as the Dollar fell again on the FX market.
Silver meantime rose for the 9th week in a row, leaping by the most since August 2020 to fix close to $99 with a 13.7% gain from last Friday's London bench-marking auction.
Spot market trading in industrially-useful silver then pushed the London price up through $100 per Troy ounce as New York silver broke $100 on all COMEX future contracts for settlement between March and September.
This item appeared on the bullionvault.com Internet site at 4:18 p.m. GMT on their Friday afternoon -- and I thank Tim Gorman for pointing it out. Another link to it is here.
Billionaire Sprott bags 678% return on idle Nevada gold and silver mine
Hycroft Mining Holding Corp., the owner of a non-operational gold and silver mine in northern Nevada, has seen its shares soar more than 380% over the past two months as precious metals prices have climbed to record highs.
That's delivered glittering returns for its largest investor, Canadian billionaire Eric Sprott, a longtime gold bug whose stake has increased 678% in value to almost $2 billion.
Hycroft is riding the updrafts of a staggering rally in the spot silver and gold market that has seen prices soar in the past year. Even though Hycroft doesn't yet have a clear plan to mine its underground reserves, the company's stock still serves as a way for investors to buy into the precious metals boom.
"Think of it as a massive, in-ground ETF," Bank of Montreal precious metals analyst Brian Quast said in an interview. "There's a whole bunch of silver there that they might or might not be able to get out, and people really want exposure to silver right now."
Sprott, 81, who has loudly advocated for owning precious metals for decades, has emerged as one of the most prominent billionaires to notch major gains from gold and silver's bullish run. The majority of ultra-high-net-worth investors have mostly missed out, survey data shows, with family offices reporting an average allocation to precious metals of just 2% last year, according to the UBS Global Family Office Report 2025.
However, bold bets from a few tycoons including Sprott and Hong Kong-based investor Cheah Cheng Hye have reaped massive returns.
The rest of this Bloomberg story is behind their paywall. It was posted on their Internet site on Friday -- and I found it embedded in a GATA dispatch. Another link to it is here.
Decoupling from the dollar, India sells U.S. treasuries, buys gold
In a big shift for one of the five largest economies, India's holdings of U.S. Treasuries have seen a drop, sliding to the lowest level in five years.
The reason for the fall is both need-based and strategic: The rupee has been depreciating, making it one of the worst performing Asian countries last year.
The second reason is to strategically change the composition of foreign exchange reserves, reducing dependence on U.S. assets. In fact, most economies are reducing reliance on the world's largest bond market.
U.S. government data released last week shows that India's holdings of long-term American debt have fallen to about $174 billion. This marks a drastic 26% drop from the peak, which was recorded in 2023.
According to the Reserve Bank of India, Treasuries now make up roughly one-third of the country's forex reserves, down from around 40% a year ago.
This news item put in an appearance on The Times of India website on their Friday -- and is another article that I found embedded in a GATA dispatch. Another link to it is here.
Meet the Man Who Bought $1 Billion in Physical Silver Before the Rally
The precious metals complex resumed its upward trajectory overnight. Shortly after the US equity cash open, silver surged above $100 per ounce for the first time on record, while gold approached the $5,000 per ounce level.
As Rick Privorotsky, head of Delta One at Goldman Sachs, noted to clients earlier, flows suggest some speculative participation, but the dominant driver remains structural: "There is clearly hot money involved, but first and foremost gold is a central bank trade… a slow erosion of the dollar's exorbitant privilege rather than a sudden loss of confidence..."
What first came to mind as silver broke above the $100 level was Warren Buffett's late-1990s bet on the precious metal. Berkshire Hathaway accumulated 129.7 million ounces of physical silver, or about 4,000 metric tons, ahead of the Dot Com bubble crash. The position was disposed of around 2006, generating a substantial profit for Berkshire.
Fast forward to October 2024, and we rolled out the Zero Hedge silver/gold coins and bars. At the time, silver was in the low $30s, while gold hovered around $2,600.
But on an even grander scale, several months later in early 2025, David Bateman, the founder of Entrata, revealed on X that he had purchased "close to a billion dollars in precious metals over the past six months."
To be exact, Bateman told his followers on X that he bought "1.5% of the annual global silver supply (12.69 million ounces)."
Earlier today, shortly after silver jumped above $100. He posted on X, "Congrats everyone on $100 silver. Couldn't have happened to a better group of degenerate mildly autistic misfits."
His reasons for the massive physical trade were as follows:
This very worthwhile article put in an appearance on the Zero Hedge website at 10:10 p.m. on Friday night EST -- and another link to it is here.
QUOTE of the DAY
The WRAP
"Understand this. Things are now in motion that cannot be undone." -- Gandalf the White
Today's pop 'blast from the past' is one that I haven't featured for a long time -- and it's time for a revisit. Discovered by Burt Bacharach in 1962...her fourth single in November 1963 was her first top 10 pop hit -- and the rest, as they say, is history. The link is here.
Today's classical 'blast from the past' is Johann Sebastian Bach's Brandenburg Concerto No. 2 in F major, BMV 1047...one of six instrumental works presented by Bach to Christian Ludwig, Margrave of Brandenburg-Schwedt, in 1721...although undoubtedly composed earlier.
Here's the Freiburger Barockorchester performing at the "Spiegelsaal" Castle Cöthen in March of 2000. The gentleman playing the baroque trumpet, Friedemann Immer, is outstanding. The opening Allegro moderato is instantly recognizable -- and the link is here.
Well, dear reader, there was no way on God's green earth that 'da boyz' were going to allow gold to close above $5,000 spot yesterday, as the optics going into the weekend would not have been good. That was especially true considering the fact that from 9:02 a.m. EST onwards, the dollar index began to sink into oblivion.
For the second day in a row, the big move in the gold price only happened on volume that wasn't at all overly large. The same can't be said about silver's volume, however.
In and e-mail I received from reader Alvaro de Orleans-Borbon yesterday he had this to say..."on purpose, I watched for many minutes until I saw on the fast ticks silver price chart the moment – 15:46 GMT on January 23rd, 2026 – when silver actually passed the 100 $/oz. price -- and I stood up and saluted Ted Butler – he deserved it." Yes, it's a tragedy that Ted's not here to see what we are witness to -- as his "Bonfire of the Silver Shorts" is now playing out in real time in front of us.
Silver was already over $101 spot when I rolled out of bed yesterday morning PST -- and I spent the the rest of the New York trading session waiting for the hammer to fall....which never did.
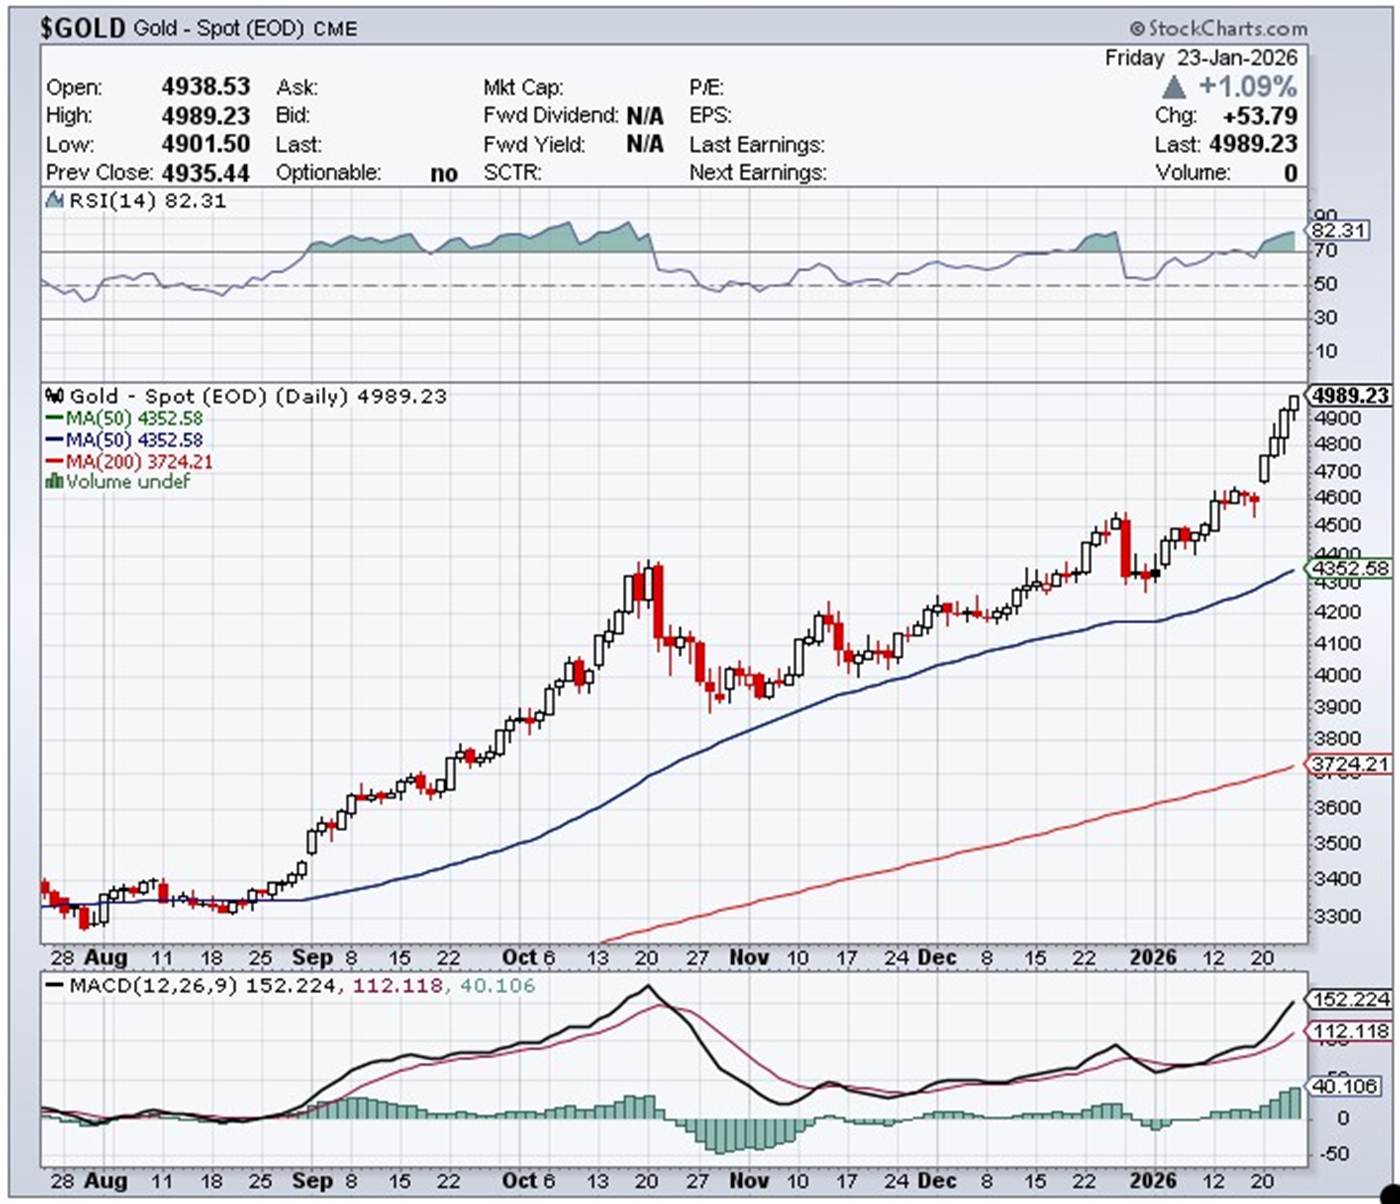
Or course it almost goes without saying that both these precious metals closed at new record nominal highs yesterday. Gold is now back into nosebleed territory on its RSI trace. Silver's in overbought territory as well, but not nearly as much as gold. These facts haven't meant too much lately -- and it remains to be seen if it means anything this time around.
As I stated in a headline to one of my columns a few weeks back, we were in terra incognita as far as the silver price was concerned -- and that's even more the case now. One can safely make the case that this applies to the other three precious metals as well.
As far as the precious metal share performance was concerned...it was awful yesterday, especially the silver equities -- and I'll have more on this below the charts.
Platinum gapped higher yesterday and it too closed at a new nominal high price -- and is barely in overbought territory on its RSI trace. Ditto for palladium, which was capped and turned lower very shortly after it broke above $2,000 spot. It still has some ways to go before it gets into overbought territory.
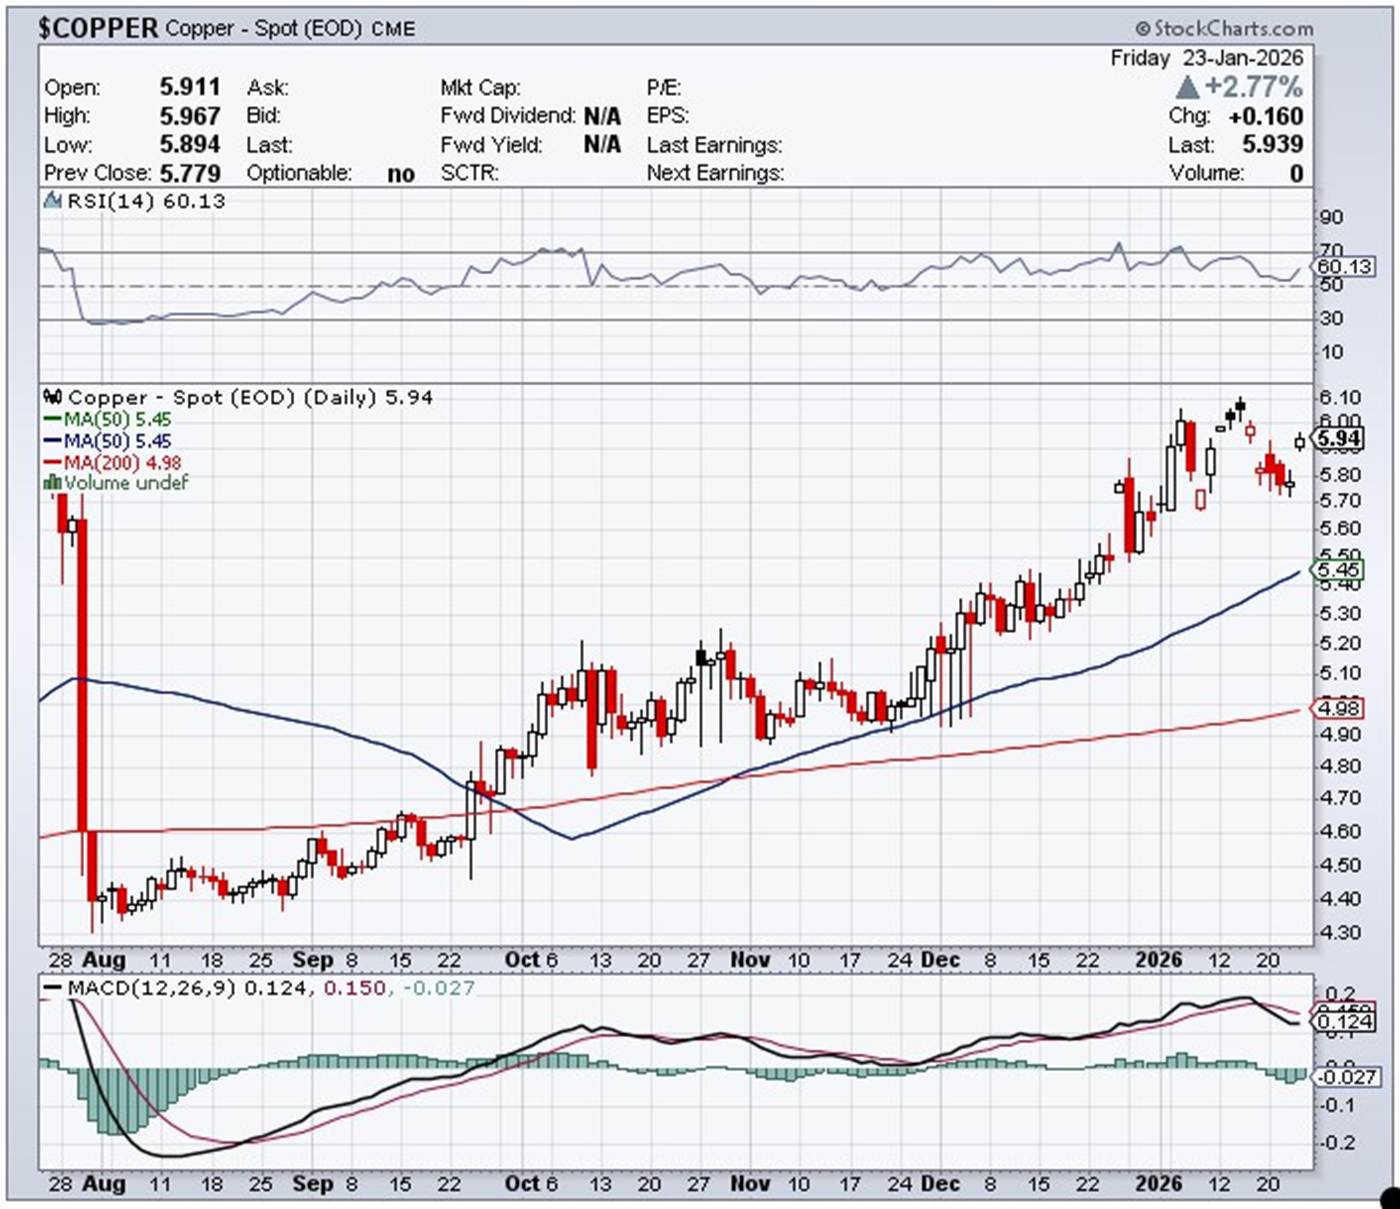
Copper was finally allowed to join the party yesterday, as it gapped higher by 16 cents/2.77% -- and finished the Friday trading session at $5.94/pound.
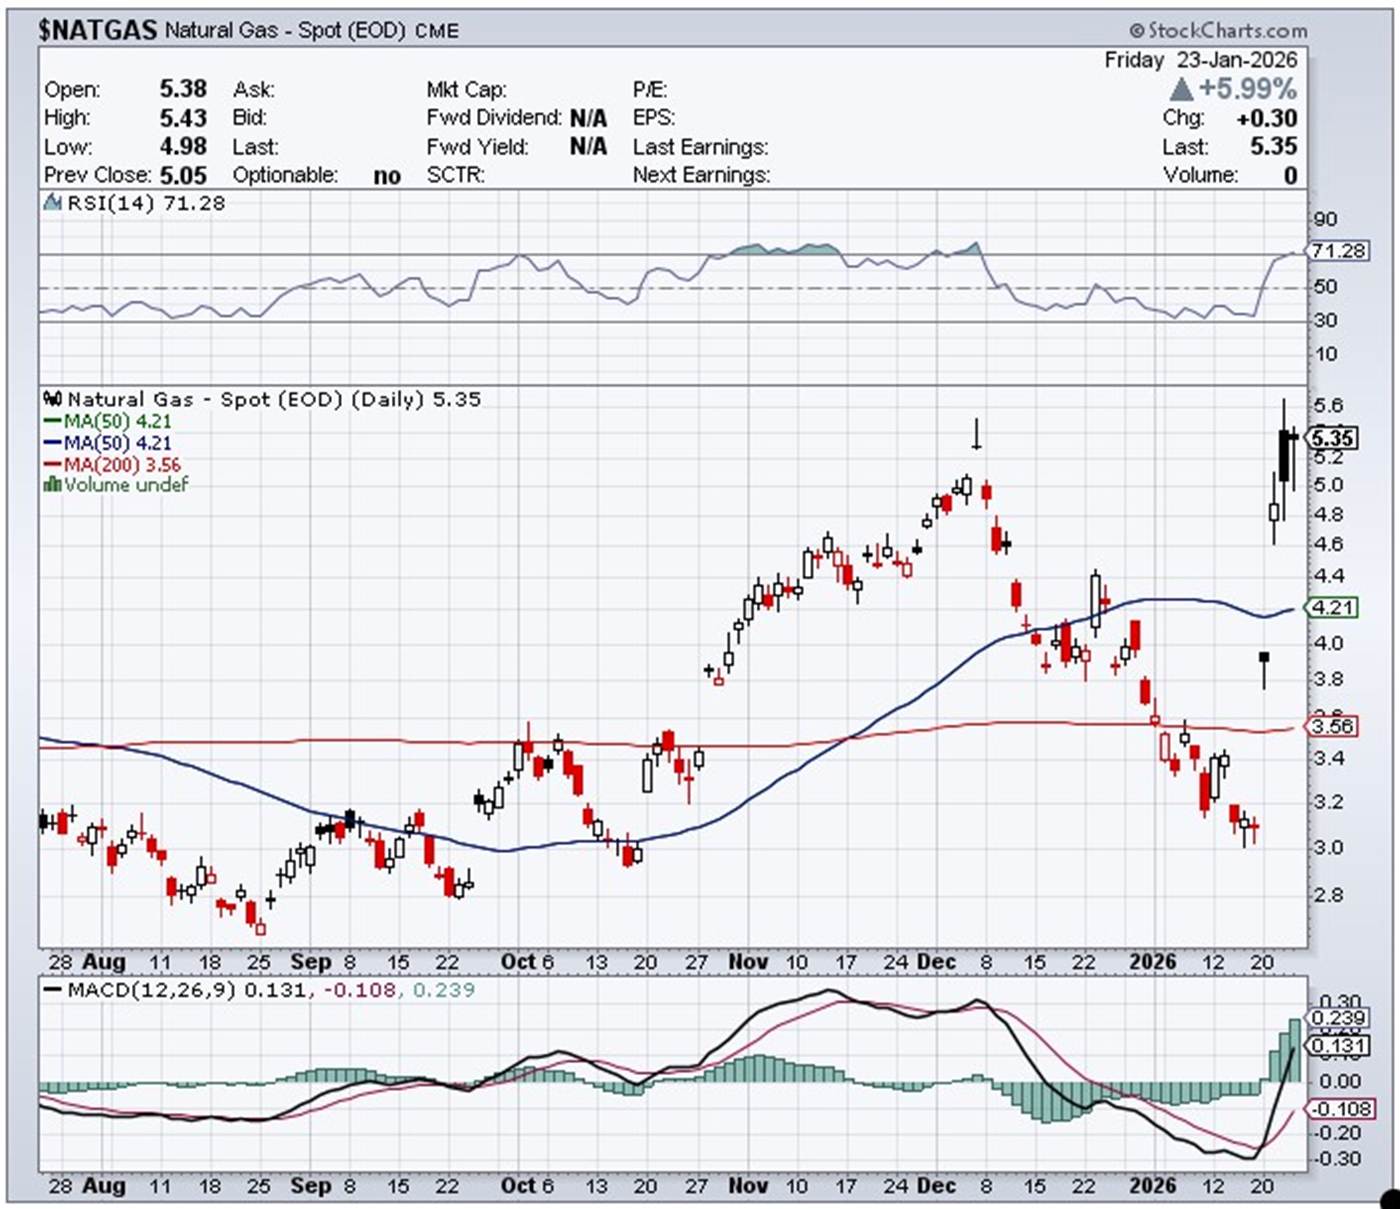
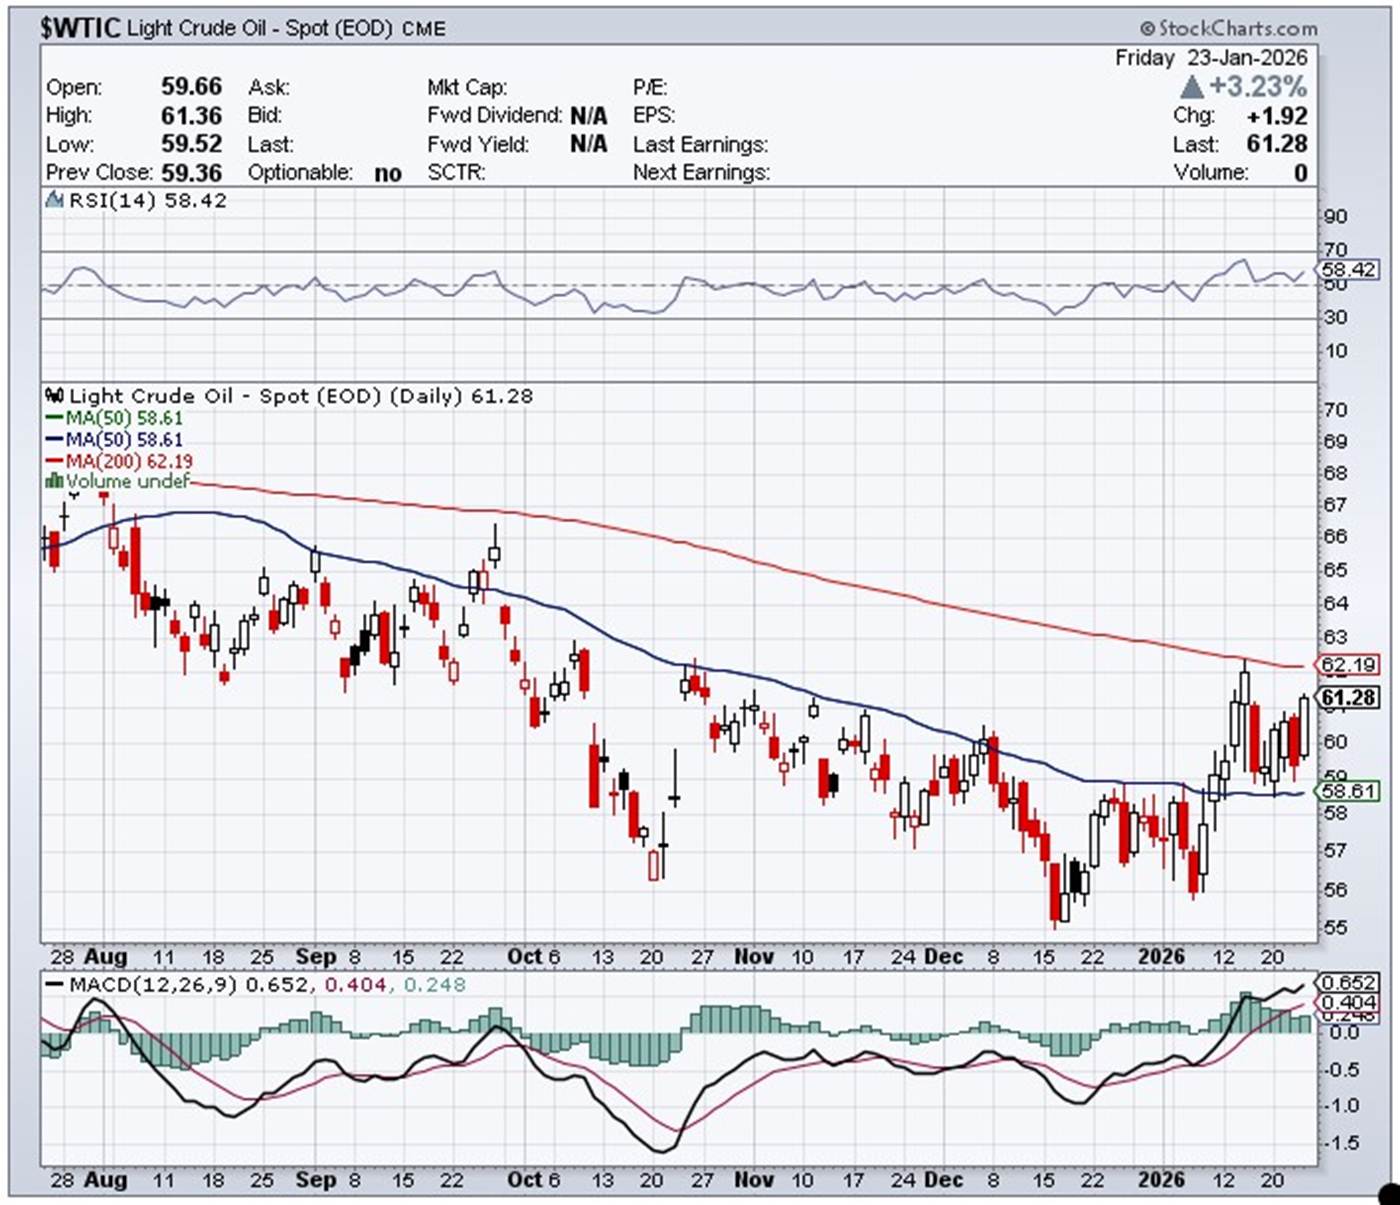
Natural gas [chart included] had another fairly wild session yesterday, as it closed up a further 30 cents/5.99% at $5.35/1,000 cubic feet. The weather outlook for most of the lower 48 states for the next week is awful. And after a big 'down' day on Thursday, WTIC came roaring back yesterday -- and finished the Friday trading session at $61.28/barrel...up $1.92/3.23%.
Here are the 6-month charts for the Big 6+1 commodities as of the COMEX close yesterday...thanks to stockcharts.com as always. The silver chart is back to normal for once. Click to enlarge.
Silver demand, both on an industrial and retail level, remains on fire globally. I noted over at Border Gold in Surrey, B.C...a few hours drive from where I live...that of the sixteen silver items that they normally carry, they only had one item in stock...the Royal Canadian Mint's 100 troy ounce bar...at CAN$14,810 a copy, although they and others are reporting a lot of customers are selling back to them in order to make a profit.
In a story that was posted in the Critical Reads section yesterday, the headline stated that "China’s Silver Rush: ‘Aunties’ Line Up in Shenzhen as Retail Buyers Swamp Refiners and Banks".
So the retail silver rush is on in China, India -- and pretty much everywhere else on Planet Earth as well -- and will certainly get a further boost from it new 3-digit closing price yesterday. Retail supply has now morphed into what the sovereign and private mints can produce...plus what is sold back to retail stores for a profit. That's all there is...because there isn't any more supply after that.
Top that off with the fact that the tens of millions of citizens of the world that have a brokerage account and a cellphone, can hit the 'ask' on the very limited number of silver and gold equities that exist in the investment world. With silver over $100...the mania phase can't be far off.
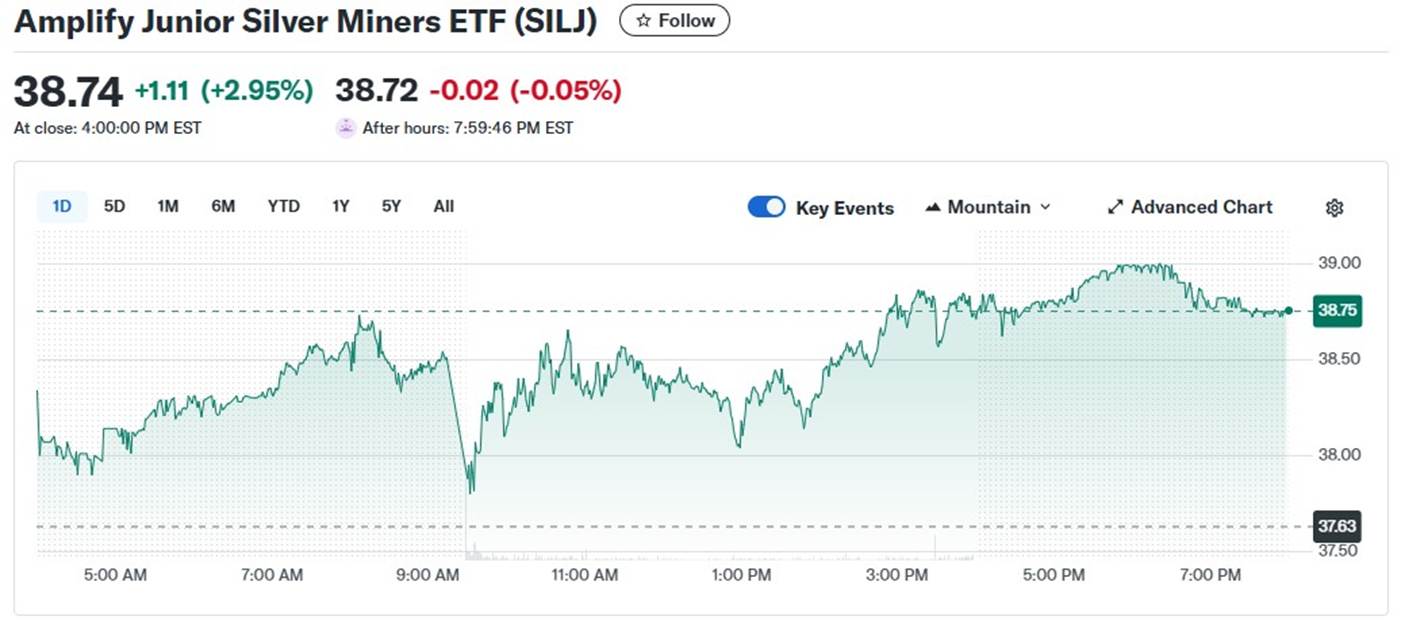
But it was obvious again yesterday that there are algorithms at work to prevent that showing up in the silver stocks to the extent that they should. Here's the Friday chart for SILJ -- and although it was up big in the pre-market, at 8:15 some sort of algorithm kicked in -- and then exactly an hour after that, prices were spun even lower in an absolute straight line -- and it had a hole to dig itself out of once again...like it did on a number of occasions earlier this week. And if you compare this to chart to the HUI...they are carbon copies of each other...which is not possible in a free market. Click to enlarge.
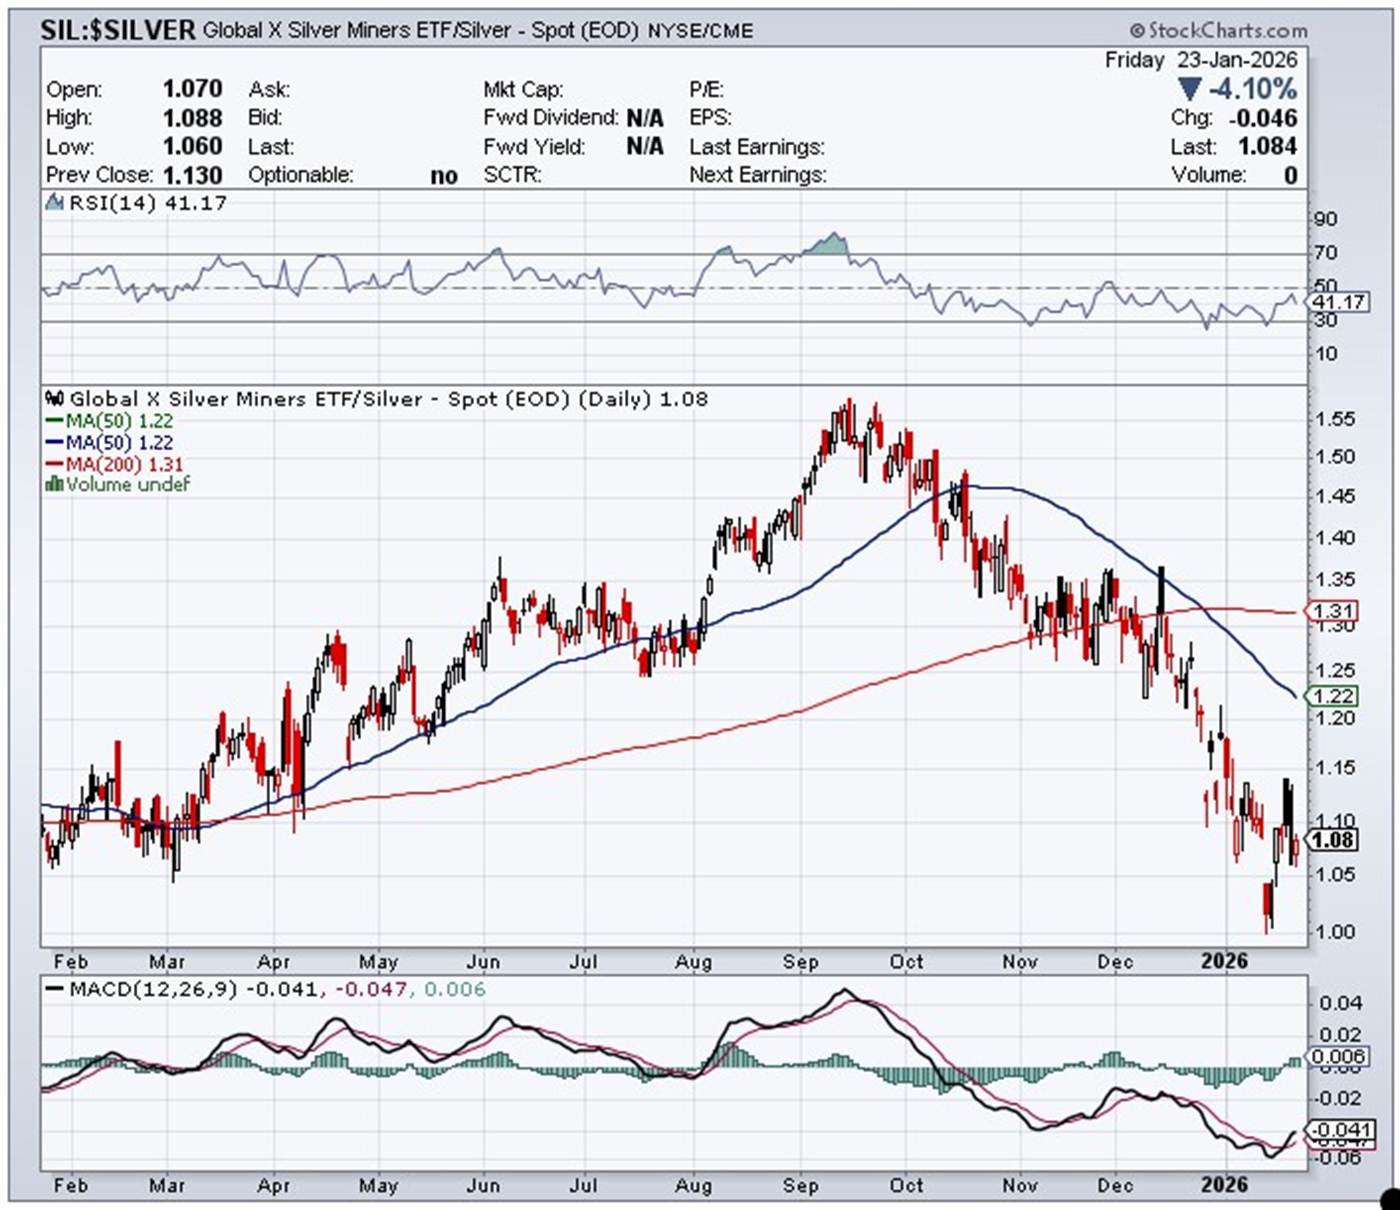
And here once again, is the stockcharts.com graph showing the share price of SIL vs. the silver price -- and it all started on back on Tuesday, September 16 of last year where the algos kicked in -- and the serious rigging began.
At the end of last week, the correlation between the silver price and SIL was 1:1. At the close of trading yesterday, it was 1.08 to 1 -- and note that big 'up' candle on Thursday where there was no algos/market rigging going on. Nick's Silver Sentiment Index closed up 7.78 percent that day...vs. 4.47 percent on Friday. Click to enlarge.
Like you, I'm in shock at the performance of the silver equities so far this year...but in reality, every silver company in our portfolios should be at least double the price of what they show. This applies to the gold equities too, as the algos are running there as well...but with a much softer touch. That's why the gold shares are 'outperforming' the silver stocks on a relative basis... although not on an absolute basis.
By the time Monday's column hits your in-box on Tuesday morning, the January delivery month will be drawing to a close -- and the big scheduled February delivery month in gold will be upon us. All the large traders holding COMEX futures contracts in that month -- and that aren't standing for delivery, have to roll or sell them by the COMEX close on Wednesday -- and the rest have to be out by the same time on Thursday.
And one last thing before I wrap up. The silver inventory levels at the Shanghai Gold and Futures Exchanges are at 10-year lows -- and there's a growing silver mania in its 1+ billion population. The silver price premium in China over the U.S. price hit a fifteen-year high of 14.14% yesterday -- and I'm wondering when they will put the brakes on silver exports. The mechanism to do that has been in place since January 1 -- and I suspect that it will only a matter of time before they do.
When that does, in fact, occur...I'll leave the rest up to your imagination.
I'm done for the day -- and the week -- and I'm still "all in".
See you here on Tuesday,
Ed
About the author

SUBSCRIBE: https://edsteergoldsilver.com/

Ed Steer’s Daily Analysis of the Gold and Silver Markets
After eight years of writing about the precious metals for Casey Research, the folks at Stansberry & Associates—who just recently purchased controlling interest in the company—decided that my ‘niche market’ column didn’t fit into their plans.
Since the time that Casey Research was kind enough to offer me a stand-alone column, it became their most highly-rated blog almost from the outset—and has remained that way up to this date...