The silver market has experienced serious changes which precious metal investors need to be aware. Unfortunately, there is a shortage of information and data to provide investors with important key factors going forward. To understand the silver cost-price dynamics, investors need to see the following three charts below.
I did an interview with Jason Burack from Wall Street for Main Street a few days ago (to be published shortly) on the future value of precious metals. My analysis looks at how energy will be the driving force in pushing the value of gold and silver to substantially higher levels.
When I wrote the article Gold & Silver Prices To Surge On Fundamentals, Not Technical Analysis, many readers who made comments assumed the lower price of oil would guarantee lower precious metal prices for quite some time. While this sounds logical at face value, I believe the opposite is the case.
Before I get into why I believe the value of silver will surge in the future, let’s look at some silver price vs cost fundamentals.
The Price Of Silver vs The Price Of A Barrel Of Oil
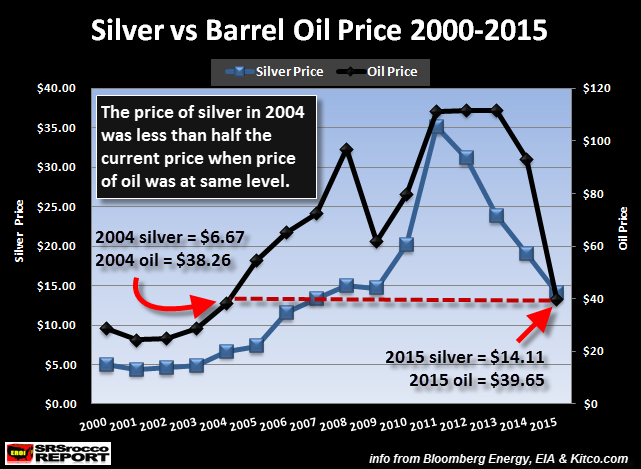
The price of silver has moved in tandem with the price of a barrel of oil for nearly 100+ years. Here is a chart showing the change in the price of oil and silver since 2000:

As we can see in the chart, as the price of oil moved up higher, so did the price of silver. Some technical analysts may see this as merely a coincidence…. it’s not. Energy is the key factor that drives the value of most assets. This is not up for debate, even though many individuals will continue wasting their time trying to prove otherwise.
Now, the important thing to see in this first chart is the relationship between the silver price and oil price today versus what it was the last time oil traded at that level. To do that, we have to go all the way back until 2004 when a barrel of Brent Crude was trading the same as it is today.
The current price of Brent Crude is $39.65 and the price of silver is $14.11. However, when the price of Brent Crude was $38.26 in 2004, the price of silver was less than half at $6.67. This may give silver investors a lousy feeling as this past relationship portends for a much lower silver price.
Don’t worry, the fundamentals show that the present silver market structure is much different from it was just a decade ago.
Silver Mining Yields & Costs Head In Opposite Directions
Several of my readers have sent me emails worried that the lower price of oil will translate into much lower silver prices. While this sounds like common sense, there are several factors that reveal a much different picture.
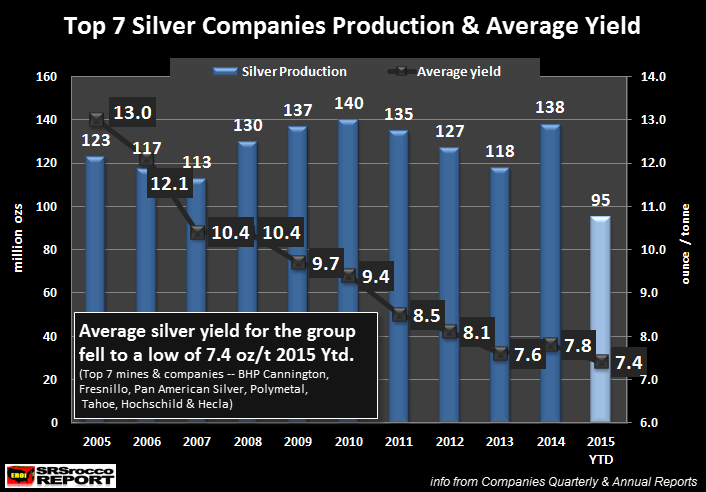
One aspect of the silver market that isn’t discussed in detail by the precious metal community is the huge decline in average yield by the primary silver mining industry. I believe I am one of the only analysts that have published charts showing the decline in average yield in the top silver producers.

From 2005 to 2013 the average yield from the top six silver companies (including one primary silver mine) fell from 13 ounces per tonne (oz/t) to 7.6 oz/t. This was a 42% decline in average yield in just eight years. However, this downward trend reversed in 2014 as Tahoe Resources brought on its new super high-grade Escobal Mine in Guatemala. In 2014, Tahoe Resources Escobal Mine average yield was a staggering 16 oz/t.
What is interesting, by adding the this super high-grade Escobal Mine to the group, it only pushed up the group’s average yield to 7.8 oz/t. Moreover, if we look at the data for 2015 year to date (Q1-Q3), the average yield is heading lower once again. One of the reasons the group’s average silver yield declined to 7.4 oz/t this year was due to the large fall in Tahoe Resources Escobal Mine’s average yield. It fell from 16 oz/t in 2014 to 13 oz/t for the first three-quarters of 2015.
Some analysts are saying the primary silver miners have been high-grading their mines in order to stay profitable. While this may be true for several mines in some of the companies, this is not the trend for the entire primary silver mining industry. If it was, we would have seen an increase in the average yield in 2015, not a decline.
Investors need to realize the primary silver mining industry is processing almost double the amount of ore to produce the same or even less silver than it was just a decade ago. You don’t have to take my word for it, here is the data:
Top 7 Primary Silver Miners Total Processed Ore
2005 = 9,444,000 metric tons
2014 = 17,776,000 metric tons
While it’s not quite double, it’s close. This huge increase in processed ore has a profound impact on the cost to produce silver. To get a better idea of how it impacts the primary silver mining industry’s bottom line, let’s look at one of the largest silver producers in the world.
Pan American Silver: Evidence Of Rising Costs
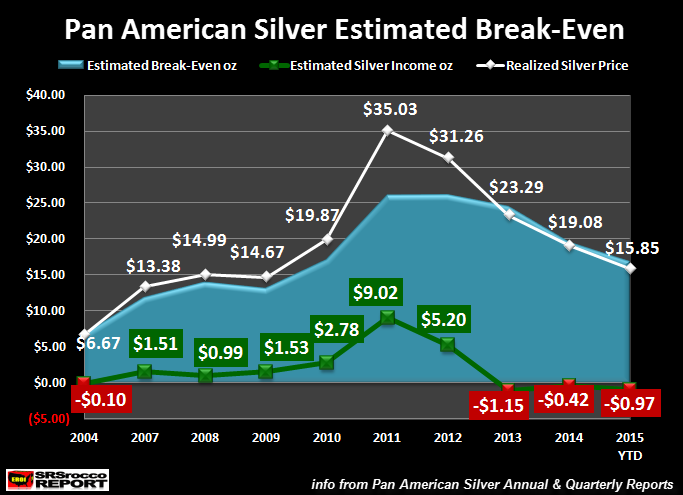
If we look at one of the largest primary silver mining companies in the world, we can see just how much higher costs are today compared to a decade ago. This chart shows the average annual price Pan American Silver received for silver (White line), the estimated break-even (Light blue area) and the estimated silver income per ounce (Green or Red). The green color denotes a profit while red represents a loss:

The realized silver price Pan American received that year was close to the average market price (Note: some older years, the realized price was not stated in the Annual Report so, I used the average market price). According to my estimated break-even calculations, Pan American lost an estimated 10 cents an ounce in 2004, this turned positive for years 2007-2012 and then fell negative for the past three years.
The estimated silver profit per ounce for Pan American Silver peaked in 2011 at $9.02 an ounce. Now, what is interesting about this chart is the cost and market price ratio since 2004. I did not include 2005 or 2006, because the chart was originally designed from years 2007-2014. I plan on adding years all the way back until 2000, but that will be in an upcoming Report.
Regardless, Pan American Silver lost 10 cents an ounce in 2004 when the average market price for silver was $6.67. Thus, Pan American Silver needed to receive $6.77 to break-even. This was during the year when the price of a barrel of Brent Crude was $38. Now, if we look at Pan American Silver’s results for the first nine months of 2015, they received an average of $15.85 for silver, but lost 97 cents for each ounce produced.
Which means, Pan American Silver needed to received $16.82 for the first nine months of 2015 to break-even. Again, this is according to my “Estimated Break-Even Analysis” based on using Adjusted Income. For Example, Pan American Silver reported a $19 million net income profit in 2004, but this was due to a sale of a property (asset) in the amount of $23.7 million. The net income gain that year was not the result of profitable silver mining, but rather due to the sale of a property.
This is the reason I use the Adjusted Income approach in determining a more realistic cost to produce silver.
Even though Pan American Silver has been able to lower their break-even by extensive cost cutting and lower energy prices, we can see they still lost 97 cents an ounce at a realized price of $15.85 in 2015 versus losing 10 cents an ounce in 2004 when the market price of silver was $6.67.
Pan American Estimated Break Even:
2004 = $6.77
2015 Ytd = $16.82
Now, if the price of oil continues to fall, the primary silver mining industry could see additional declines in their overall cost to produce the metal. That being said, I don’t see a huge drop in overall costs for the primary mining industry going forward. This is due to generally higher inflation and falling yields. It just cost a lot more today to produce silver than it did a decade ago… even with the same oil price.
While it’s true that Pan American Silver is only one company, the overall cost structure is about the same for the entire industry. Thus, a lower oil price will not translate into the same corresponding silver market price we had in 2004.
The silver market and industry are experiencing serious changes, and it’s only a matter of time before investors realize it is one of the most undervalued assets in the world.
Silver Commodity Pricing vs A Store Of Value Asset
The one important factor investors need to understand about silver is the difference between “Commodity Pricing” and “Store Of Value Asset.” Currently, silver and gold are being valued as a commodity. This is based upon cost of production including supply and demand forces. If the industry cost to produce gold was $500, the current market price would be much lower.
However, the cost to mine gold is close to its market price. This is the same for silver. We can see this in the Pan American Silver break-even price. Of course, supply and demand play a part, but these forces are artificially manipulated due to the massive siphoning of investors funds into financial paper products (some call them assets… they are not) over the past several decades.
Because the current price to produce silver for the primary mining industry is close the current market price, investors do not understand why precious metal analysts continue to say that silver is severely undervalued.
IMPORTANT FACTOR: Silver is not undervalued due to its present primary silver mining production cost, but rather due to its misunderstood store of value principles compared to most financial paper assets under management.
As the world’s Great Financial Ponzi Scheme disintegrates under the weight of collapsing U.S. and global oil production, investors will move into hard assets such as gold and silver to protect wealth. We are already witnessing the beginning stages of this.
Investors have kept their money in bank accounts to earn interest. However, as interest rates have fallen to zero and soon negative, there is no motivation for investors to keep funds in these accounts. Matter-a-fact, the notion that gold and silver don’t earn a yield may no longer be a concern to the wealthy who just want to protect their wealth from the possibility of bank bail-ins or etc.
In addition, we are seeing more and more companies reduce or totally remove their stock dividend payouts. Investors who may have been worried about stock market valuations, have kept the shares because they continue to receive dividend payouts. What happens when the majority of stock dividends totally evaporate?
The world is entering into a terminal phase in which it’s unprepared. There will be very few assets to protect wealth in the future. Gold and silver happen to be two of the most safest and proven stores of value for over 2,000 years.
Please check back for new articles and updates at the SRSrocco Report. You can also follow us at Twitter below:


