I shan't bother with the play-by-play in any of the four precious metals, as you know perfectly well what happened...as it was a premeditated and coordinated assault by the collusive commercial traders of whatever stripe. I'll get into the ugly details in The Wrap.
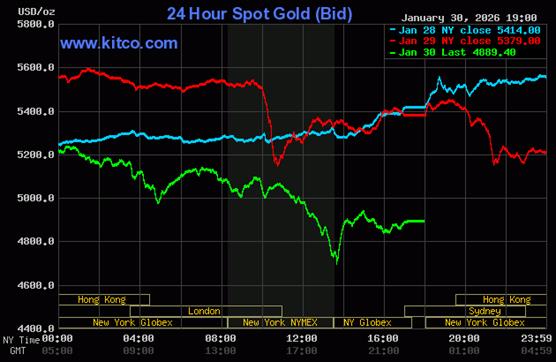
The high and low ticks in gold were recorded as $5,480.20 and $4,700.40 in the April contract...an intraday move of $779.80 an ounce. The February/ April price spread differential in gold at the close in New York yesterday was $31.20 ...April/ June was $35.60...June/August was $35.80 -- and August/October was $31.60 an ounce...big drops from what they were in the January delivery month.
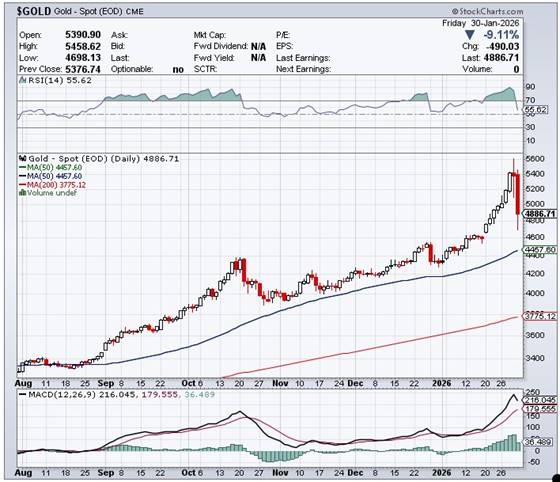
Gold was closed in New York on Friday afternoon at $4,889.40 spot...down $489.60/9.10% on the day, but $197.80 off its Kitco-recorded low tick. Net volume was beyond Neptune at about 434,000 contracts -- and there were around 76,000 contracts worth of roll-over/switch volume on top of that.
But, as is always the case, it was silver that 'da boyz' were really after -- and they got it good.
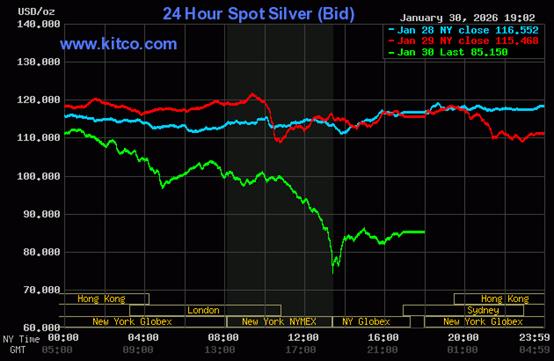
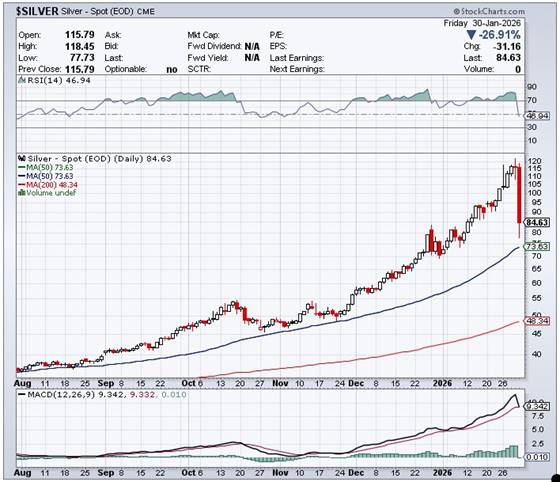
The high and low ticks in it were reported by the CME Group as $118.45 and $74.00 in the March contract...an intraday move of $44.45 the ounce. Wow! The March/May price spread differential in silver at the close in New York yesterday was 60.9 cents...May/July was 63.0 cents...July/September was 64.7 cents -- and September/December was 64.6 cents an ounce.
Silver was closed on Friday afternoon in New York at $85.15 spot...down $30.32/26.26% on the day -- and $11.48 off its low tick -- and $33.18 off its high. Unbelievable! Net HFT gold volume was past Pluto at around 266,500 contracts -- and there were about 51,000 contracts worth of roll-over/switch volume in this precious metal.
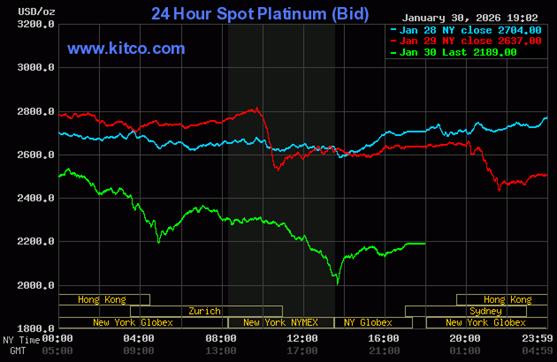
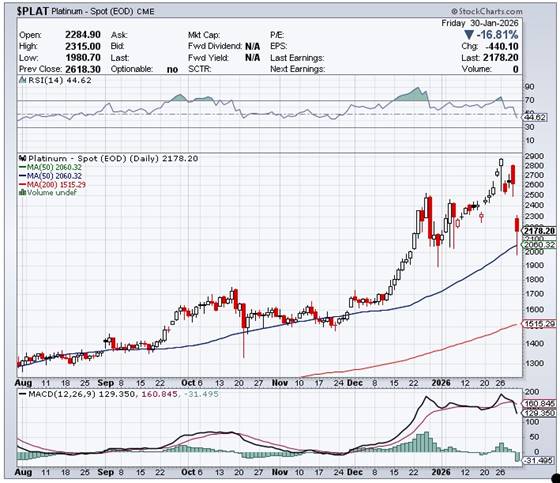
Platinum was closed at $2,189 spot...down $448/16.99% on the day...$193 off its low tick -- and $480 off its Kitco-recorded high.
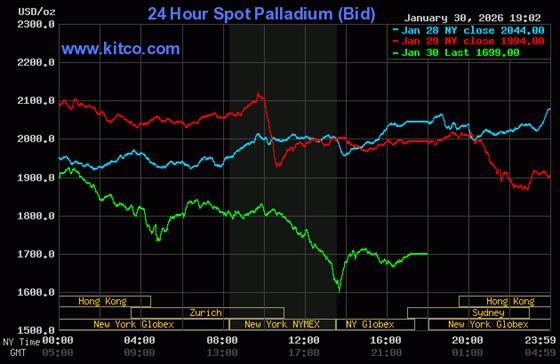
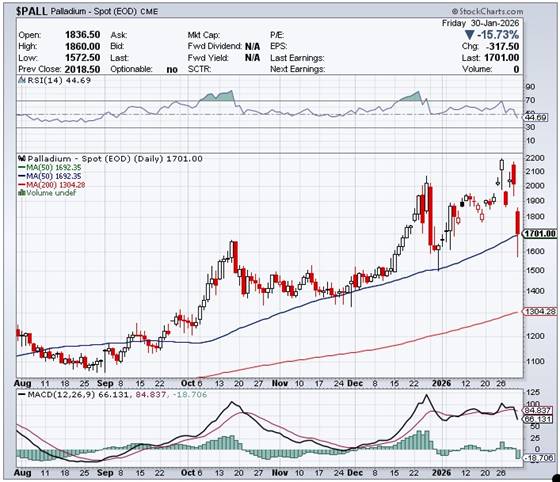
Palladium was closed at $1,699 spot...down $295/14.79% from Thursday... $110 off its low tick of the day -- and $323 off its Kitco-recorded high tick.
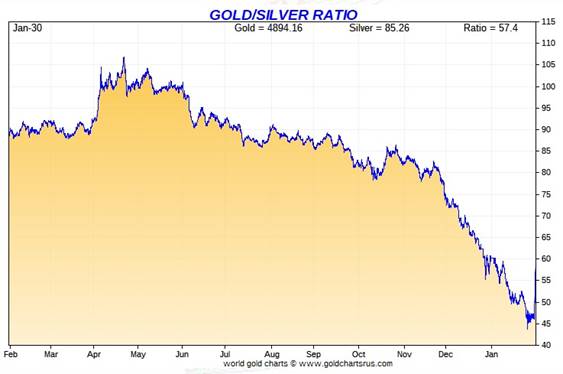
Based on the kitco.com closing prices in silver and gold posted above...the gold/silver ratio blew out to 57.4 to 1 on Friday...compared to 46.6 to 1 on Thursday.
Here's the 1-year Gold/Silver Ratio chart from Nick Laird -- and updated with this past week's data. Click to enlarge.
![]()
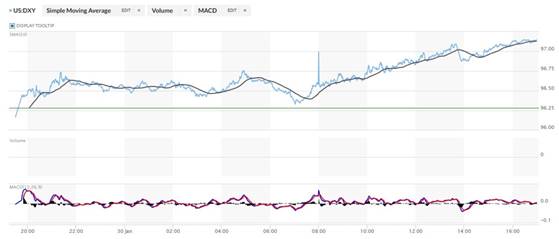
The dollar index was marked-to-close on Thursday afternoon in New York at 96.28 -- and then opened lower by 11 basis points once trading commenced at 7:30 p.m. EST on Thursday evening...which was 8:30 a.m. China Standard Time on their Friday morning. It then chopped two quiet steps higher until around 10:22 a.m. CST...wandered quietly lower until 8:22 a.m. in London -- and then rallied a bit until 9:55 a.m. GMT. It was down hill from that juncture until its low tick was set at 12:02 p.m. GMT...the noon silver fix over there. A rather suspicious looking 'rally' got underway at that point -- and except for one minor pothole, continued higher until around 4:25 p.m. in New York. It didn't do much after that.
The dollar index finished the Friday trading session in New York at 97.15...up 87 basis points from its close on Thursday.
Here's the DXY chart for Friday...thanks to marketwatch.com as always... click to enlarge.
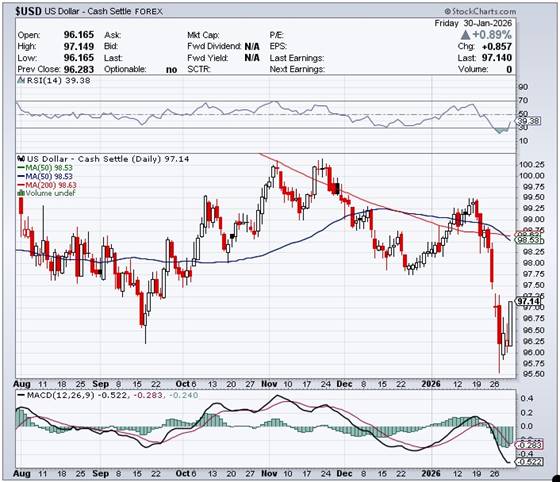
Here's the 6-month U.S. dollar index chart...courtesy of stockcharts.com as always. The delta between its close...97.14....and the close on DXY chart above, was 1 basis point below that. Click to enlarge.
With the exception of palladium, the other three precious metals began their biggest declines at the start of that DXY 'rally' at the noon silver fix in London -- and I have a strong feeling that 'da boyz'...like the did on Thursday... greased the skids by running the dollar index shorts.
U.S. 10-year Treasury: 4.2410%...up 0.0140/0.33%...as of the 1:59:54 CST close
The Fed had to step into the treasury market on at least two separate occasions on Friday to ensure that the ten-year yield didn't close up even more than it did.
For the week, the ten-year yield closed higher by 0.002 basis points. The reason it wasn't up far more than that, came courtesy of the continuing interventions by the Fed.
Here's the 5-year 10-year U.S. Treasury chart from the yahoo.com Internet site -- which puts the yield curve into a somewhat longer-term perspective. Click to enlarge.
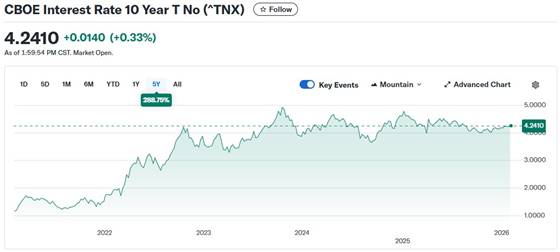
As I keep pointing out in this spot every Saturday, the 10-year hasn't been allowed to trade above its 4.92% high set back on October 15, 2023...but I still suspect that we've seen the 3.9482% low for this cycle...which was set back on October 22, 2025. QT came to an end about two months ago now -- and more rate cuts in 2026 are expected, although we didn't get one on Wednesday. QE is here already, but being cleverly disguised -- and after Davos last week, all bets are off in everything...both at home and abroad.
![]()
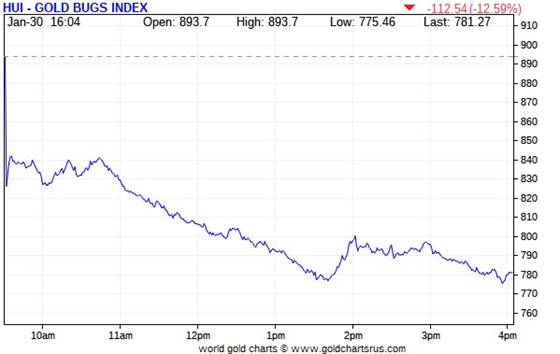
Not surprisingly, the gold shares gapped down at the 9:30 opens of the equity markets in New York on Friday morning -- and then managed to chop a bit higher until 10:45 a.m. EST. But then 'da boyz' really got serious with gold -- and except for a slight bump higher after the 1:30 p.m. COMEX close, they continued lower until a very few minutes before trading ended at 4:00 p.m. EST. The HUI closed a hair off its low tick...down 12.59 percent on the day.
Not surprisingly, the silver stocks got beaten up even worse, as Nick Laird's Silver Sentiment Index was crushed by 17.97 percent. Click to enlarge...if you dare!
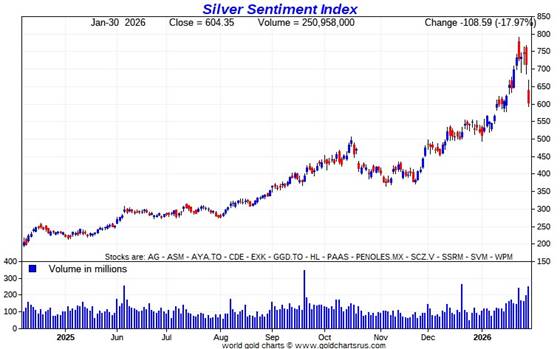
I didn't even bother looking at their share prices yesterday...as it goes without saying they were all dogs by varying degrees -- and for the same reason, I don't know if there was any news on any of the silver companies in the above Silver Sentiment Index.
Of course all those precious metal shares sold in a panic yesterday found a buyer -- and I'm already wondering if their new owners wear white hats...or black hats. We'll find out in due course.
The silver price premium in Shanghai over the U.S. spot price on Friday set a new record high...17.54 percent.
The reddit.com/Wallstreetsilver website, now under 'new' and somewhat improved management, is linked here. The link to two other silver forums are here -- and here.
![]()
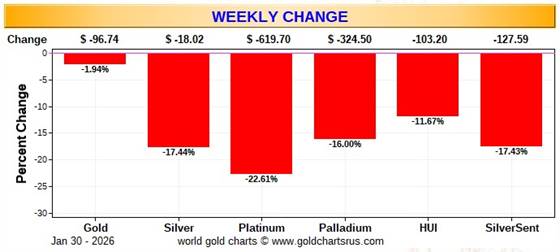
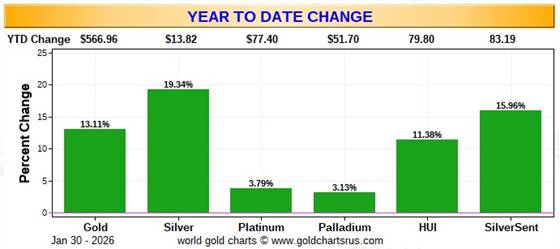
Here are two of the usual three charts that appears in this spot in every weekend missive. They show the changes in gold, silver, platinum and palladium in both percent and dollar and cents terms, as of their Friday closes in New York — along with the changes in the HUI and the Silver Sentiment Index.
Here's the weekly chart -- and not surprisingly, it's wall-to-wall red. Relative to the gold price itself, the HUI got hammered. Although silver got clubbed worse...it's shares didn't underperform the metal. Cold comfort, of course...but worth noting. Click to enlarge.
Here's the year-to-date chart...which does double duty as the month-to-date chart for this one month only. Although still wall-to-wall green...it's monthly gains have been savaged because of yesterday's price action. As I've been pointing out for months now...the silver equities have been underperforming the metal itself...as its stocks have been actively managed since mid September. But now even the gold shares are underperforming relative to gold. Click to enlarge.
Despite the fact that silver has now broken the $120 barrier...albeit briefly -- and the silver well in London is close to running on empty...the gold/silver ratio remains at a farcical 57.4 to 1 as of the Friday's close. The 'normal' and historical ratio is around 15 to 1...which would put silver at around $325. And if priced at the ratio of 7:1 that it comes out of the ground at, compared to gold...that would put silver at a bit under $700 an ounce. So a rather impressive triple-digit silver price is in our future. As I say in this spot every Saturday...all that remains to be resolved is what that number will be -- and how soon 'da boyz' allow it to happen.
![]()
The CME Daily Delivery Report for Day 2 of February deliveries showed that 7,036 gold, plus 633 silver contracts were posted for delivery within the COMEX-approved depositories on Tuesday.
In gold, the three largest short/issuers by far were BofA Securities, British bank Barclays and Wells Fargo Securities, issuing 2,012...1,853 and 1,157 contracts respectively...Barclays from their client account.
The biggest long/stopper was Citigroup, picking up 3,050 contracts for their house account...followed by JPMorgan, stopping 1,684 contracts for clients. The next three down the list were Canada's BMO [Bank of Montreal] Capital Markets, French bank PNB Paribas -- and Canada's RBC [Royal Bank of Canada] Capital Markets...stopping 628, 591 and 489 contracts -- and all for their respective house accounts.
In silver, the sole short/issuer of all 633 contracts was JPMorgan out of its client account. There was a big list of long/stoppers -- and the three largest were JPMorgan, Wells Fargo Securities -- and Australia's Macquarie Futures, picking up 147, 122 and 115 contracts respectively...JPMorgan for their client account.
In platinum and palladium, there were 14 and 12 contracts issued and stopped respectively.
In copper, another 1,544 contracts were issued and stopped...4,520 COMEX contracts so far this month already.
The link to yesterday's Issuers and Stoppers Report is here -- and it's definitely worth a look if you have the interest.
Month-to-date, only two delivery days old, there have been 27,520 gold contracts issued/reissued and stopped already -- and that number in silver is 2,514 COMEX contracts. In platinum, it's 180 -- and in palladium, it's 26.
Looking back at January deliveries one last time, there were 11,872 gold, plus 9,889 silver contracts issued/reissued and stopped that month. On First Day Notice for January deliveries back on December 30, there were 4,075 gold contracts -- and 4,461 COMEX silver contracts still open...so there were an absolutely staggering number of silver and gold contracts added to the January delivery month as it moved along...almost 7,800 in gold -- and over 5,400 in silver.
The rush to convert paper long contracts into physical metal remains "rapacious."
The CME Preliminary Report for the Friday trading session showed that gold open interest in February decreased by 18,643 contracts, leaving 11,439 still around...minus the 7,036 contracts out for delivery on Tuesday as per the above Daily Delivery Report. Thursday's Daily Delivery Report showed that 20,484 gold contracts were actually posted for delivery on Monday, so that means that 20,484-18,643=1,841 more gold contracts just got added to the February delivery month.
Silver o.i. in February dropped by 1,469 contracts, leaving 1,232 contracts still open...minus the 633 contracts out for delivery on Tuesday as mentioned a bunch of paragraphs ago. Thursday's Daily Delivery Report showed that 1,881 silver contracts were actually posted for delivery on Monday, so that means that 1,881-1,469=412 more silver contracts were to February deliveries, which is a lot...more than three truckloads.
Total gold open interest in the Preliminary Report on Friday night fell by 22,646 COMEX contracts -- and total silver o.i. dropped by 8,055 contracts. Considering the epic price smashes in these two precious metals on Friday, I was expecting far bigger declines than this...especially in silver.
[I checked the final total open interest number for gold for Thursday -- and it showed a very decent decline...from -6,482 COMEX contracts, down to -13,613 contracts. Final total silver o.i. for Thursday also fell...from -305 contracts, down to -744 contracts.]
Gold open interest in March in the CME's Final Report on Friday morning fell by a net 259 COMEX contracts, leaving 3,987 COMEX contracts still around -- but silver o.i. in March dropped by 1,071 contracts, leaving 97,949 contracts still open.
![]()
I was surprised to see that 18,385 troy ounces of gold were added to GLD yesterday and, for once, there were no reported changes in SLV.
One can only hope that the big shorts in both GLD and SLV...'da boyz'...were able to cover a boatload of their short positions -- and if they did, I also hope that this will show up in the next short report...as the cut-off for it was yesterday at the close of trading.
The SLV borrow rate started the Friday session at 0.60% -- and ended it at 0.67% with 5.7 million shares available to short. The GLD borrow rate began the day at 0.56% -- and finished it at 0.55%...with 7.5 million shares available.
In other gold and silver ETFs and mutual funds on Earth on Friday ...net of any changes in COMEX, GLD and SLV activity, there were a net and amazing 988,050 troy ounces of gold added, with the largest amount... 471,277 troy ounces...going into UBS, plus 375,546 troy ounces into iShares.
In silver, a net and further 3,262,130 troy ounces of silver were taken out, with the lion's share...2,267,736 troy ounces...coming out of iShares/SSLN.
And nothing from the U.S. Mint.
![]()
The only activity in gold over at the COMEX-approved depositories on the U.S. east coast on Thursday were the hefty 128,604.000 troy ounces/4,000 kilobars that left JPMorgan.
There was a lot of paper activity as a net 253,295 troy ounces were transferred from the Eligible category and into Registered -- and no doubt getting teed up for delivery in February. The two largest amounts were the 193,731 troy ounces that made that trip over at Manfra, Tordella & Brookes, Inc...plus the 128,924 troy ounces transferred in the same direction over at HSBC USA.
The link to all of Thursday's considerable COMEX gold action is here.
But there was no let-up in silver. Only 23,582 troy ounces were received -- and all of that showed up at CNT. There were 2,390,115 troy ounces shipped out, with five different depositories involved.
The two largest 'out' amounts were the 1,126,271 troy ounces that left CNT... followed by the 965,414 troy ounces that departed JPMorgan.
There was hefty paper activity as well. A net 3,277,492 troy ounces were transferred from the Registered category and back into Eligible involving five different depositories. The largest amount by far were the 1,640,683 troy ounces that made that trip over at JPMorgan. The next two largest amounts were the 944,716 and 929,418 troy ounces that made that same trip over at Brink's, Inc. and Manfra, Tordella & Brookes respectively.
The link to all of Thursday's monster COMEX silver action is here.
That makes exactly 50.00 million troy ounces of silver that have been shipped out of the COMEX so far in January.
The Shanghai Futures Exchange updated their silver inventories as of the close of business on their Friday -- and it showed that a net and further 866,147 troy ounces/ 26.940 metric tonnes of silver were removed... leaving their silver inventories at 14.631 million troy ounces/455.068 metric tonnes.
![]()
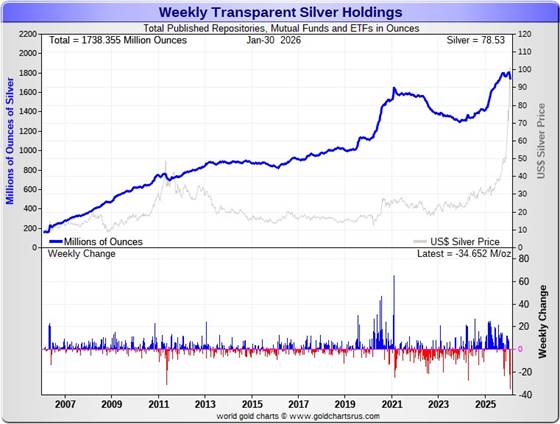
Here are the usual 20-year charts that show up in this space in every weekend column. They show the total amounts of physical gold and silver held in all known depositories, ETFs and mutual funds as of the close of business on Friday.
During the business week just past, there were a net and further 1.448 million troy ounces of gold added...the tenth straight week of additions. But for the third week a row there were huge withdrawals in silver, as a hefty 34.652 million troy ounces of silver were removed this past week.
So, on a parabolic price rise in silver over the last month, a hair under 66 million oz. of silver have been removed from all of the world's ETFs, mutual funds -- and other depositories. WTF?
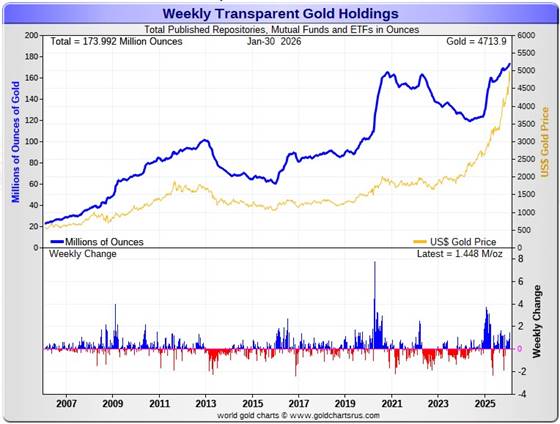
According to Nick Laird's data on his website, a net 3.453 million troy ounces of gold were added to all the world's known depositories, mutual funds and ETFs during the last four weeks. The two largest 'in' amounts were the 1.084 million troy oz. that went into GLD, followed by the 929,300 troy ounces into Tether. The only 'out' amount were noting were the 654,000 troy ounces that departed the COMEX.
The amount of gold in all the world's ETFs and mutual funds remains barely above its old all-time high of late 2020...but should be far higher, more than double its current amount, considering gold's current price...far more than double it was back then. Why it isn't, is beyond me...but there's been a bit of a pickup in January, so hopefully that's the start of something.
On the other hand, a net 65.970 million troy ounces of silver were taken out during that same 4-week time period. The largest 'out' amount were the 34.886 million oz. out of the COMEX...followed by the 29.604 million out of SLV. Way down the list after them was iShares/SSLN...shedding 7.949 million oz.
The biggest 'in' amount over that four-week period were the 23.538 million troy ounces shipped into India's silver ETFs...followed by the 6.965 million oz. into Sprott's PSLV. The rest of the 'in' amounts aren't worth mentioning.
It's been a wild four weeks/January in the physical silver space -- and the only explanations for these massive withdrawals was a conversion of paper silver shares for physical metal and/or the silver was more desperately needed elsewhere.
It should be noted that the amount of silver held in all these depositories, ETFs and mutual funds is a noticeable amount above its old all-time high inventory level of January 2021. But it should be far higher than it is as well, because silver is a bit over 3x the price it was back then.
Back at its previous inventory peak in late January 2021, silver was around $27 an ounce. Now its $58 higher. Why the precious metal ETFs aren't doing better is a mystery for which I have no answer, except for what I mentioned two paragraphs ago.
Retail sales are sky high world wide -- and it's now obvious that most of the more popular silver products are out of stock at almost all on-line retail bullion stores...with deliveries now stretched out to a bit over a month. The mints, both sovereign and private, are going flat out.
As you can see from the numbers a few paragraphs ago, physical demand in silver at the wholesale level remains enormous/ rapacious. COMEX silver deliveries have been monstrous since the start of the year...50 million oz. shipped out in January.
And, as mentioned further up in the Daily Delivery Report, there were 1.187 million troy ounces of gold...plus a whopping 49.445 million troy ounces of silver issued and stopped in January.
The "rapacious" silver demand mentioned two paragraphs ago will continue until available supplies are depleted -- and we're also at the start of the sixth year of a structural deficit in silver according to the ongoing reports from The Silver Institute.
The vast majority of precious metals being held in these depositories are by those who won't be selling until the silver price is many multiples of what it is today...if ever.
Sprott's PSLV is the third largest depository of silver on Planet Earth with 217.7 million troy ounces...unchanged on the week -- and a great distance behind the COMEX, which has now been demoted to the second largest silver depository, where there are 405.9 million troy ounces being held...down a further 10.5 million troy ounces this past week...but minus the 103 million troy ounces being held in trust for SLV by JPMorgan.
That 103 million ounce amount brings JPMorgan's actual silver warehouse stocks down to around the 67 million troy ounce mark...quite a bit different than the 170.6 million they indicate they have...down a net and further 8.3 million troy ounces on the week. They've parted with a lot of silver in the last five or so months...around 45 million oz.
PSLV remains a very long way behind SLV as well -- now the largest silver depository...with 499.1 million troy ounces as of Friday's close...down 18.2 million troy ounces from last week.
Everyone is hemorrhaging silver...except for Sprott's PSLV -- and a handful of smaller players in this space.
The latest short report [for positions held at the close of business on Thursday, January 15 showed that the short position in SLV rose by a further 10.48%... from the 56.57 million shares sold short in the prior report...up to 62.49 million shares in this latest short report that came out this past Tuesday... 11.35% of total SLV shares outstanding. This amount is grotesque, obscene -- and fraudulent beyond all description...as there is no physical silver backing any of it as the SLV prospectus requires.
BlackRock issued a warning five or so years ago to all those short SLV that there might come a time when there wouldn't be enough metal for them to cover. That would only be true if JPMorgan decides not to supply it to whatever entity requires it. However, we appear to be far beyond that point now, as the short position in SLV will never be covered through the deposit of physical silver, as it just doesn't exit -- and never will. And if it does exist, it will only be available at a price far higher than what's being quoted in the public domain now. Those short SLV shares are in equal dire straits as those short silver in the COMEX futures market -- and I suspect that they're the same entities.
Hopefully they were able to cover boatloads of those short positions in yesterday's engineered price decline...as that's another reason why 'da boyz' went after silver as aggressively as they did.
The next short report...for positions held at the close of trading on Friday, January 30/yesterday will be posted on The Wall Street Journal's website on Tuesday afternoon EST on February 10.
Then there's that other little matter of the monster short position in silver and gold held by Bank of America in the OTC market...with JPMorgan & Friends on the long side. Ted said it hadn't gone away. He wrote an article about this back in April 2021 headlined "A New Piece of the Puzzle" -- and linked here.
In the article, the OCC Report stated that BofA had $8.3 billion in precious metal derivatives at the end of Q4/2020 -- and as you'll see in the paragraphs that follow, the BofA's derivatives position is now up to $47.9 billion as of the end of Q3/2025...an almost six-fold increase -- and all because of the increases in the price.
A while after that article came out, he also come to the conclusion that they're short around 25 million ounces of gold with these same parties as well. Once the silver price approaches three digits -- and gold hits $5,000...we'll see if they need to get taken over, like Bear Stearns did back in 2008 -- and for the same reason.
The latest OCC Report for Q3/2025 was posted on their website a month ago now -- and it showed that the precious metal derivatives held by the four largest U.S. banks increased by $137.54 billion/24.4% from Q2/2025...up to $704.05 billion...which is a very hefty amount.
JPMorgan's precious metals derivatives rose from $358.5 billion, up to $437.4 billion from Q2/2025 -- and Citigroup's also rose...from $150.7 billion, up to $204.3 billion. BofA's increased by a tiny bit...from $44.7 billion, up to $47.9 billion -- and the derivatives position held by Goldman Sachs is a piddling and immaterial $614 million -- up from the equally piddling $219 million it held in Q2/2025.
But with JPMorgan holding 62.1% of all the precious metals derivatives... Citibank holding 29.0% -- and Bank of America about 7% of the total of the four reporting banks, it's only JPMorgan and Citigroup that matter.
But the caveat to the above would be the precious metals derivatives position held by Wells Fargo and Morgan Stanley. The reason that their data is not included, is because they are not one of the USA's four largest banks by total derivatives held. But you can bet your entire net worth that they hold also hold a derivatives position in the precious metals that would choke a horse...Wells Fargo in particular.
This would indicate that these six U.S. banks held a derivatives position in the precious metals something north of $1 Trillion dollars at the end of Q3/2025 -- and is more than comfortably above that amount now.
But as I keep pointing out in this spot every weekend -- and mentioned just above...the OCC indicator is flawed for two very important reasons, as way back 10-15 years ago, this report used to include the top dozen or so U.S. banks -- and included the likes of Wells Fargo and Morgan Stanley, amongst others...that hold derivatives positions, both long and short, in the precious metals. Now the list is down to just four banks...so a lot of data is hidden... which is certainly the reason why the list was shortened. On top of that, the list doesn't include the non-U.S. banks that are short and long the precious metals: British, French, German, Canadian -- and Australian.
Including all theirs, the derivatives/paper held in the precious metals...mostly on the short side...is an eye-watering multi-trillion dollar number...which can never be covered, either in the paper market, or through the delivery of physical metal...without driving the prices of all four precious metals beyond the moon in the process.
The next OCC Report for Q4/2025 won't be due out until sometime around the end of March 2026.
![]()
The Commitment of Traders Report, for positions held at the close of COMEX trading on Tuesday, is very much yesterday's news in ever respect after what transpired on Friday.
In silver, the Commercial net short position fell by 2,333 COMEX contracts... 11.665 million troy ounces of the stuff. But most of that 'improvement' came about because Ted's raptors, the small commercial traders other than the Big 8, as they added to their long positions, which has the mathematical effect of reducing the commercial net short position, but isn't an improvement at all.
They arrived at that number through the purchase of 1,065 long contracts -- and also bought back/covered 1,268 short contracts. It's the sum of those two numbers that represents their change for the reporting week.
Under the hood in the Disaggregated COT Report, only the traders in the Other Reportables category were buyers, increasing their net long position by a smallish 736 COMEX contracts. The Managed Money and Nonreportable/small traders reduced their net long positions...the former by 2,247 contracts -- and the latter by 822 COMEX contracts.
Doing the math: 2,247 plus 822 minus 736 equals 2,333 COMEX contracts... the change in the Commercial net short position, which it must do.
The Commercial net short position in silver now stands at 44,056 COMEX contracts/220.280 million troy ounces...down those 2,333 contracts from what they were short in last week's report.
The Big 4 commercial shorts actually increased their short position by 426 contracts -- and are net short 40,255 COMEX contracts...201.275 million troy ounces.
The Big '5 through 8' shorts reduced their net short position by 1,395 contracts -- and are net short only 14,567 COMEX contracts. It's the third week in a row that they've reduced their net short position in silver -- and now hold their smallest short position in at least a couple of years. No doubt it's even less after Friday's bloodbath.
The Big 8 commercial traders are net short 54,822 COMEX silver contracts... down 969 contracts on the week...their smallest short position since back on 17 November 2023. One has to suspect that after Friday's price activity, they now hold their smallest short position in history.
Ted raptors, the 36 small commercial traders other than the Big 8, increased their net long position in silver by 1,364 contracts -- and are now net long silver by 10,766 COMEX contracts. They haven't been this net long silver for about two years.
Their buying of those 1,364 long contracts had the mathematical effect of reducing the Commercial net short position in silver by that amount...which isn't a decrease at all. The only thing that matters in silver is the short position of the Big 8 -- and their short position has been quietly shrinking for a while now...the lowest its been in over two years. One can only fantasize at what it's down to now after Friday's price action.
But we won't know that until next Friday.
Here's the 9-year COT chart for silver thanks to Nick Laird -- and updated with the above data. Click to enlarge.
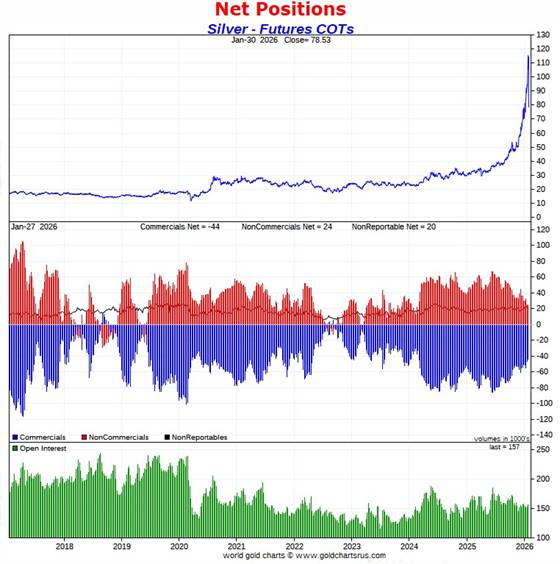
The Big 8 are net short 35.0 percent of total open interest in silver in the COMEX futures market...down from the 36.7 percent they were short in last week's report.
Since last October, while this bull market in silver has been unfolding, the Big 8 commercial traders have reduced their net short position from 64,483 contracts...down to 54,822 contracts -- and have shown little appetite for increasing it.
From a COMEX futures market perspective -- and taking into account what happened yesterday, the set-up for a big up move is now off-the-charts wildly bullish...helped along by the fact that the Managed Money traders are only net long 7,699 COMEX contracts...an historically small amount for them. No doubt they're net short silver now.
After Friday's premeditated and discontinuous event in the silver market, all we can do is wait until next Friday's COT Report to see what the lay of the land is then. But it will be historic...as this was most likely 'da boyz' last attempt to reduce their short positions as much as they could.
Also next Friday, we get the monthly Bank Participation Report -- and it will certainly show a vast improvement in the short positions of the world's banks in silver. But what will be of most interest, is how the U.S. banks fared...as they are ground zero of the silver price management scheme.
![]()
In gold, the commercial net short position imploded by an astonishing 41,404 COMEX contracts...4.140 million troy ounces of the stuff. I was totally blown away, as there was nothing in the price action during the reporting week that hinted at this sort of change. On the contrary -- and based on the price action, I was expecting a huge increase.
But the numbers are what they are. They arrived at that number through the purchase of 10,331 long contracts -- and they also bought back/covered an eye-watering 31,073 short contracts. It's the sum of those two numbers that represent their change for the reporting week.
Under the hood in the Disaggregated COT Report, all three categories were sellers for whatever reason. The Managed Money traders reduced their net long position by 19,285 COMEX contracts...the Other Reportables by 20,089 contracts -- and the Nonreportable/small traders by 2,030 contracts.
Doing the math: 19,285 plus 20,089 plus 2,030 equals 41,404 COMEX contracts...the change in the commercial net short position.
The Big 4 commercial traders reduced their net short position by 12,456 COMEX contracts, down to 153,865 contracts.
The Big '5 through 8' commercial traders reduced theirs by 18,380 contracts, down to 63,989 COMEX contracts held net short...the lowest they've been since last October.
Ted's raptors, the 44 small commercial traders other than the Big 8 also bought back/covered 10,568 short contracts. Their short position is down to 30,431 COMEX contracts...still monstrous, but the lowest its been since 21 October of last year.
The commercial net short position in gold, which includes the Big 8...plus Ted's raptors...are net short 44.6 percent of the the total open interest in gold in the COMEX futures market...down big from the 54.9 percent they were short last week...which remains a perversion. That big decline was helped mightily by the 39,541 contracts reduction in total open interest, which obviously affects the percentage calculation.
Here's Nick's 9-year COT chart for gold -- and updated with the above data. Click to enlarge.
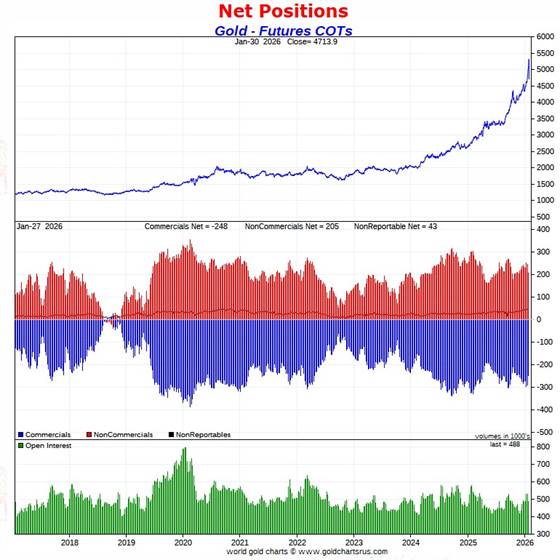
I'm still trying to come to terms with the shocking drop in the commercial net short position in gold, as the price action during the reporting week suggested the opposite. But then again, maybe the reason the price was rising was because the commercials were buyers. Then the question becomes, why would the non-commercial and small traders be willing to sell to them? A question with no answer -- and is another 'man bites dog' scenario.
Like in silver, these numbers are yesterday's news by many country miles -- and the best we can do is wait for next Friday's COT and companion Bank Participation Reports to see what they lay of the land is then.
But, also like in silver, it's a given that from a COMEX futures market perspective, the set-up in gold is now very much in the bullish camp.
![]()
In the other metals, the Managed Money traders in palladium increased their net short position by by a further 288 COMEX contracts -- and are net short by 543 contracts. But their current gross short position is 6,725 COMEX contracts -- and still the largest short position by far of any of the other categories...commercial traders included. Why this continues to be the case, I have no idea...but I'm sure they sold for monster profits yesterday.
The commercial traders in the Swap Dealers category are net long palladium by 639 contracts...down 16 contracts on the week. The traders in the Producer/Merchant category are net short 3,479 COMEX contracts...an increase of 62 contracts from last week. The traders in the Other Reportables and Nonreportable/ small trader categories remain net long palladium...but not by much.
As you can tell from these numbers, palladium is a pretty dinky market.
The world's banks are now net short 10.6 percent of total open interest in palladium in the COMEX futures market as of the January's Bank Participation Report that came out three weeks ago...which is an increase from the 4.5 percent that they were net short in December's Bank Participation Report.
This is a very strange and twisted market once you get a look into its internal structure...with platinum not that far behind.
In platinum, the Managed Money traders decreased their net long position by a further 3,070 COMEX contracts during the reporting week -- and are now net long platinum by only 2,428 contracts. The traders in the Other Reportables and Nonreportable/small trader category remain net long platinum by very respectable amounts...although their respective gross short positions are pretty hefty.
The commercial traders in the Producer/Merchant category in platinum are net short 13,734 COMEX contracts...a decrease of 741 contracts from what they were net short last week. The Swap Dealers in the commercial category increased their net short position, them by 985 contracts this past week -- and remain net short platinum by 8,292 COMEX contracts.
It's mostly the world's banks in the Producer/Merchant category that are 'The Big Shorts' in platinum in the COMEX futures market, as per January's Bank Participation Report that came out three weeks ago -- and mostly European banks. They and the U.S. banks increased their short positions by a bit in December, but not by a lot considering its price rise.
In copper, the Managed Money traders decreased their net long position by a further 4,788 COMEX contracts during the past reporting week -- but remain net long copper by 58,018 contracts...about 1.450 Billion pounds of the stuff. That's down from the 62,806 COMEX contracts/1.570 billion pounds of the stuff that they were net long last week.
Copper, like palladium, continues to be a wildly bifurcated market in the commercial category. The Producer/Merchant category is net short a grotesque 86,956 copper contracts/ 2.174 billion pounds -- while the Swap Dealers are net long 22,144 COMEX contracts/553 million pounds of the stuff.
Whether this dichotomy in copper means anything or not, will only be known in the fullness of time. Ted Butler said it didn't mean anything as far as he was concerned, as they're all commercial traders in the commercial category. But this bifurcation has been in place for as many years as I've been keeping records -- and that's a very long time.
In this vital industrial commodity, the world's banks...both U.S. and foreign... are now back to being net short copper by 1.1% of total open interest in the January Bank Participation Report. Back in the October BPR, these same banks were net long 0.9% of the total open interest in copper in the COMEX futures market. So basically they're market neutral...but only numerically, as that dichotomy between the two groups of commercial traders is still there.
At the moment it's all the commodity trading houses such as Glencore and Trafigura et al., along with some hedge funds, that are mega net short copper in the Producer/Merchant category, as the Swap Dealers are net long, as pointed out above.
But after Friday's massive bear raid, the above number don't mean much, either.
The next COT and Bank Participation Reports are due out next Friday, February 6.
![]()
Here’s Nick Laird’s “Days to Cover” chart, updated with the COT data for positions held at the close of COMEX trading on Tuesday, January 27. It shows the days of world production that it would take to cover the short positions of the Big 4 — and Big '5 through 8' traders in every physically traded commodity on the COMEX. Click to enlarge.
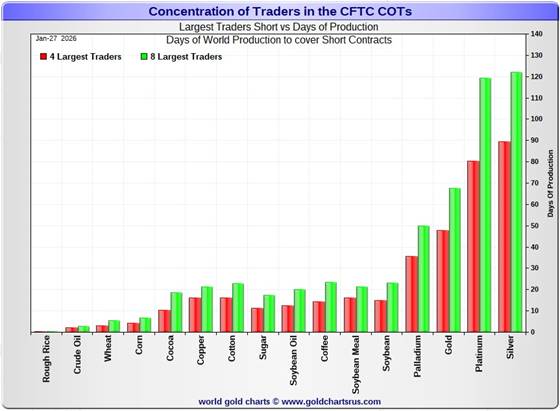
In this week's data, the Big 4 traders are short 90 days of world silver production...up 1 day from the prior COT report. The ‘5 through 8’ large traders are short an additional 32 days of world silver production... down 3 days from last week's report...for a total of 122 days that the Big 8 are short -- and obviously down 2 days from that last COT Report.
Those 122 days that the Big 8 traders are currently short, represents around 4.1 months of world silver production, or 274.110 million troy ounces/54,822 COMEX contracts. That's down from the 278.955 million troy ounces/55,791 contracts in last Friday's COT Report.
In gold, the Big 4 are short about 48 days of world gold production...down 4 days from the prior report -- and the Big '5 through 8' are short an additional 20 days of world production...down 5 days on the week, for a total of 68 days of world gold production held short by the Big 8 commercial traders -- and down 9 days from last Friday's COT Report. That's a lot!
The other standout of these Days-to-Cover charts, this one included, is the fact that the vast majority of the short positions in the four precious metals, plus other commodities, is held by the four largest traders...the red bars. Whereas the short positions held by the '5 through 8' large traders....the green bars, minus the red bars...is very small. That's how 'concentrated' these short positions are.
The short interest position in SLV now sits at 62.49 million shares/troy ounces as of the last short report that came out this past Tuesday, for positions held at the close of COMEX trading on Thursday, January 15 -- up 5.92 million shares/ troy ounces sold short from the prior report...an increase of 10.48%. This number, which represents 11.35% of total SLV shares outstanding, is off-the-charts grotesque and obscene -- and yet another way that 'da boyz' are keeping a lid on the silver price.
The next short report is due out on Monday, February 12...for positions held at the close of business on Friday, January 30/yesterday.
In the overall in yesterday's COT Report, the short positions of the Big 8 commercial traders in silver continues its quiet decline. But there was a surprising and totally unexpected drop in gold.
As Ted Butler had been pointing out ad nauseam, the resolution of the Big 4/8 short positions will be the sole determinant of precious metal prices going forward...although that short position in gold held by his raptors continues to be a negative factor as well.
But as he also pointed out over the years, there would come a time when what the numbers show in the COT Report won't matter, as events in the real world...whatever they may be...will overtake them -- and that time is upon us. All that we await now, is its resolution -- and that big bear raid yesterday, as painful as it was, was part of that.
![]()
CRITICAL READS & VIDEOS
U.S. Producer Prices Unexpectedly Surged in December
Following the cooler than expected Consumer Price Inflation, Producer Prices came in considerably hotter than expected at the headline level in December. PPI rose 0.5% MoM (vs. +0.2% MoM expected), lifting headline PPI to +3.0% YoY.
Services costs dominated the rise in the headline PPI (not Goods - which would be affected by tariffs).
Final demand services: The index for final demand services advanced 0.7 percent in December, the largest increase since moving up 0.9 percent in July.
Final demand goods: Prices for final demand goods were unchanged in December following a 0.8-percent increase in November. In December, a 0.4-percent advance in the index for final demand goods less foods and energy offset declines in prices for final demand energy and for final demand foods, which fell 1.4 percent and 0.3 percent, respectively.
Product detail: Within final demand goods in December, the index for nonferrous metals moved up 4.5 percent. Prices for residential natural gas, motor vehicles, soft drinks, and aircraft and aircraft equipment also increased.
In contrast, the index for diesel fuel dropped 14.6 percent. Prices for gasoline, jet fuel, beef and veal, and iron and steel scrap also decreased.
Interestingly, PPI Energy costs dipped (as did CPI), but remain notably elevated from six months ago, despite the price of energy actually being dramatically lower.
The problem for the incoming Fed Chair is though, as the chart shows, energy costs have started to rise rapidly since the last macro data.
This multi-chart Zero Hedge news story was posted on their Internet site at 8:45 a.m. on Friday morning EST -- and another link to it is here.
![]()
Kevin Warsh and Regime Change -- Doug Noland
I admired Kevin Warsh during his term as Federal Reserve governor (2006 to 2011). While young, he was more the traditional central banker operating within an experimental Bernanke Federal Reserve. He has been pilloried for his inflation focus in the months leading up to the 2008 crisis. The Fed aggressively slashed rates despite elevated inflation, an easing of financial conditions that spurred ongoing “terminal phase” Bubble excess and deepening systemic fragilities. Warsh’s inflation focus was justified.
Kevin Warsh has also been criticized for his cautious approach to QE. While working closely with Chair Bernanke to implement the Fed’s 2008 Wall Street bailout, he argued in September 2009 that the Fed should begin reversing extraordinary crisis-period liquidity injections. He pushed back in 2010 against Bernanke’s move to restart QE.
From Ben Bernanke’s “Courage to Act”: “Kevin Warsh had substantial reservations... He had supported the first round of securities purchases, begun in the midst of the crisis. Now that financial markets were functioning more normally, he believed that monetary policy was reaching its limits, that additional purchases could pose risks to inflation and financial stability…”
It would be a different world today had the Bernanke Federal Reserve not doubled the Fed’s balance sheet between November 2010 and November 2014. Financial, economic, social, and geopolitical stability would have been better served if the Yellen Fed had not held short-term interest rates below 1% through 2017 – still held below 2% a decade after the crisis. It is possible to imagine global central bankers not trapped by historic speculative leverage and Bubbles.
Kevin Warsh demonstrated sound judgment during an extraordinary period, pushing back against the Fed’s inflationist mindset. Like Powell, I believe he is a man of integrity. And as I pledged when Powell became Fed Chair, I will support Chair Warsh against future assertions of his responsibility for inevitable crisis dynamics and Bubble collapse.
That said, I am much more comfortable with the old Warsh’s analytical and policy framework than New Age Kev.
This longish, but interesting and worthwhile commentary from Doug appeared on his website around midnight last night PST -- and another link to it is here.
![]()
Poor Mr. Trump claims that the economy is doing better than ever. And if not, it’s Joe Biden’s fault. But recent polls show that twice as many voters hold him, rather than Biden, responsible.
Digging further into the figures, most people think his policies contribute to job losses...and have raised health insurance costs. And they’re right. Jobs continued to disappear from manufacturing as his tariff program was rolled out. The U.S. automobile industry, for example, lost 28,000 jobs last year. And tariffs were meant to close the trade gap; but the gap just opened wider than ever. Reuters:
Trade deficit widens by the most in nearly 34 years
"The Bureau of Economic Analysis and Census Bureau reported that the trade deficit widened by 94.6%, the largest increase since March 1992, to $56.8 billion..."
Consumer prices have continued to rise at least twice as fast as the Fed’s target. Food prices, for example, rose more in December than they had since 2022. Electricity rose 7% in 2025.
Poor Mr. Trump hopes he can overcome these problems with the old ‘bread and circuses’ technique. Distract the voters with circuses — Minneapolis, Greenland, Iran, et al. And bribe them with a barrage of giveaways before the mid-term elections — Trump Accounts, Warrior Dividends, Tariff Dividends, and a cap on credit card interest.
Stimmies for everyone! Perhaps he will take a page from fellow New Yorker, Zohran Mamdani’s winning playbook, with a nationwide rent control program ...and free childcare too!
This commentary from Bill showed up on his Internet site on Friday morning -- and I thank Roy Stephens for sending it along. Another link to it is here.
![]()
Two important and worthwhile video interviews
1. Can Iran Defeat Israel in a Regional War? -- Colonel Lawrence Wilkerson
This very informative video interview with the Colonel was hosted by Judge Andrew Napolitano on Thursday morning EST -- and is certainly worth your time if you have the interest. I thank Guido Tricot for sending it our way -- and the link to it is here.
2. INTEL Roundtable : w/Larry Johnson & Ray McGovern - Weekly Wrap 30-January
This 33-minute video interview with former CIA analysts McGovern and Johnson appeared on the youtube.com Internet site very late on Friday afternoon EST -- and it definitely worth watching if you have the interest. I thank Guido for this one as well -- and the link to it is here.
![]()
Warsh knows the score about gold price suppression. Will he share it?
Mainstream news organizations are hailing Warsh as someone who will defend "central bank independence," the euphemism for the Fed's subservience to the investment banking industry.
In any case, two things can be said about Warsh as a matter of indisputable fact, though they aren't likely to be acknowledged by mainstream news reports.
First is that Warsh knows all about U.S. gold price suppression policy. He volunteered his knowledge to GATA's lawyer, William J. Olson of Vienna, Virginia, in September 2009 during GATA's freedom-of-information litigation for access to the Fed's gold records.
Warsh wrote to Olsen that among the records the Fed was insisting on keeping secret from GATA were records of gold swap arrangements between the Fed and foreign banks...
Two years later in December 2011 Warsh wrote an essay in The Wall Street Journal about what he called "financial repression" by governments. Warsh wrote: "Policy makers are finding it tempting to pursue 'financial repression' -- suppressing market prices they don't like," adding, "Efforts to manage and manipulate asset prices are not new"...
Soon after Warsh's essay was published your secretary/treasurer reached him by e-mail at Stanford University in California and asked him if he had learned about "financial repression" through his service at the Fed. Your secretary /treasurer also asked him if he would specify the asset prices being manipulated by policy makers.
Warsh cordially wished your secretary/treasurer a nice day.
So Warsh knows the score about gold price suppression and market rigging by government generally. Will he ever risk sharing it with the public as a matter of democratic accountability? And how long will he be in office as Fed chairman before Trump starts denouncing him as stupid and worse for not following presidential preferences, the fate that has befallen the president's previous appointee as Fed chairman?
This interesting commentary from GATA's secretary treasurer Chris Powell includes several worthwhile links -- and was posted on the gata.org Internet site yesterday morning EST. Another link to it is here.
![]()
China halts trading in 5 silver and oil funds amid volatility
China suspended trading of five commodity funds on Friday to curb investment mania in gold, silver and oil and reduce underlying risks amid geopolitical tensions.
The only public fund investing in silver futures in mainland China, UBS SDIC Silver Futures Fund, a listed open-ended fund (LOF), will be suspended for the whole day on Friday, the second such halt since January 22.
The trading halt also spread to oil LOFs, four of which were halted for an hour up to 10.30am on Friday. Before the halts, fund-management firms had issued multiple alerts about high premium risks.
The actions came as global investors continued to flock to safe-haven assets amid escalating U.S. conflicts with Europe, South America and the Middle East.
The prices of gold and silver broke records multiple times this month, nearing new all-time highs of US$5,600 and US$122 per ounce, respectively, on Thursday in New York. Gold and silver have surged more than 22 per cent and 58 per cent, respectively, in the past 30 days.
Brent oil also exceeded US$70 per barrel for the first time in about five months on Thursday as US warships headed closer to Iran. The fuel benchmark edged down to US$69.70 on Friday in Hong Kong.
“The expanded trade tensions intensify the price volatility of commodities, reflecting weakening confidence in US dominance and the greenback, and tightened control over strategic resources,” said Xu Tianchen, senior economist at the Economist Intelligence Unit. “China’s trading halt and alerts aim to maintain the stability of the capital markets, preventing investors from suffering huge losses.”
The above paragraphs are all there is to this story from the South China Morning Post on Thursday -- and I thank Swedish reader Patrik Ekdahl for pointing it out. Another link to the hard copy is here.
QUOTE of the DAY
The WRAP
"Understand this. Things are now in motion that cannot be undone." -- Gandalf the White
![]()
Today's pop 'blast from the past' was one I heard on the local radio station when I was at a restaurant earlier this week. I've featured it a few times over the last ten or so years, but it's a classic -- and I never tire of it -- and I hope you don't. It was the opening track on their 1972 debut album Can't Buy a Thrill. It was released as a single late that same year -- and reached No. 6 on the U.S. charts in 1973. The opening riff should be instantly recognizable -- and the link to the extended album version of the tune is here. Of course there's a bass cover to this -- and that's linked here.
Today's classical blast from the past is one that I've only posted only once before -- and it's time for a revisit. It's Antonín Dvořák's Symphony No. 9 in E minor, Op. 95, B. 178, popularly known as the New World Symphony, which he composed in 1893 while he was the director of the National Conservatory of Music of America from 1892 to 1895. It is by far his most popular symphony, and one of the most popular of all symphonies.
Here's Slovenia's Gimnazija Kranj Symphony Orchestra under the baton of Maestro Nejc Bečan -- and the link is here.
![]()
What we were witness to yesterday was as a brazen in-your-face criminal act by the collusive commercial traders of whatever stripe...as they all acted in unison, lock-step -- and totally premeditated.
And the reason it was 'da boyz' is for the simple reason, as Ted Butler explained every time we had these across-the-board engineered price declines, was because the thousands of traders in the non-commercial and small trader categories didn't have a Zoom call after the markets closed on Thursday to plot how they could collectively lose many billions of dollars on Friday.
Nor did they collude on setting their respective low ticks at 1:39 p.m. EST...which were the exact engineered low ticks in all four precious metals...to the second.
Terry Duffy, the head of the CME Group, should be in jail for this. That's for the simple reason that as this 'X' post from Chris Martenson pointed out yesterday -- and that Mark Hagen sent our way..."FYI the CME is violating its own "rules". There are supposed to be "circuit breakers" with the first tripped at 10%. Here we are WAAaaaAy past that moment, and the CME is 'letting it rip.' Which they wouldn't do if things were going the other way, of course." The link to it is here.
Then there was this 'X' post from 'Serenity' that reader Mike Coombs sent my way -- and I'm not qualified to comment on it...but the writer appears to know what he's talking about. It's title is 'Here's why Silver/$SLV crashed today' -- and linked here. Of course the writer didn't say a word as to why all four precious metals 'crashed' simultaneously.
But 'da boyz' had it all set up for other reasons besides those, because as I've been pointing out for a long while now, most of the four precious metals were hugely in overbought territory...plus it was Friday -- and the last day of the month. And as an added bonus, they ran the dollar index shorts starting at the noon silver fix in London. The stage was set.
Anybody long and on margin in anything precious metals-related on Friday, got totally blown out of their positions, as few if any traders could afford to hold onto them.
From being overbought, all four precious metals are back at or below market neutral on their respective RSI traces. At their intraday lows, both platinum and palladium traded below their respective 50-day moving averages -- and in the case of the latter...a long way below it.
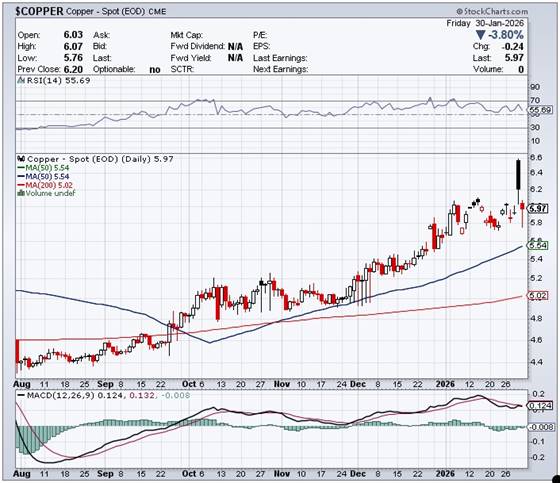
Copper's monster gain on Thursday vanished in a puff of COMEX paper smoke on Friday, as it was closed down 24 cents yesterday -- and back below six bucks, at $5.97/pound. It traded as low as $5.76 intraday.
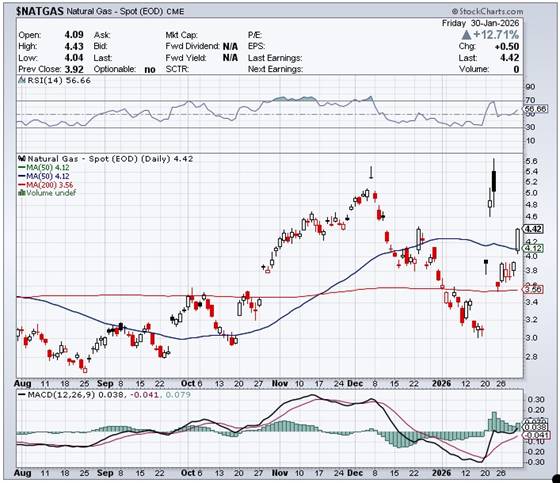
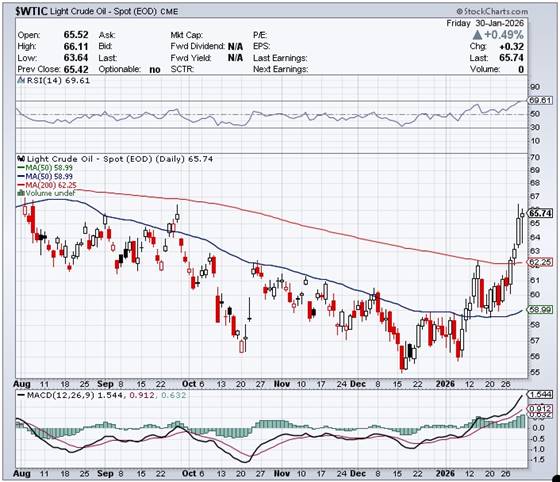
Natural gas [chart included] closed up a hefty 50 cents/12.71% at $4.42/ 1,000 cubic feet -- and is now back above its 50-day moving average by thirty cents. WTIC tacked on a further gain of 32 cents -- and finished the Friday trading session at $65.74/barrel.
Here are the 6-month charts for the Big 6+1 commodities as of the COMEX close yesterday...thanks to stockcharts.com as always. The silver chart is back to normal again. Click to enlarge.
So...was that 'one and done'...or is there more to go?
A good question, with some thoughts on this below.
However, if I had to bet the proverbial ten bucks, I'd say that if you were looking for an entry point on a dip...it was handed to you on a silver platter yesterday. The only reason I wasn't a buyer on Friday was because my website was down for about nine hours -- along with an in-box full of e-mails the likes I've never seen...so I had my hands full.
I suppose there may be some follow through, as 'da boyz'...along with other members of the Plunge Protection Team...continue to run the dollar shorts in order to get more Managed Money traders to sell longs and go further short.
That process may have been been helped along a bit more by the fact that the CME Group added insult to injury yesterday. In an e-mail that I received from Nick Laird, he advised me that..."they raised gold bond margins from 6% to 8% -- and silver bond margins from 11% to 15%". Normally they increase them on sharply rising prices...not on sharply falling ones. Anything to help their largest and most important customers...the Big 8 commercial shorts. The CME and CFTC are up to their necks in this price management scheme.
But -- and it's a big but...it must be pointed out that in order to get any more major long and short selling by the Managed Money traders, et al...it would take lower prices than the intraday lows that were set in all four precious metals yesterday, to accomplish that. My bet is that they can't -- and won't. If they had more big pain in mind, they would have closed them all at or very close to their absolute low ticks...rather than let them rally well off them.
One thing is for sure -- and that is that next week's Commitment of Traders and companion Bank Participation Reports will show massive improvements in the commercial net short positions of the Big 8 traders in both silver and gold -- and by the small commercial traders in gold...Ted Butler's raptors.
As I mentioned further up in my COT discussion, I'll be most interested in what the 5 U.S. banks have managed to accomplish in January when the February Bank Participation Report comes out next Friday...for positions held at the close of COMEX trading on Tuesday, February 3. On Tuesday, January 6, they were net long silver by 1,047 COMEX contracts...but their gross short position was still 15,099 contracts -- and it's this latter number that I'm hoping to see a big drop in. We'll know in a week.
There were major key reversals to the downside in all four precious metals yesterday, so from a technical point of view, a lot of damage was done...but the 50-day moving averages in both silver and gold weren't violated...even intraday, so we'll see what next week brings.
And to make matters more interesting -- and as I mentioned further up, the silver premium in Shanghai on Friday over the U.S. price was at new record high...17.54%.
But nobody in the precious metals space, from the smallest investor...up to and including the executives of very precious metals miner in the world...were at all fooled by what went down yesterday, as they [and we] have seen this movie countless times over the last decade or so. It was another attempt at a 'wash, rinse & spin' cycle by 'da boyz' -- and all that remains to be seen is how quickly this one reverses itself.
Demand, particularly in silver, remains "rapacious" -- and the drumbeat of its looming supply/demand deficit grows ever more deafening as time passes.
I'm done for the day -- and the week. I'm still "all in" -- and will be more "all in" before the trading day ends on Monday.
See you on Tuesday.
Ed
About the author

SUBSCRIBE: https://edsteergoldsilver.com/

Ed Steer’s Daily Analysis of the Gold and Silver Markets
After eight years of writing about the precious metals for Casey Research, the folks at Stansberry & Associates—who just recently purchased controlling interest in the company—decided that my ‘niche market’ column didn’t fit into their plans.
Since the time that Casey Research was kind enough to offer me a stand-alone column, it became their most highly-rated blog almost from the outset—and has remained that way up to this date...