Previously, I have shown how the Dow has actually outperformed silver and gold since the creation of the Federal Reserve in 1913. Here is how that looks on a chart (from longtermtrends.net):
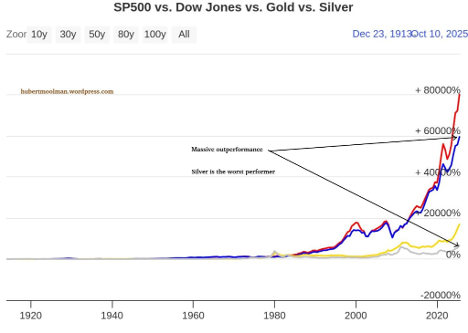
The S&P 500 is in red, the Dow in blue, and gold and silver in their native colours. The stock market has significantly outperformed precious metals, with silver being the worst performer.
Today, if silver had the same kind of performance as the Dow since around the creation of the Federal Reserve in 1913, then it would have topped out at $358.38 [(47049/78.78)*.6]. Yet, it only topped out around $50 in 1980 and 2011 and has recently surpassed that all-time high.
In October 1973 (is this a coincidence?), silver was in a similar type of position when it finally surpassed its all-time high (set in 1864). The Dow had peaked at 1067.2 (in Jan 1973), which represented a X13.55 (1067.2/78.78) since 1913. If silver had scored a similar performance, it would have had a peak of $8.128, yet it only reached the 1864 peak of $2.94 at that time.
This is how silver measured against the Dow, S&P 500, and silver at that time (October 1973):
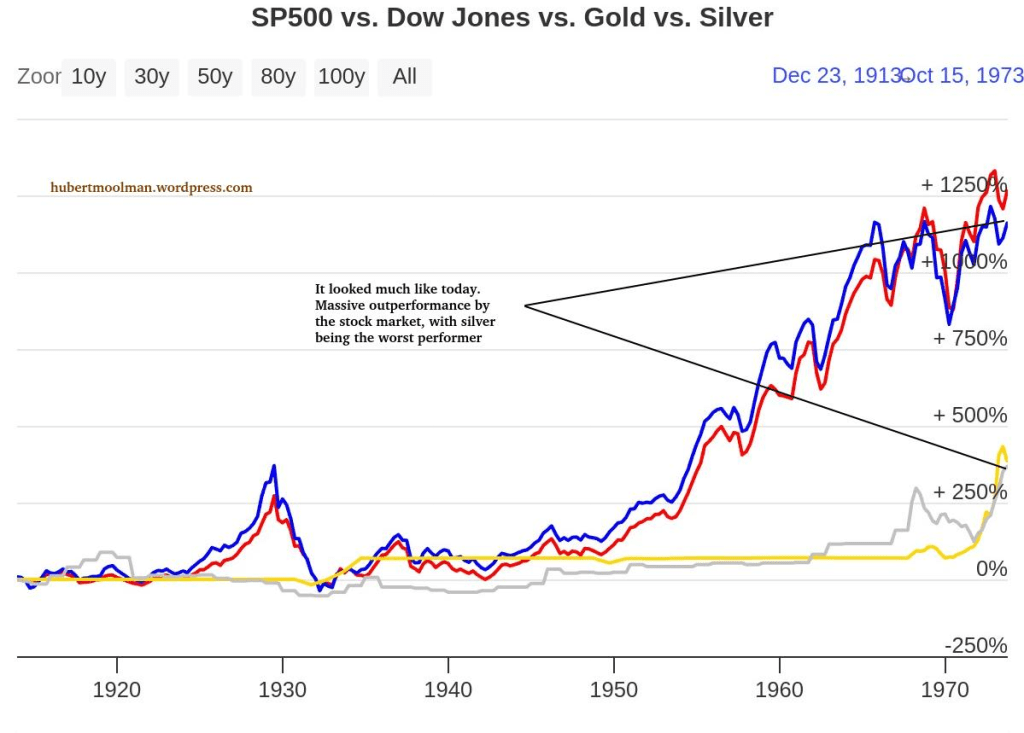
So, much like today, the stock market had significantly outperformed precious metals, with silver being the worst performer.
However, this is how it looked about 5 months later when silver more than doubled in value (charts generated at longtermtrends.net):
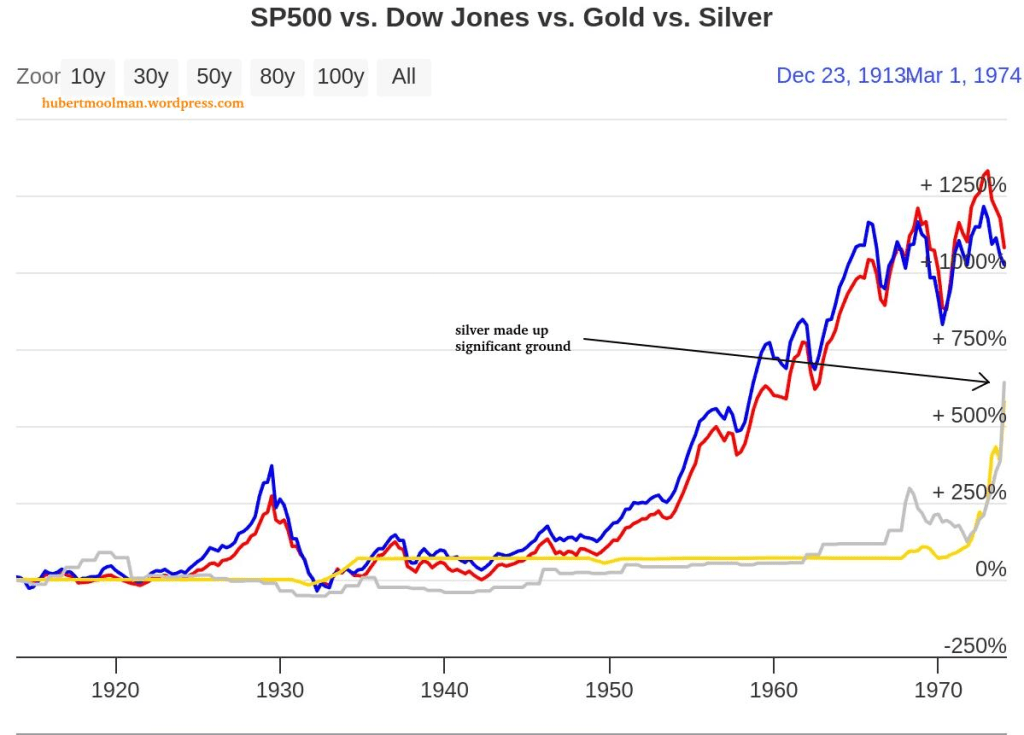
Silver made up significant ground and surpassed gold during that time. There is a high probability that silver will perform in a similar manner and even better over the coming months.
Of course, silver eventually surpassed both the Dow and S&P 500 before the end of that bull market. It also eventually topped the Dow’s performance as of October 1973. A similar feat would mean silver surpassing the $358 level in this bull market.
A possible path to the $358 is shown on one of the many charts that I track on my silver and gold premium blog:
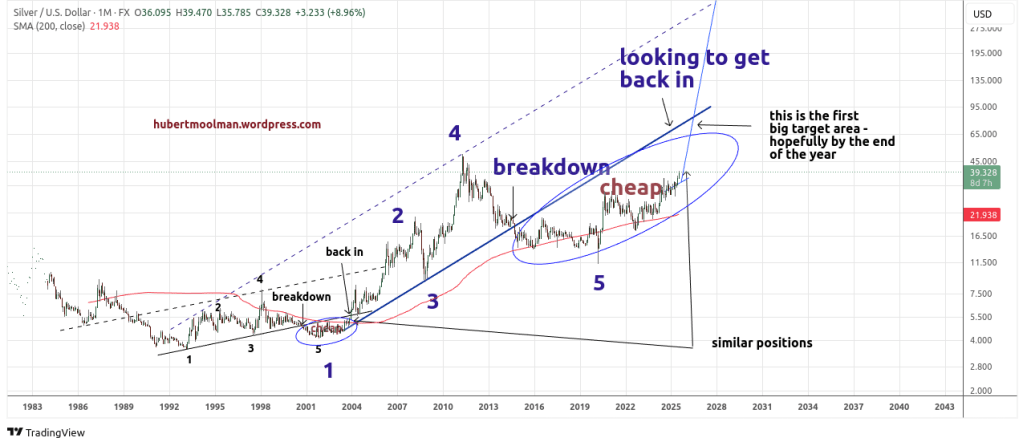
More information on the chart can be found here.
Warm regards
Hubert Moolman