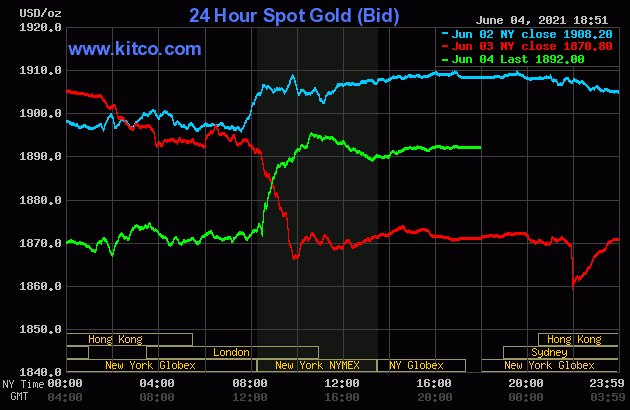
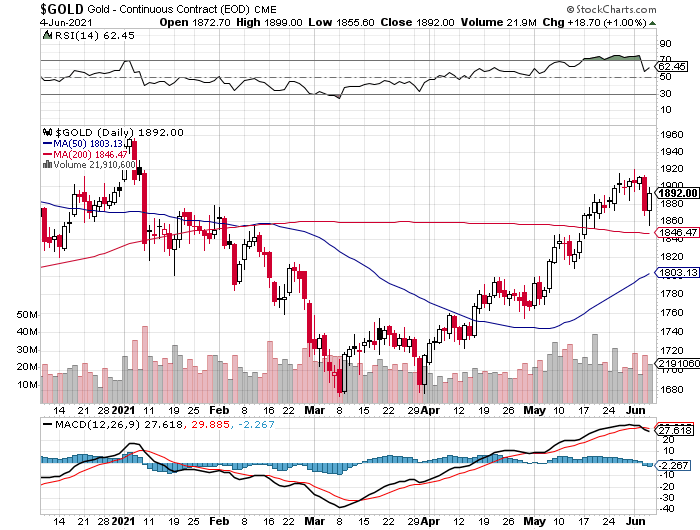
The gold price traded flat in Far East trading on their Friday morning until a few minutes before 10 a.m. China Standard Time on their Friday morning. The bids got pulled at that point -- and the price cratered by a bit over ten bucks in just a few seconds. It rallied from there until shortly before noon CST -- and then didn't do much of anything until the job numbers hit the tape at 8:30 a.m. in New York. Gold rallied sharply at that juncture, but ran into 'something' at exactly 10:30 a.m. EST, minutes before it was about to blow through $1,900 spot. It was then sold very quietly and evenly lower until fifteen minutes before the COMEX close -- and it then crept a few dollars higher for the next few hours, before trading flat until trading ended at 5:00 p.m. EDT.
The low and high ticks in gold, both of which occurred within two hours of each other in COMEX trading, were recorded by the CME Group as $1,855.60 and $1,899.00 in the August contract. The August/October price spread differential in gold at the close yesterday was only $1.80...October/December was $2.00 -- and December/February was $1.90 an ounce.
Gold was closed on Friday afternoon in New York at $1,892.00 spot, up $21.20 from Thursday. Net HFT gold volume was on the heavier side at a bit over 219,000 contracts -- and there was a bit over 10,500 contracts worth of roll-over/switch volume out of August and into future months...mostly October and December.
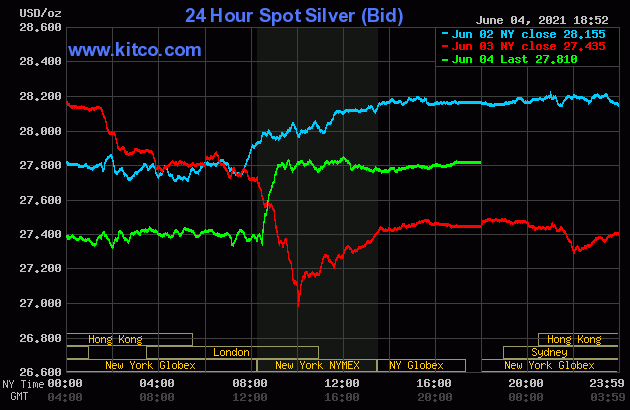
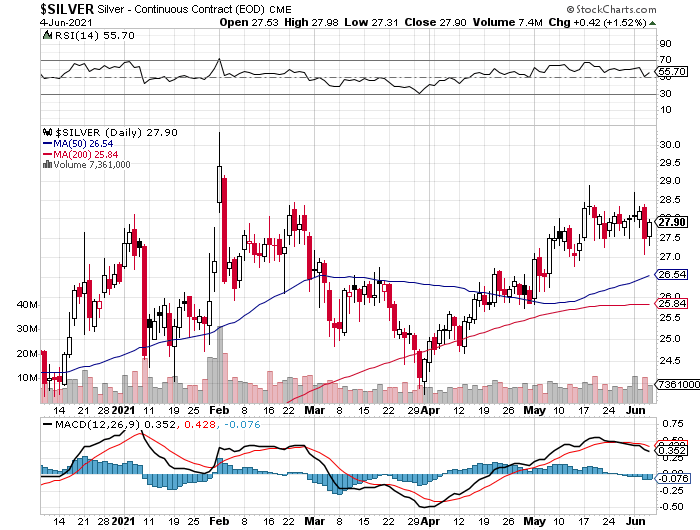
Like gold, silver's low tick was set at 10 a.m. in Shanghai on their Friday morning -- and its price path was the same after that. But once the price blasted higher at 8:30 a.m. in New York, the Big 4/8 shorts didn't waste any time capping its price about forty minutes later as it was about to blow through $28 spot -- and over an before they stuck a fork in the gold price. From that point onwards it traded flat until the market closed at 5:00 p.m. EDT.
The low and high ticks in silver were reported as $27.31 and $27.98 in the July contract. The July/September price spread differential in silver at the close yesterday was 3.0 cents...September/December was 4.3 cents -- and December/March was 4.6 cents.
Silver was closed in New York on Friday afternoon at $27.81 spot, up 37.5 cents from its close on Thursday. Net volume was a bit on the heavier side at a hair under 70,500 contracts -- and there was just about 7,500 contracts worth of roll-over/switch volume out of July and into future months...mostly September, with a bit into December.
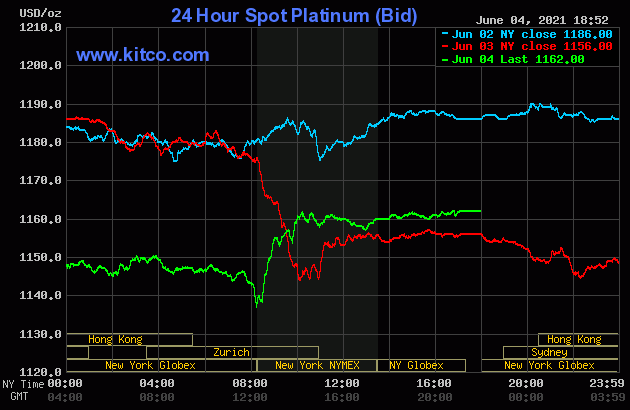
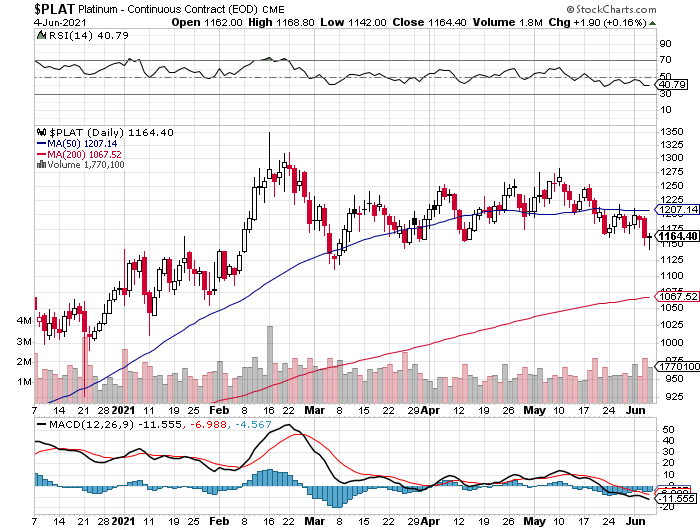
Platinum's Far East low came around 10:15 a.m. China Standard Time on their Friday morning -- and from there it edged a bit higher until around 10 a.m. in Zurich. It was quietly down hill from there, with the low tick of the day coming at the 8:40 a.m. COMEX open -- and it also rallied sharply at 8:30 a.m. EDT. That rally was capped and turned sideways about ten minutes after the 10 a.m. EDT afternoon gold fix in London -- and it then had quiet down/up move until trading ended at 5:00 p.m. EDT. Platinum was closed at $1,162 spot, up 6 dollars on the day.
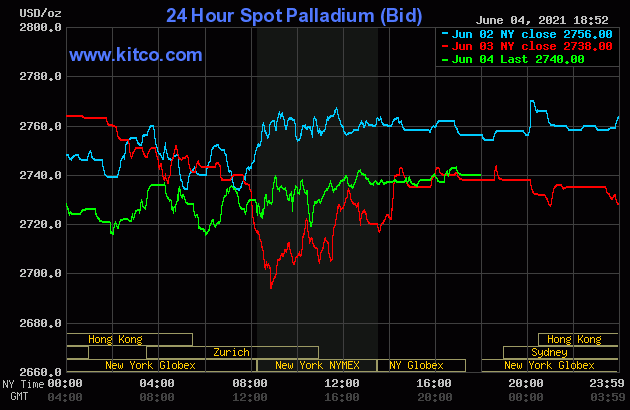
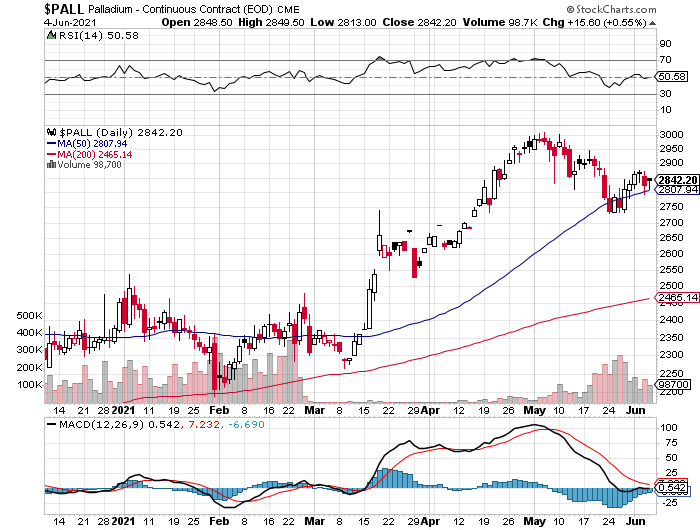
The palladium priced didn't do much on Friday...as it was sold quietly and unevenly lower until 10 a.m. in Zurich -- and it then wandered/chopped higher until shortly before 1 p.m. in New York -- and didn't do much after that. Palladium finished the Friday session at $2,740 spot, up 2 bucks from Thursday.
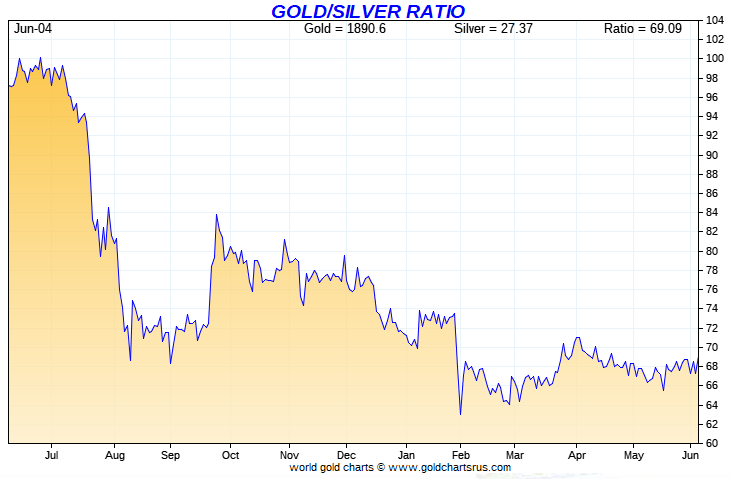
Based on the kitco.com-recorded spot closing prices in silver and gold posted above, the gold/silver ratio worked out to 68.0 to 1 on Friday...compared to 68.2 to 1 on Thursday.
And here's the 1-year Gold/Silver Ratio chart from Nick Laird -- and updated with this past week's data. Click to enlarge.
![]()
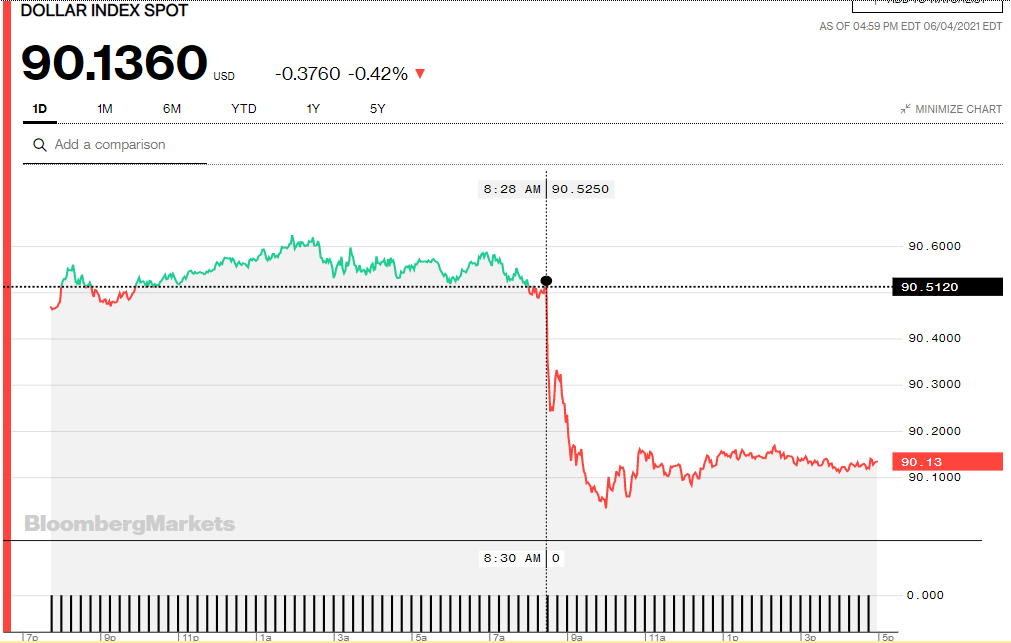
The dollar index closed very late on Thursday afternoon in New York at 90.512 -- and opened down about 4.5 basis points once trading commenced around 7:45 p.m. EDT on Thursday evening, which was 7:45 a.m. China Standard Time on their Friday morning. It began to crawl a bit unsteadily higher from that point -- and that lasted until a few minutes before 2:30 p.m. CST. It began to wander very quietly lower from there until it cratered a few minutes before 8:30 a.m. in New York...even before the job numbers hit the tape. The 90.03 low tick was set at the 10 a.m. EDT afternoon gold fix in London -- and after ticking a bit higher until around 10:50 a.m. EDT, it didn't do anything after that.
The dollar index finished the Friday session in New York at 90.136...down about 38 basis points from its close on Thursday.
Here's the DXY chart for Friday, thanks to Bloomberg as always. Click to enlarge.
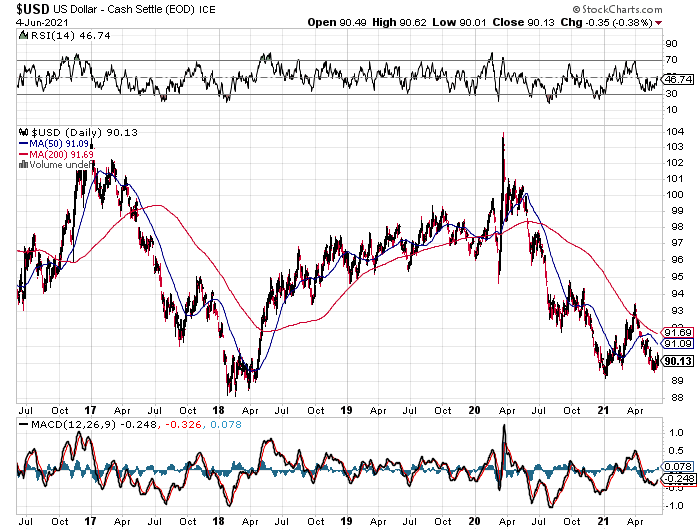
And here's the 5-year U.S. dollar index chart that appears in every Saturday column in this spot, courtesy of the good folks over at the stockcharts.com Internet site. The delta between its close...90.13...and the close on the DXY chart above, was less than 1 basis points below its spot close on Friday. Click to enlarge as well.
The Big 4/8 traders obviously stepped on the rallies in three of the four precious metals. If they hadn't, both silver and gold would have closed well above $28 and $1,900 spot -- and it was clear that they didn't want that to happen.
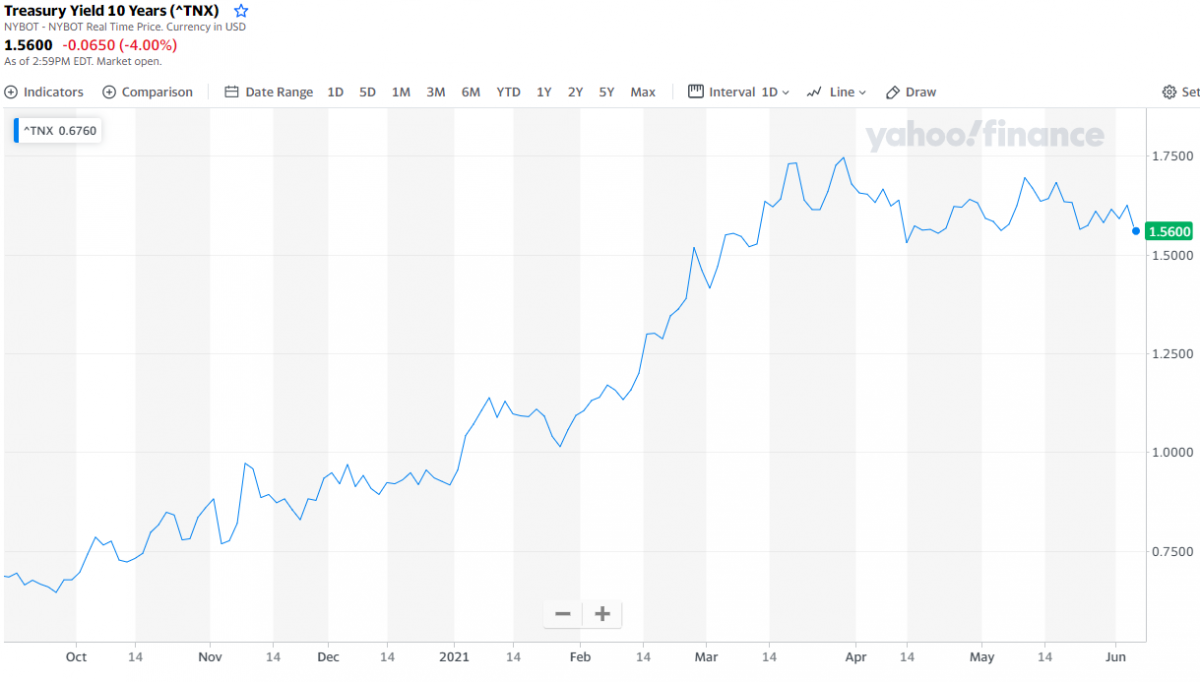
U.S. 10-Year Treasury: 1.5600%...down 0.0650 (-4.00%)...as of 2:59 p.m. EDT.
Here's the one-year 10-year U.S. Treasury chart, courtesy of finance.yahoo.com -- and as I keep pointing out, you can see where the Fed began yield curve control in March. Click to enlarge.
![]()
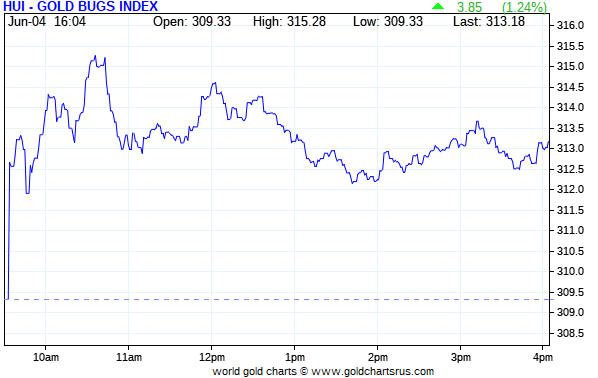
The gold shares gapped up a bit at the open -- and then continued to rally until their respective high ticks were set around 10:35 a.m. in New York trading. They were then sold quietly lower until shortly after the 1:30 p.m. COMEX close -- and then wandered a tad higher until trading ended at 4:00 p.m. EDT. The HUI closed up only 1.24 percent.
It was mostly the same for the silver equities, although it certainly looked like 'someone' was actively selling into the early morning rally to stunt its progress. Their highs of the day came around 10:45 a.m. EDT -- and it was generally down hill from there until minutes before 2 p.m. The wandered quietly sideways after that until the market closed at 4:00 p.m. in New York. Nick Laird's Intraday Silver Sentiment/Silver 7 Index closed higher by only 0.66 percent -- and I was totally underwhelmed. Click to enlarge if necessary.
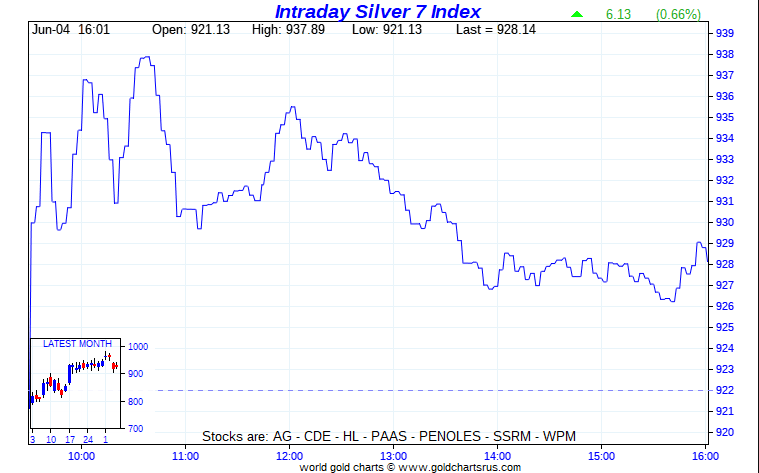
Computed manually, the above index closed higher by 0.75 percent.
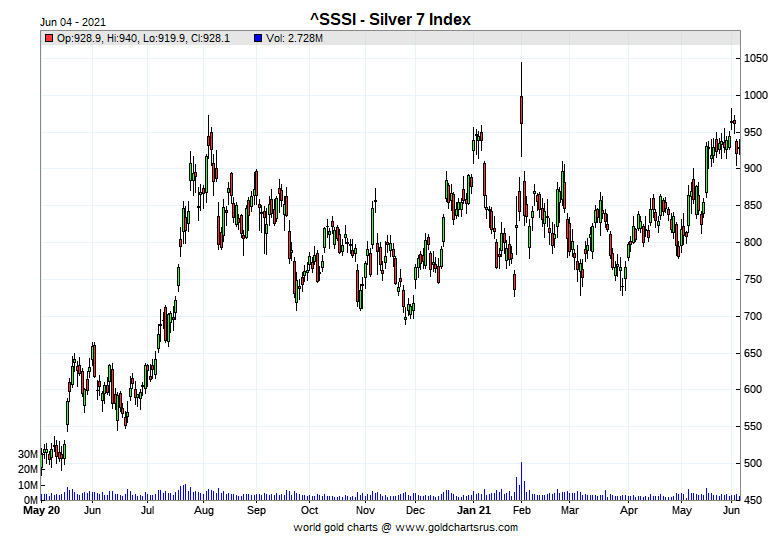
And here's Nick's 1-year Silver Sentiment/Silver 7 Index chart, updated with Friday's candle. Click to enlarge as well.
The star was Wheaton Precious Metals, closing higher by 2.22 percent -- and the dog was Peñoles, as it closed down 1.24 percent on the day.
I certainly wasn't impressed with the precious metal share price action yesterday -- and if you look at the HUI and Silver 7 Index charts above, it looks like there was deliberate selling going on into their rallies in early morning trading in New York. But on sober second thought, it could have been margin call selling following Thursday's engineered price declines...or maybe mutual fund/hedge fund redemptions.
![]()
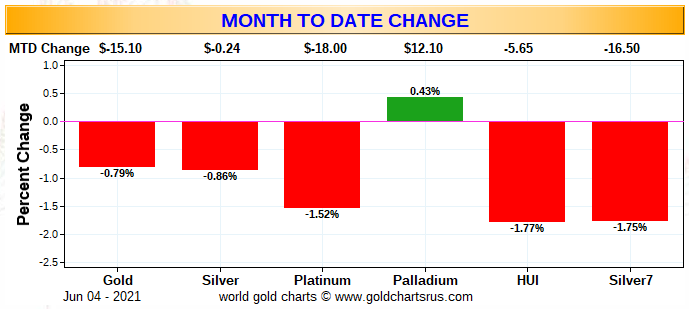
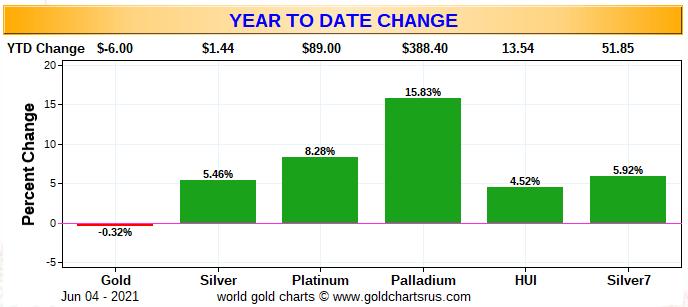
Here are two of the three charts that shows up in every Saturday missive. They show the changes in gold, silver, platinum and palladium in both percent and dollar and cents terms, as of their Friday closes in New York — along with the changes in the HUI and the Silver 7 Index.
Here's the month-to-date chart for June, which doubles as the weekly chart for this week only. The beating that the Big 4/8 traders laid on the precious metals on Thursday resulted in everything being in the red across the board, except for palladium obviously. Click to enlarge.
And here's the year-to-date chart -- and it's still green across the board, which is a sight for sore eyes. The only reason that the gold stocks appear to outperform their underlying precious metal is because of the big relative gains they tacked on during the last week in May. Click to enlarge.
And as Ted Butler has pointed out on many occasions, the short positions of the Big 8 traders in general -- and the Big 4 short commercial traders in particular, are the sole reason that precious metal prices aren't at the moon already, as virtually every other group of traders in the COMEX futures market are net long against them in all four precious metals...including almost all the rest of the traders in their respective commercial categories.
In the COT discussion further down, the commercial traders decreased their short position in both silver and gold during the reporting week by a bit -- and the Big 4/8 traders improved their short position in both as well, but it wasn't by material amounts.
The CME Daily Delivery Report showed that 631 gold and zero silver contracts were posted for delivery within the COMEX-approved depositories on Tuesday.
In gold, there were four short/issuers in total -- and the only two that mattered were JPMorgan and ED&F Man Capital, issuing 557 and 56 contracts out of their respective client accounts. There was another huge list of long/stoppers lead by Goldman Sachs, as they picked up 176 contracts for their house account -- and in second place was JPMorgan, stopping 120 contracts for their client account. Deutsche Bank was in distant third spot, picking up 75 contracts for their own account -- and the list goes on and on...
In palladium, there was 1 more contract issued and stopped.
The link to yesterday's Issuers and Stoppers Report is here.
So far this month there have been 20,487 gold contracts issued/reissued and stopped -- and that number in silver is 2,442 contracts. In palladium, there have been 137 contracts issued and stopped -- and nothing in platinum.
The CME Preliminary Report for the Friday trading session showed that gold open interest in June fell by 1,308 contracts, leaving 2,318 still around, minus the 631 contracts mentioned a few paragraphs ago. Thursday's Daily Delivery Report showed that 1,330 gold contracts were actually posted for delivery on Monday, so that means that 1,330-1,308=22 more gold contracts just got added to the June delivery month. Silver o.i. in June declined by 18 contracts leaving 125 still open. Thursday's Daily Delivery Report showed that 18 silver contracts were actually posted for delivery on Monday, so the change in open interest and deliveries match for once.
Total gold open interest at the close yesterday rose by 203 COMEX contracts -- and total silver o.i. rose by 3,695 contracts.
There was a deposit into GLD yesterday, as an authorized participant added 45,162 troy ounces -- and there were no reported changes in SLV.
In other gold and silver ETFs and mutual funds on Planet Earth on Friday, net of any changes in COMEX, GLD & SLV inventories, there was a net 110,938 troy ounces of gold removed...mainly because of a withdrawal of 101,260 troy ounces from Deutsche Bank. There was a net 551,906 troy ounces of silver added, of which 401,745 troy ounces ended up in Sprott's PSLV...the rest went into Deutsche Bank.
Once again there was no sales report from the U.S. Mint.
Month-to-date, which is only four business days old, the mint has sold zero gold eagles or buffaloes -- and zero silver eagles as well.
It's been almost two months since any silver eagles have been reported sold by the mint -- and nearly a month for any gold eagles or buffaloes. So it should be plain for all to see that the mint does not wish to exacerbate the critical shortage in either silver or gold good delivery bars. I know for a fact that Ted will have something to say about this situation in his weekly review this afternoon.
There was some activity in gold over at the COMEX-approved depositories on the U.S. east coast on Thursday. There was 64,173.400 troy ounces/1,996 kilobars [SGE kilobar weight] received and, for the second day in a row, all of it ended up at Brink's, Inc. Nothing was shipped out.
There was also a bit of paper activity -- and all of it involved transfers from the Registered category and back into Eligible...43,725.540 troy ounces/1,360 kilobars [SGE kilobar weight] at Brink's, Inc. -- and the remaining 699 troy ounces over at Manfra, Tordella & Brookes, Inc. The link to all of Thursday's gold activity is here.
There was pretty big activity in silver, as 1,759,257 troy ounces was received -- and 319,212 troy ounces was shipped out.
In the 'in' category, there were two truckloads...1,186,078 troy ounces received at Manfra, Tordella & Brookes, Inc. -- and the remaining truckload...573,178 troy ounces...was dropped off at HSBC USA.
In the 'out' category, there were five different depositories involved -- and the largest amount by far was the 202,234 troy ounces that departed Brink's, Inc. There was no paper activity. The link to the above silver activity, plus a bit more, is here.
There was more decent activity over at the COMEX-approved gold kilobar depositories in Hong Kong on their Thursday. They reported receiving 1,570 of them -- and shipped out 596. And except for the 396 kilobars that departed Loomis International, the remaining in/out activity took place over at Brink's, Inc. The link to that, in troy ounces, is here.
![]()
Here are the usual two 20-year charts that show up in this space almost every Saturday. They show the total amount of physical gold and silver in all know depositories, ETFs and mutual funds as of the close of business on Friday.
For the week just past, there was a net 197,000 troy ounces of gold added -- and in silver, there was a net 6,117,000 million troy ounces added. Click to enlarge for both.
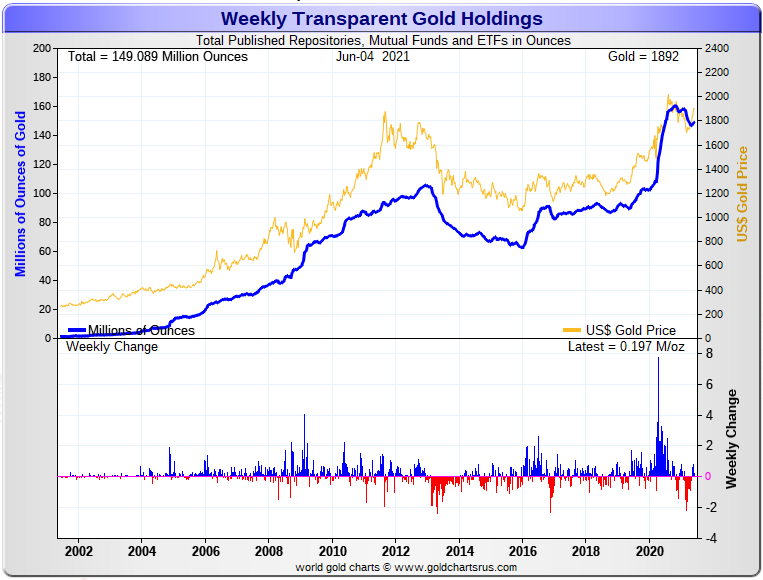
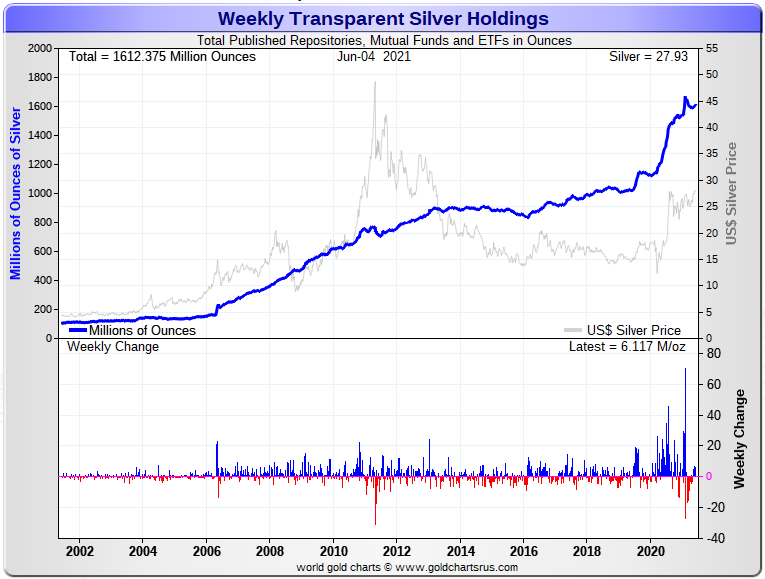
We've now had five weeks in a row of increases in the world's gold and silver ETFs -- and that trend should continue and grow stronger as time goes along. The long bear market that started last August is over, despite the efforts of the Big 4/8 shorts.
![]()
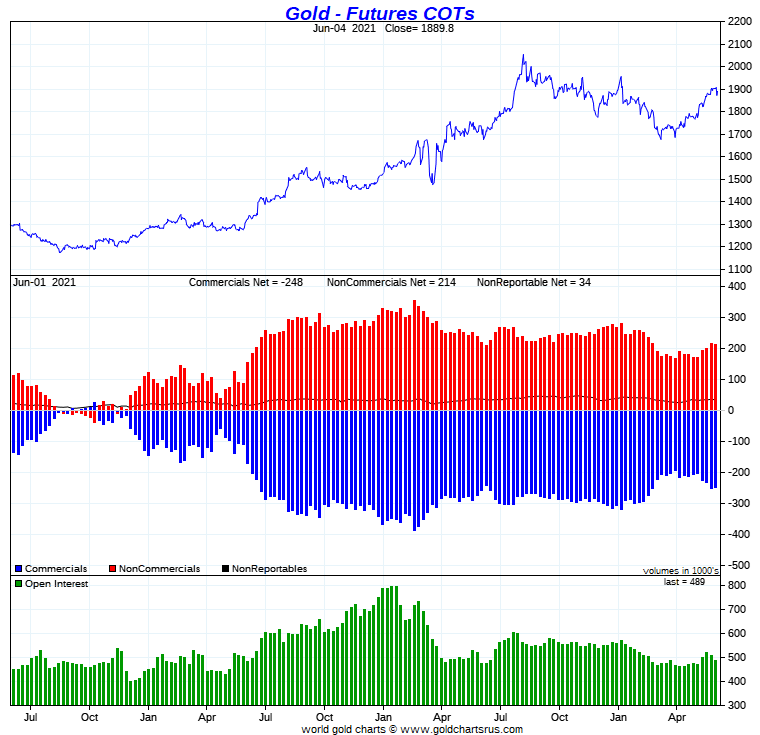
The Commitment of Traders Report, for positions held at the close of COMEX trading on Tuesday, showed the expected small changes in both gold and silver -- and both showed slight decreases in their commercial net short positions.
In silver, the Commercial net short position declined by 792 COMEX contracts, which works out to about 4.0 million troy ounces.
They arrived at that number by increasing their long position by 813 contracts -- and also increased their short position by 21 contracts. It's the difference between those two numbers that represents their change for the reporting week.
Under the hood in the Disaggregated COT Report, it was a real mixed bag, as the Managed Money traders reduced their net long position by a hefty 2,987 contracts, while the Other Reportables did almost nothing, increasing their net long position by a paltry 22 contracts. It was the traders in the Nonreportable/small trader category that were the big buyers during the reporting week, increasing their net long position by 2,173 COMEX contracts.
Doing the math: 2,987 minus 22 minus 2,173 equals 792 COMEX contracts, the change in the Commercial net short position.
The Commercial net short position in silver now stands at 357.4 million troy ounces, compared to 361.4 million troy ounces in last week's COT Report -- and obviously down 4 million troy ounces week-over-week.
The Big 8 traders are short 392.0 million troy ounces of silver in this week's COT Report, compared to 397.8 million troy ounces in last week's report...a drop of 5.8 million troy ounces. So despite the small change in the headline number [792 contracts] the Big 4 in particular according to Ted, were very active in covering short positions during the past reporting week.
The short position of the Big 8 traders is larger than the Commercial net short position by about 110 percent, unchanged from last week's COT Report.
Here's the 3-year COT chart for silver, courtesy of Nick Laird, as always -- and the weekly change, is barely noticeable. Click to enlarge.
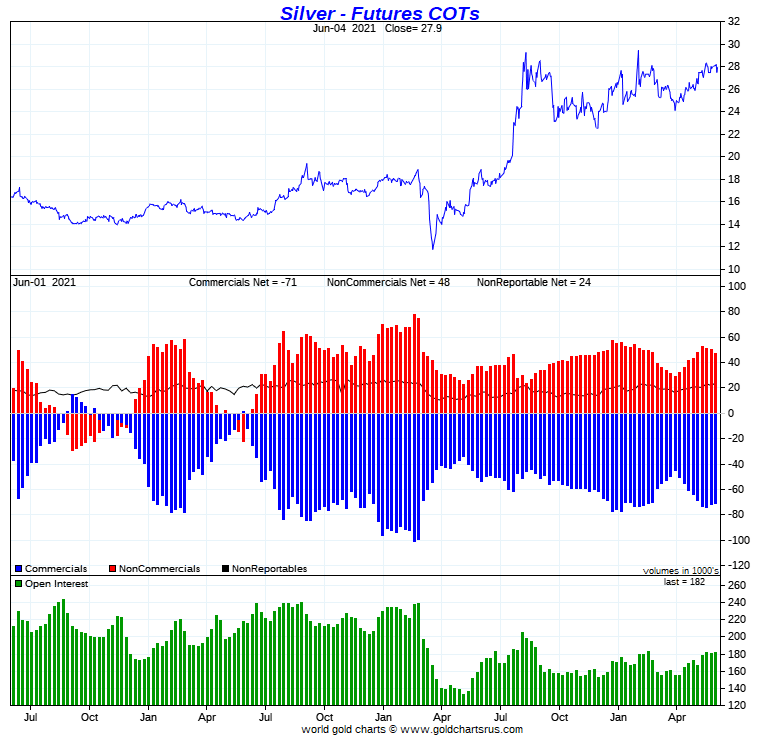
Ted was happy to see that the Big 4 were so active in covering shorts this week -- and that came despite the fact that there was such a small decrease in the Commercial net short position.
But as I stated in yesterday's column, Friday's COT Report was very much yesterday's news -- and we'll have to wait until next week's report to see what they were able to accomplish on Thursday's engineered price decline.
It seems that we're always waiting for just one more COT Report.
In gold, the commercial net short position decreased by 2,694 COMEX contracts, or 269,400 troy ounces.
They arrived at that number by reducing their net long position by 8,038 contracts, but also reduced their short position by 10,732 contracts -- and it's the difference between those two numbers that represents their change for the reporting week.
But under the hood in the Disaggregated COT Report, it totally different than it was for silver, as the Managed Money traders increased their net long position by 2,718 contracts -- and it was the traders in the other two categories that were big sellers during the reporting week...the Other Reportables by 3,659 contracts -- and the Nonreportable/small traders by 1,753 contracts.
Doing the math: 1,753 plus 3,659 minus 2,718 equals 2,694 COMEX contracts, the change in the commercial net short position...which it must do.
The commercial net short position in gold sits at 24.82 million troy ounces, compared to the 25.09 million troy ounces they were short in last week's COT Report. Not a big change to be sure, but it was certainly a better number than I was expecting, which was a small increase.
The Big 8 traders are short 21.18 million troy ounces of gold in this week's COT Report, compared to the 21.63 million troy ounces they were short in last week's COT Report. That's not a big change on the surface, but Ted said that the Big 4 were covering shorts aggressively, whereas the Big '5 through 8' shorts actually added to their short positions during the reporting week.
The Big 8 are short about 85 percent of the commercial net short position in gold, down about one percentage point from last week's COT Report.
I didn't talk to Ted about this yesterday, but I suspect that JPMorgan is still net long a few thousand contracts in the COMEX futures market in gold.
Here's Nick Laird's 3-year COT chart for gold, updated with Friday's data -- and this week's change, although on the smallish side, should be noted. Click to enlarge.
Like in silver, Ted was very happy that the Big 4 shorts were as aggressive as they were in covering short positions during the reporting week.
And though also very much "yesterday's news" as well, the small changes in the headline numbers, disguised the positive surprises that occurred out of sight under the hood.
In the other metals, the Managed Money traders in palladium increased their net long position by a fairly hefty 410 COMEX contracts during the last reporting week -- and are net long the palladium market by 3,819 COMEX contracts...around 36 percent of the total open interest...up about 4 percentage points from last week. And as I continue to point out for what seems like forever now, the COMEX futures market in palladium continues to be a market in name only, as its price is mostly set in the spot market. In platinum, the Managed Money traders increased their net long position by a smallish 498 contracts -- and are net long the platinum market by 13,765 COMEX contracts...about 20 percent of total open interest -- down a chunky 9 percentage points from last week. In copper, the Managed Money traders decreased their net long position by a further 6,280 COMEX contracts -- but are still net long copper to the tune of 26,768 COMEX contracts...about 669 million pounds of the stuff -- and about 11 percent of total open interest...down about 3 percentage points from last week.
![]()
Here’s Nick Laird’s “Days to Cover” chart, updated with the COT data for positions held at the close of COMEX trading on Tuesday, June 1. It shows the days of world production that it would take to cover the short positions of the Big 4 — and Big '5 through 8' traders in each physically traded commodity on the COMEX.
I consider this to be the most important chart that shows up in every Saturday column -- and it deserves a minute of your time. Click to enlarge.
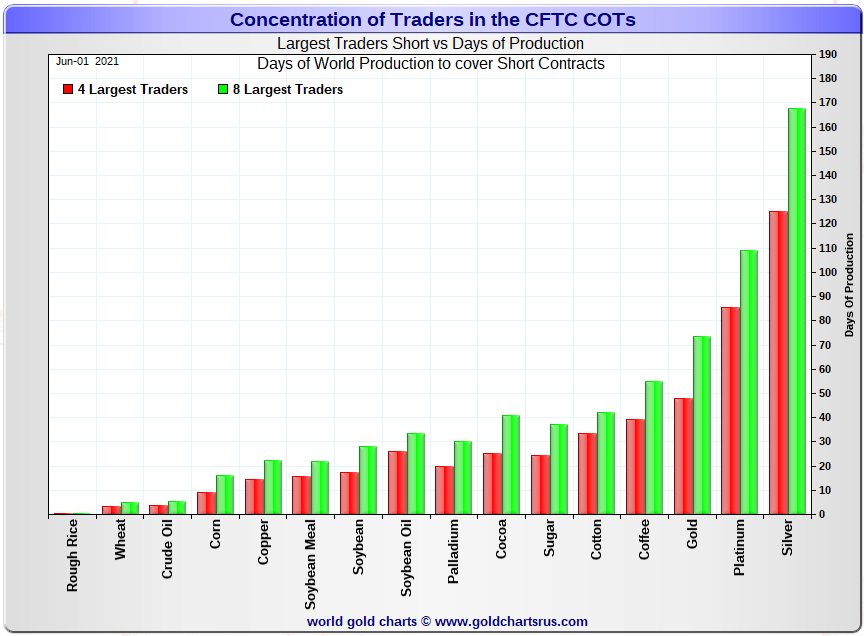
In it, the Big 4 traders are short about 125 days of world silver production, down 3 days from the prior week's report. The ‘5 through 8’ large traders are short an additional 43 days of world silver production...up 1 day from the prior COT Report for a total of about 168 days that the Big 8 are short...down 2 days from last week's COT report. [In the prior reporting period they were short 170 days of world silver production.]
This represents just under 6 months of world silver production, or about 392 million troy ounces of paper silver held short by the Big 8.
In the COT Report above, the Commercial net short position in silver was reported by the CME Group at 357 million troy ounces. As mentioned in the previous paragraph, the short position of the Big 4/8 traders is around 392 million troy ounces. So the short position of the Big 4/8 traders is larger than the total Commercial net short position by about 392-357=35 million troy ounces...about unchanged from last week's report.
The reason for the difference in those numbers two paragraphs ago...as it always is...is that Ted's raptors, the 29-odd small commercial traders other than the Big 8, are net long that amount...about 35 million troy ounces.
Another way of stating this [as I say every week in this spot] is that if you remove the Big 8 shorts from the commercial category, the remaining traders in the commercial category are net long the COMEX silver market. It's the Big 8 against everyone else...a situation that has existed for almost five decades in silver -- and in platinum and palladium too...and until about a month ago, in gold as well.
As per the first paragraph above, the Big 4 traders in silver are short around 125 days of world silver production in total. That's a bit over 31 days of world silver production each, on average...down a bit from last week's COT Report. The four big traders in the '5 through 8' category are short 43 days of world silver production in total, which is about 10.75 days of world silver production each, on average...up a tiny bit from last week's COT Report.
The Big 8 commercial traders are short 43.0 percent of the entire open interest in silver in the COMEX futures market, which is down a tiny bit from the 44.0 percent they were short in last week's COT report. And once whatever market-neutral spread trades are subtracted out, that percentage would be a bit over the 50 percent mark. In gold, it's 43.3 percent of the total COMEX open interest that the Big 8 are short, which is up from the 42.4 percent they were short in the prior week's COT Report -- and also a bit over the 50 percent mark once their market-neutral spread trades are subtracted out.
In gold, the Big 4 are short 48 days of world gold production, down 3 days from last week's COT Report. The '5 through 8' are short 26 days of world production -- up 2 days from last week's report...for a total of 74 days of world gold production held short by the Big 8 -- and down 1 day from last Friday's COT Report. Based on these numbers, the Big 4 in gold hold about 65 percent of the total short position held by the Big 8...down about 3 percentage points from last week's report.
As mentioned in last week's column, Ted said that JPMorgan is long around 4,000 contracts in gold -- and market neutral in silver. They have been a non-factor in the COMEX futures market for the last year and a bit...leaving the other Big 8 traders to struggle through on their own.
The "concentrated short position within a concentrated short position" in silver, platinum and palladium held by the Big 4 commercial traders are about 74, 79 and 67 percent respectively of the short positions held by the Big 8...the red and green bars on the above chart. Silver is down about 1 percentage point from last week's COT Report...platinum is up about 1 percentage point from a week ago -- and palladium is also down about 1 percentage point week-over-week...the lowest number I've ever seen in this precious metal.
But in actual fact, very little has changed from a week ago, as the Big 8 shorts are still hugely exposed in all four precious metals in the COMEX futures market, especially the Big 4...or maybe just the Big 2 now...Citigroup and HSBC -- and the above chart tells you all you need to know about their current plight. They're stuck -- and there's only two ways out for them...deliver physical metal into their short positions, or buy longs and cover that way. I have more about this in The Wrap.
The situation regarding the Big 4/8 shorts continues to be beyond obscene, twisted and grotesque -- and as Ted correctly points out, its resolution will be the sole determinant of precious metal prices going forward.
![]()
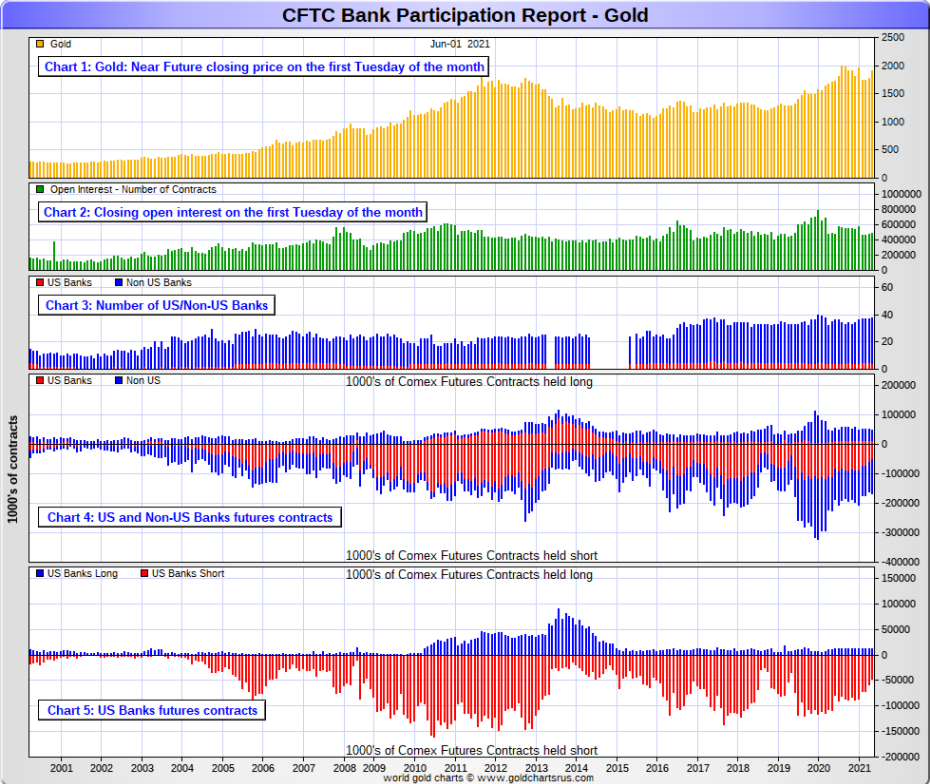
The June Bank Participation Report [BPR] data is extracted directly from yesterday's Commitment of Traders Report. It shows the number of futures contracts, both long and short, that are held by all the U.S. and non-U.S. banks as of Tuesday’s cut-off in all COMEX-traded products. For this one day a month we get to see what the world’s banks are up to in the precious metals —and they’re usually up to quite a bit.
[The June Bank Participation Report covers the time period from May 5 to June 1 inclusive.]
In gold, 5 U.S. banks are net short 34,543 COMEX contracts in the June BPR. In May’s Bank Participation Report [BPR] these same 5 U.S. banks were net short 46,666 contracts, so there was a fairly hefty decrease of 12,123 contracts from four weeks ago, the second big decrease in as many months.
Citigroup, HSBC USA, Bank of America and Morgan Stanley, plus one other would most likely be the U.S. banks that are short this amount of gold. I still have some suspicions about the Exchange Stabilization Fund as well, although if they're involved, they are most likely just backstopping these banks.
Also in gold, 34 non-U.S. banks are net short 82,159 COMEX gold contracts. In May's BPR, 32 non-U.S. banks were net short 61,612 COMEX contracts...so the month-over-month change shows a very hefty increase of 20,547 COMEX contracts.
At the low back in the August 2018 BPR...these same non-U.S. banks held a net short position in gold of only 1,960 contacts -- and they've been back on the short side in an enormous way ever since.
I suspect that there's at least two large non-U.S. bank in this group, one of which would be Scotiabank/Scotia Capital...plus HSBC most likely. And I have my suspicions about Barclays, Dutch Bank ABN Amro, French bank BNP Paribas, plus Australia's Macquarie Futures as well. Other than that small handful, the short positions in gold held by the vast majority of non-U.S. banks are mostly immaterial and, like in silver, have always been so.
As of this Bank Participation Report, 39 banks [both U.S. and foreign] are net short 23.9 percent of the entire open interest in gold in the COMEX futures market, which is up a tiny bit from the 23.0 percent that 37 banks were net short in the May's BPR.
Here’s Nick’s BPR chart for gold going back to 2000. Charts #4 and #5 are the key ones here. Note the blow-out in the short positions of the non-U.S. banks [the blue bars in chart #4] when Scotiabank’s COMEX short position was outed by the CFTC in October of 2012. Click to enlarge.
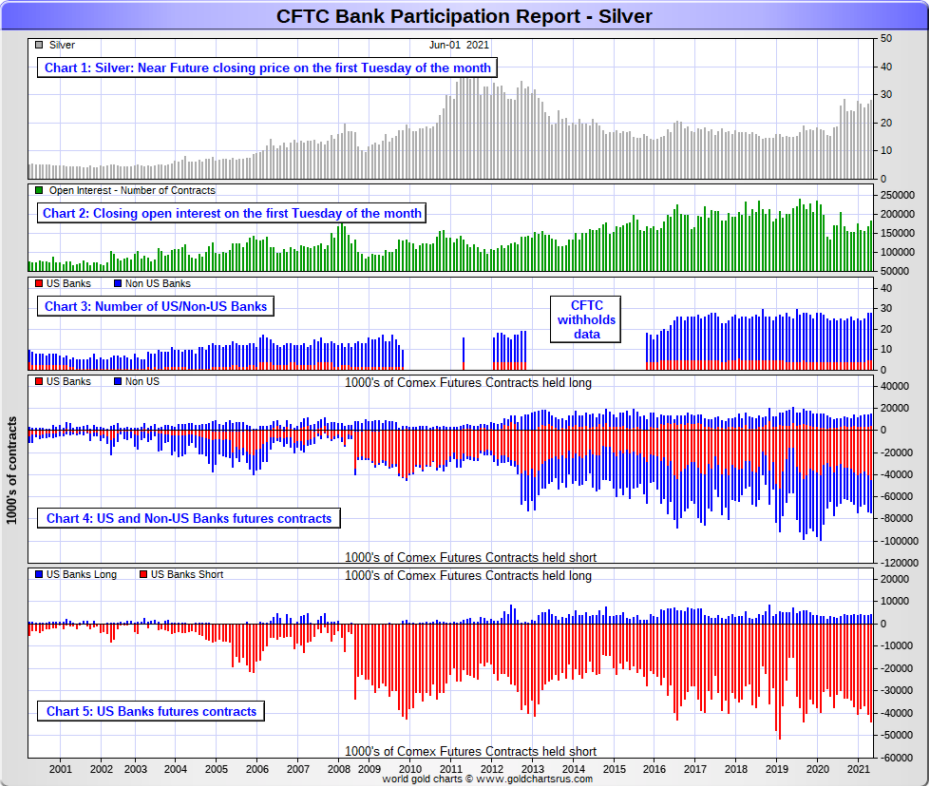
In silver, 5 U.S. banks are net short 39,562 COMEX contracts in June's BPR. In May's BPR, the net short position of 4 U.S. banks was 36,317 contracts, so the short position of the U.S. banks increased by 3,245 contracts month-over-month...the second sizeable monthly increase in a row.
As in gold, the four biggest short holders in silver of the five U.S. banks in total, would be Citigroup, HSBC USA -- and Bank of America, Morgan Stanley and one other...and NOT Goldman Sachs. And, like in gold, I'm starting to have my suspicions about the Exchange Stabilization Fund's role in all this...although indirectly, rather than overtly.
Also in silver, 23 non-U.S. banks are net short 19,308 COMEX contracts in the June BPR...which is down a decent amount from the 23,465 contracts that these same non-U.S. banks were short in the May's BPR.
I would suspect that Canada's Scotiabank/Scotia Capital still holds a goodly chunk of the short position of these non-U.S. banks...plus HSBC and Barclays. I also suspect that a number of the remaining non-U.S. banks may actually be net long the COMEX futures market in silver. But even if they aren’t, the remaining short positions divided up between these other 20 non-U.S. banks are immaterial — and have always been so.
As of June's Bank Participation Report, 28 banks [both U.S. and foreign] are net short 32.3 percent of the entire open interest in the COMEX futures market in silver—down a decent amount from the 35.7 percent that these same 28 banks were net short in the May BPR. And much, much more than the lion’s share of that is held by Citigroup, HSBC, Bank of America, Barclays -- and Scotiabank -- and possibly one other non-U.S. bank...all of which are card-carrying members of the Big 8 shorts.
I'll point out here that Goldman Sachs has no derivatives in the COMEX futures market in any of the four precious metals.
Here’s the BPR chart for silver. Note in Chart #4 the blow-out in the non-U.S. bank short position [blue bars] in October of 2012 when Scotiabank was brought in from the cold. Also note August 2008 when JPMorgan took over the silver short position of Bear Stearns—the red bars. It’s very noticeable in Chart #4—and really stands out like the proverbial sore thumb it is in chart #5. Click to enlarge.
In platinum, 5 U.S. banks are net short 19,305 COMEX contracts in the June Bank Participation Report, which is only down a tiny amount [507 contracts] from the 19,812 COMEX contracts that these same 5 U.S. banks were short in the May BPR. This is the sixth month in a row that there has been virtually no change in platinum by the U.S. banks.
[At the 'low' back in July of 2018, these U.S. banks were actually net long the platinum market by 2,573 contracts]
Also in platinum, 17 non-U.S. banks are net short 5,265 COMEX contracts in the June BPR, which is down a tiny 118 contracts from the 5,383 COMEX contracts that 15 non-U.S. banks were net short in the May BPR.
[Note: Back at the July 2018 low, these same non-U.S. banks were net short only 1,192 COMEX contracts.]
And as of June's Bank Participation Report, 22 banks [both U.S. and foreign] are net short 36.4 percent of platinum's total open interest in the COMEX futures market, which is down a bit from the 38.8 percent that 20 banks were net short in May's BPR.
But it's the U.S. banks that are on the short hook big time -- and the real price managers. They have little chance of delivering into their short positions, although a very large number of platinum contracts have already been delivered during the last six months or so. But that fact, like in both silver and gold, has made no difference whatsoever to their short positions held. Their short positions in the COMEX futures market in this precious metal is equally as dire as it is in the other two precious metals.
Here's the Bank Participation Report chart for platinum. Click to enlarge.
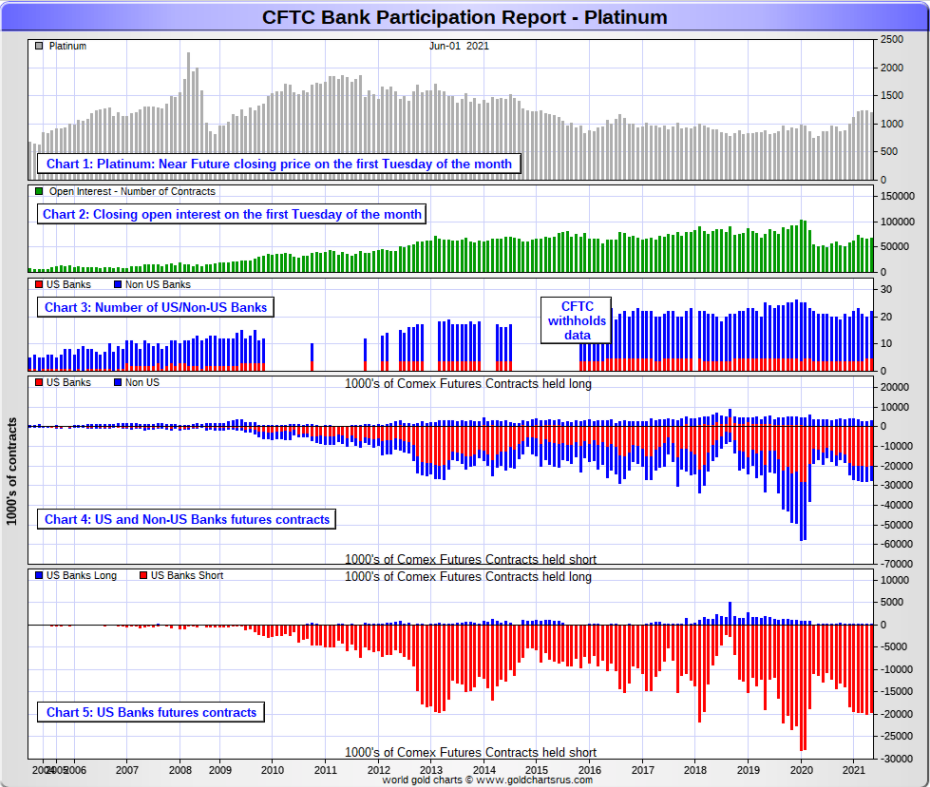
In palladium, 4 U.S. banks are net short 2,026 COMEX contracts in the June BPR, which is down big [35 percent] from the 3,124 contracts that these same 4 U.S. banks were net short in the May BPR. And I will point out here that these U.S. banks hold only 6 long contracts in palladium, compared to 2,032 contracts that they hold on the short side.
They were short only 1,194 COMEX contract in the July 2020 BPR.
Also in palladium, 11 non-U.S. banks are net long 225 COMEX palladium contracts—up from the 146 contracts that 10 non-U.S. banks were net long in the May BPR. These non-U.S. banks have been net long by a bit in palladium for the last fifteen months in a row.
And as I've been commenting for almost forever now, the COMEX futures market in palladium is a market in name only, because it's so illiquid and thinly-traded. Its total open interest at Tuesday's cut-off was only 10,608 contracts...compared to 67,551 contracts of total open interest in platinum...182,312 in silver -- and 489,198 COMEX contracts in gold.
As of this Bank Participation Report, 15 banks [both U.S. and foreign] are net short 17.0 percent of the entire COMEX open interest in palladium...down from the 25.0 percent of total open interest that 14 banks were net short in May.
And because of the small numbers of contracts involved, along with a tiny open interest, these numbers are pretty much meaningless. So, for the last fourteen months in a row, the world's banks are no longer involved in the palladium market in a material way. According to Ted, palladium is mostly a cash market now.
Here’s the palladium BPR chart. And as I point out every month, you should note that the U.S. banks were almost nowhere to be seen in the COMEX futures market in this precious metal until the middle of 2007—and they became the predominant and controlling factor by the end of Q1 of 2013. They have imploded into insignificance over the last seventeen or so Bank Participation Reports -- and it remains to be seen if they return as big short sellers again at some point like they've done in the past. Click to enlarge.
Except for palladium, only a small handful of the world's banks/investment houses, most likely four or so in total -- and mostly U.S-based...continue to have meaningful short positions in the other three precious metals. It's a near certainty that they run this price management scheme from within their own in-house/proprietary trading desks...although its probable that their clients are short these metals as well.
The futures positions in silver and gold that JPMorgan holds are immaterial -- and have been since March of last year. According to Ted, they're long a bit in gold -- and market neutral in silver. It's the next Big 8 shorts et al. that are on the hook in everything precious metals-related...but as I just mentioned, it's most likely only the Big 4, or maybe the Big 2 now...as the concentration data is so stark...as per the above 'Days to Cover' chart.
But as has been the case for over a year now, the short positions held by the Big 4/8 traders/banks is the only thing that matters -- and how it is ultimately resolved [as Ted said earlier] will be the sole determinant of precious metal prices going forward.
I don't have all that many stories, articles or videos for you today.
![]()
CRITICAL READS
Jobs report shows improvement, but not enough to get Fed talking about tapering
Hiring improved in May, but 559,000 new jobs aren’t enough to spur the Federal Reserve to begin to talk about tapering back its bond purchases.
Friday’s Labor Department report on new payrolls was below the 671,000 expected but also was not weak enough to cast serious doubts on the economic recovery though it does reveal the underlying issues of a worker shortage and jobs mismatch. Click to enlarge.
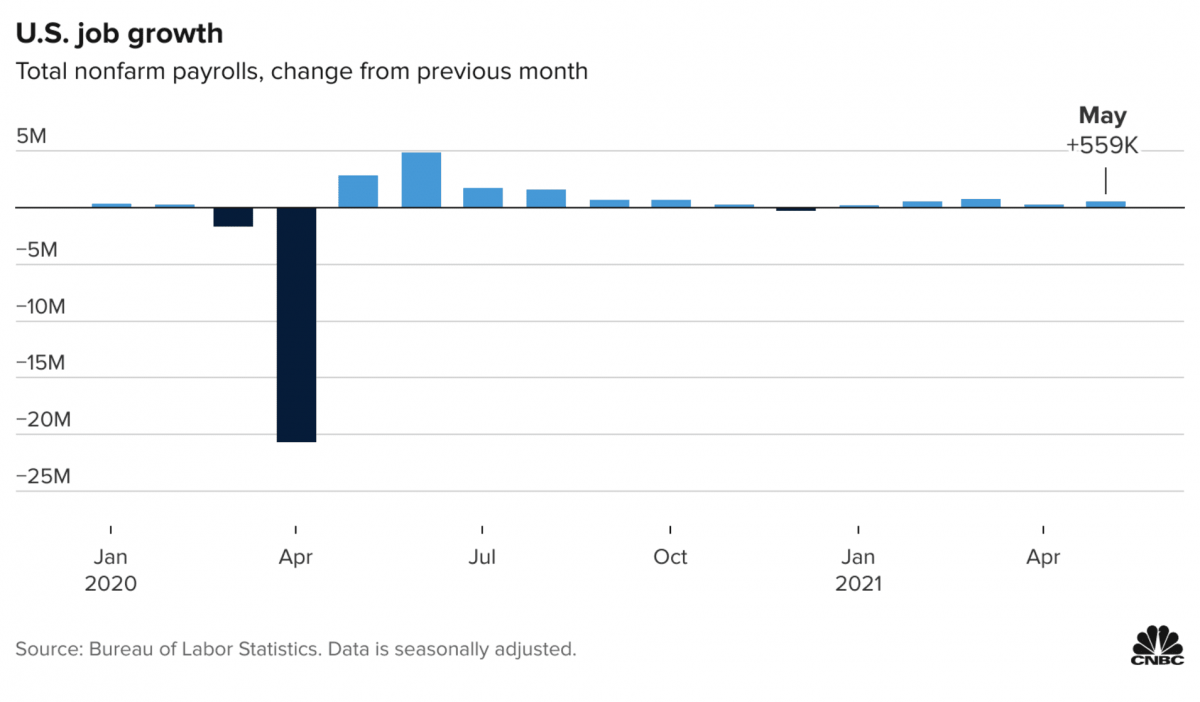
John Briggs, NatWest Markets’ global head of desk strategy, said the report was “Goldilocks” for risk assets, and “not too hot to bring in the Fed and not too cold to worry about the economy.”
“You’re in a zone where it’s OK. It’s better than last month,” Briggs said. “It’s not like it’s 1.2 million, and it’s not going to scare us for the Fed. The next event is next week’s CPI, and people are going to worry about that being strong.”
This news item appeared on the cnbc.com Internet site at 10:57 a.m. EDT on Friday morning -- and was updated about two hours later. I thank Swedish reader Patrik Ekdahl for sending it along -- and another link to it is here. The Zero Hedge spin on this story is headlined "May Payrolls Miss: 559K Jobs Added, Below Expectations; Unemployment Rate Drops" -- and I thank reader B.R. for that one. A related ZH story is headlined "Who's Hiring and Who's Firing in May: a Third of All Jobs Were Waiters and Bartenders" -- and that's from B.R. as well.
Stagflation Signals Soaring as Factory Orders Tumbled in April
For the first time since April 2020, U.S. Manufacturers new orders fell in April. The 0.6% MoM drop was triple the expected 0.2% MoM drop. Click to enlarge.
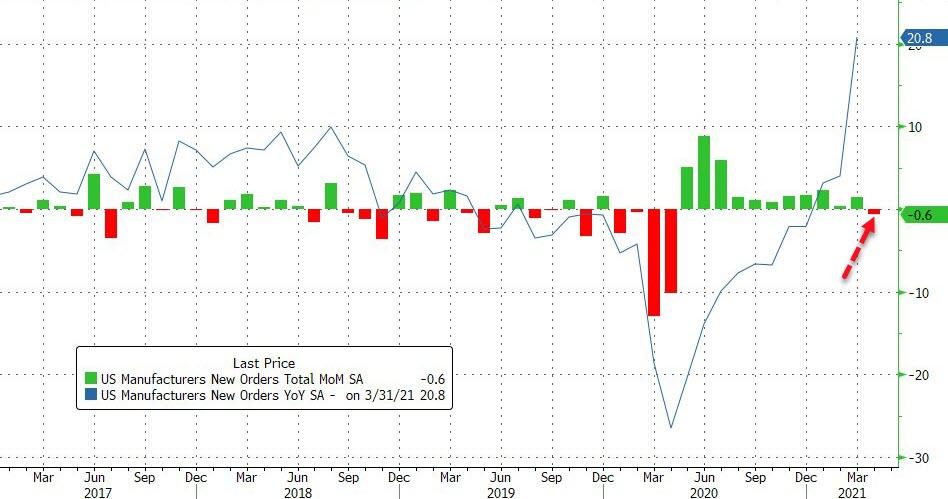
For context, here is inflation 'surprises' versus production 'surprises'...Click to enlarge.
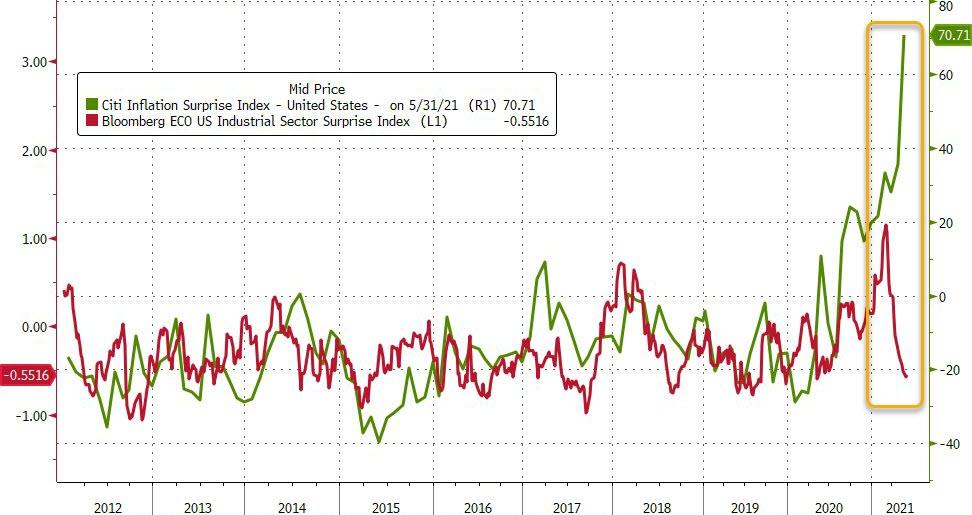
Stagflation anyone? What are you going to do Mr.Powell?
This tiny 2-chart Zero Hedge article was posted on their Internet site at 10:07 a.m. on Friday morning EDT -- and comes courtesy of reader B.R. as well. Another link to it is here. Gregory Mannarino's post market close rant for Friday is linked here -- and I thank B.R. for that too.
The Feds’ Bubble Will Pop -- Bill Bonner
Bubbles, bubbles, bubbles.
Today, we look at another institution that has been zombified by the feds – the stock market.
The stock market is supposed to allow investors to exchange shares in profit-making, wealth-increasing, goods-and-services-producing businesses.
Nobody ever knows what any share is worth. So the market “discovers” the price… minute by minute.
This price may be based on a single, most recent trade, but it sets the current value of all the similar shares outstanding. And it changes as new information comes forward.
In the U.S., prices are quoted in dollars. And the Federal Reserve has been tampering with the dollar’s value for many years. In the 12 months starting at the beginning of March 2020, it inflated the base supply of dollars (the Fed’s balance sheet) by 78% – with most of it going directly into the asset markets.
Even a lot of the stimmy check money has gone into the stock market. In a poll by Deutsche Bank, for example, at least half the respondents said they planned to put some of their stimmy money into stocks.
This leads, naturally, to price inflation in the stock market… which leads, naturally, to investors thinking their stocks are more valuable… which leads to a very unnatural situation…as both investors and Mr. Market himself begin to act a little funny… reacting to the rising prices, rather than actually discovering what individual stocks are worth.
This interesting commentary from Bill put in an appearance on the rogueeconomics.com Internet site on Friday sometime -- and another link to it is here.
The Fed in March 2020 opened Pandora’s box - and no one believes the Fed’s corporate bond market backstop will be relegated to “once-in-a-generation emergencies”. I am reminded of when the GSEs aggressively intervened in the MBS marketplace for the first time in 1994 (expanding balance sheets by a then unprecedented $150bn). This backstop momentously altered market risk perceptions and debt securities prices, incentivizing leveraged speculation and Bubble excess.
The GSE backstop returned in crisis year 1998 to the tune of $305 billion – and then these quasi-central banks expanded balance sheets another $317 billion in 1999, $242 billion in 2000, $345 billion in 2001, $242 billion in 2002, and $246 billion in 2003. Huge – history altering – numbers, but rather small potatoes compared to what will play out with the inflation of the Fed’s balance sheet.
June 4 – Bloomberg (Alex Wittenberg): “The Federal Reserve will keep its ‘invisible presence’ in the corporate-bond market even after unwinding a program that sent borrowing costs for companies plummeting while spurring a rally in credit, according to Citigroup… The Fed couldn’t credibly exit the debt market because ‘it cannot tolerate the catastrophic consequences of bond origination and secondary trading snapping shut,’ Citigroup strategists led by Daniel Sorid wrote… As long as corporate bonds remain important to the financial system, the Fed’s program will ‘continue to exert power over the market,’ according to Citigroup.”
Snake down the path of activist/interventionist central banking and inflationism, and there will be no turning back. That’s especially the case in this age of unfettered “money” and Credit, speculative excess and myriad asset Bubbles. It’s kind of crazy the Fed is using the unemployed to justify $120 billion market liquidity injections. To our central bankers’ great surprise, much of our nation’s labor market has Turned Tight. And it’s not at this point easy to pinpoint the benefits of prolonging egregious monetary inflation. Meanwhile, myriad risks – certainly including unleashing an inflationary spiral and stoking perilous asset Bubbles – are increasingly obvious.
Doug's weekly commentary appeared on his website in the very wee hours of Saturday morning -- and another link to it is here.
I didn't see any precious metal-related stories that I thought worth posting.
![]()
The Photos and the Funnies
Still heading west on Kane Valley Road on July 18...the first two photos are of the same lake, but taken from two different spots along the road. The clouds were back for photo three...my daughter standing on a high-pressure gas pipeline right-of-way, which the off-roader types have turned into their own. I thought about going on a short trip down it, but by that time I'd had enough of gravel roads for one day. Turning north onto Coldwater Road on the way back to Merritt, I stopped to take photo four of a farm bathed in the only sunlight there was -- and it stands out rather dramatically against the cloud shadow-covered landscape around it. Click to enlarge.


![]()
The WRAP
“Some even believe we (the Rockefeller family) are part of a secret cabal working against the best interests of the United States, characterizing my family and me as ‘internationalists’ and of conspiring with others around the world to build a more integrated global political and economic structure – one world, if you will. If that’s the charge, I stand guilty, and I am proud of it.” -- David Rockefeller
Today's pop 'blast from the past' dates from their debut album in 1967 -- and was later released as a single from the band's 1972 live album Procol Harum Live: In Concert with the Edmonton Symphony Orchestra. It is one of the band's most famous and popular songs -- and their third Top 40 hit on the U.S. Billboard Hot 100, peaking at number 16. I've heard them sing this tune live on two different occasion when I lived in Edmonton, but today's version was recorded live with the Danish National Symphony Orchestra -- and the link to that is here.
I already had a Beethoven piano sonata written up for today's classical 'blast from the past', when I stumbled across something else that stopped me dead in my tracks -- and the other work will have to wait until next week.
Zigeunerweisen (Gypsy Airs, Spanish: Aires gitanos), Op. 20, is a musical composition for violin and orchestra written in 1878 by the Spanish composer and virtuoso violinist Pablo de Sarasate. It remains one of Sarasate's most popular compositions and a favorite among violin virtuosos -- and for good reason.
I've featured this work a number of times over the years, but this performance is not of this earth -- and neither is the 8-year old Slovakian child prodigy Teo Gertler who plays it. He may be tender in years...but his soul is old.
Teo started playing at the age three and a half. Today he plays on a violin on an instrument appropriate for someone of his age – ¾ size violin made in 1853 by Jean Baptiste Vuillaume. He spends four hours a day practicing. Despite the high expectations placed on him, his parents make sure that Teo is able to remain a child.
The world certainly hasn't heard the last of this kid. This is one of the most fiendishly difficult pieces for violin ever written -- and he just tosses it off like it was nothing at all...at 8 years young! I was totally blown away. The link is here.
Without doubt, all of Thursday's engineered price declines in gold and silver would have vanished...and then some during the morning trading session on the COMEX yesterday, if the Big 4/8 traders hadn't stepped in when they did. And that's despite what the dollar index was or wasn't doing.
They stepped in to ensure that gold did not trade or close above $1,900 spot -- and silver above the $28 spot mark. That was obvious from their high ticks of the day in the spot market -- and also in their current front months as well.
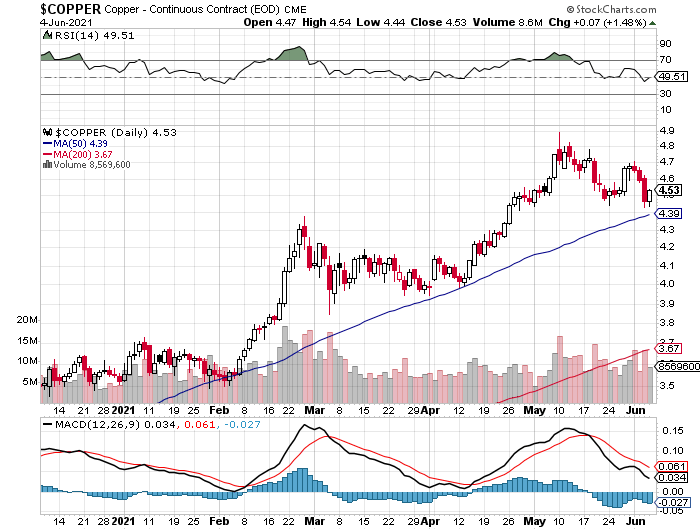
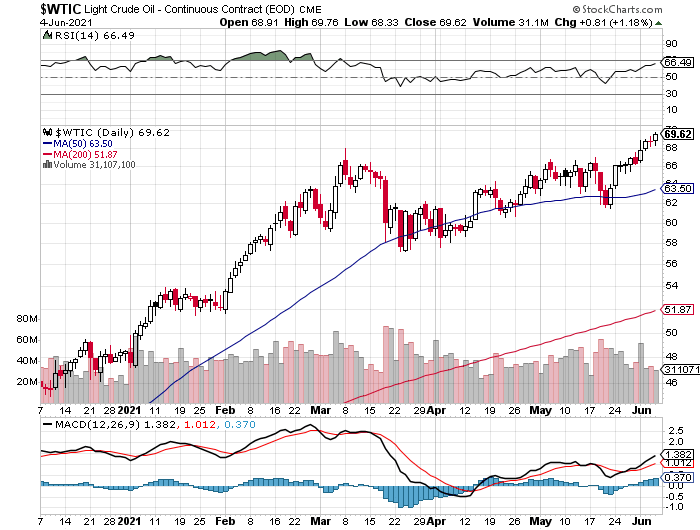
Copper closed higher by 7 cents, erasing half of its Thursday loss -- and WTIC closed higher yet again, up another 81 cents a barrel at $69.62 in its current front month. As Gregory Mannarino keeps pointing out, the propping up of the energy sector goes on, regardless of an oversupplied market and anemic retail demand. That includes natural gas as well.
Here are the 6-month charts for the Big 6 commodities, courtesy of stockcharts.com, so you can see the changes for yourself. Click to enlarge.
I haven't seen anything so far this month in the price action of the precious metals that indicates any big changes are in the works coming up on June 28 when the Basel III regulations kick in. At the moment it seems like the "same old, same old" type of price action to me.
It's certainly true that the Big 4 shorts are starting to show some signs of heading towards the exits in the last two COT Reports -- and their situation has undoubtedly improved further after the engineered price declines on Thursday. But they've gone inches...when they need to go miles.
There's still only two ways out of their predicament -- and that's to cover by purchasing offsetting long contracts, driving precious metal prices to the moon in the process...or delivering physical metal and closing out their short positions that way.
That might be possible in gold, but in the other three precious metals, you can forget about it, as the physical supply to do that just doesn't exist.
And even if it did exist, purchasing enough to cover would drive the physical prices to the moon in the process. They're stuck on the short side with no way out that won't drive the four precious metal prices to the moon and the stars.
And not to be forgotten in all this, as Ted has pointed out to me quite a number of times, is that not all those entities that are net long the COMEX futures market are in a position to take delivery. This would include those net long in the Managed Money and Other Reportables category, as they only trade paper. They only respond to price action -- and their business models/charters do not allow for physical delivery under any circumstances.
There is one other way out the Big 4/8 shorts that I mention from time to time -- and that would be if the COMEX was closed for trading in the four precious metals. They would then trade in the spot market only, like most of the platinum group of metals do now...think rhodium...without futures and options contracts attached to them. But the chances of that happening are remote at best...but it is an option in extremis.
That would save the Big 4/8 traders -- and all the other shorts as well, as their wouldn't be any financial meltdown of the bullion banks and investment houses involved on the short side...unless the Exchange Stabilization Fund is prepared to bail them out at taxpayer expense. And what an expense that would be!
We're only about three weeks away from Basel III coming into effect -- and everyone seems to have an opinion on what it will or won't do for the precious metals. I've posted some of them in my column over the last week or so, along with my own qualifying comments. Here's another one by Adrian Day headlined "Basel III is Coming, and That’s Bullish for Gold" that I found posted over on Doug Casey's internationalman.com Internet site on Thursday.
Could it be bullish for gold -- and the other precious metals? I, along with everyone else, is cheering for it, that's for sure. But the fact of the matter is that nobody knows exactly what's going to happen.
It's possible that all this price management we've been witnessing for the last year or so is just to keep precious metal prices in line until this accord goes into effect.
But will things change instantly when the clock strikes midnight in Europe on the evening before, or will this change happen over a longer and more drawn-out period of time? Don't forget, this accord doesn't go into effect in the U.K. until January 1 -- and the LBMA has already announced their displeasure with it. Their 7-page comments on it are linked here.
But what happens in Europe and London is somewhat of a sideshow, although I freely acknowledge that in certain respects they are connected to the goings-on with the New York bullion banks in the COMEX futures market, as they are also active in London and Zurich -- and other major world financial centers.
But Ground Zero for the price management scheme has always been the in the COMEX/GLOBEX trading system. That's where the precious metals prices are set -- and it's only what happens there that really matters. Whether Basel III will have a direct or indirect affect in this market...immediately or over time...is what I'll be watching for.
I spoke to this issue in my column back on the May 25 -- and I wouldn't change a word of what I said back then, which is as follows:
"Everyone, it seems, has an opinion on this issue -- and more are soon to follow in the days and weeks ahead...but I seriously doubt that anyone knows how this is going to shake out. I certainly don't.
But one thing I do know for sure is that this price management scheme in the precious metals in general -- and silver in particular, cannot go on forever. So therefore it seems possible that this Basel III agreement may be the event that the powers-that-be/deep state/New World Order crowd can point to when the whole thing finally does end. But even that is speculation on my part.
So where I stand on this is simple. Let's see what happens as time moves along. I'll let others lead this parade...whether they're qualified to speak to it or not."
But even as I sit on that proverbial fence, my bias is showing. Nobody wants to see this generations-long travesty of justice to end more than me -- and if this Basel III accord is the instrument that brings it about...then I'm all for it.
So we wait some more -- and I'm still "all in".
See you here on Tuesday.
Ed
About the author

SUBSCRIBE: https://edsteergoldsilver.com/

Ed Steer’s Daily Analysis of the Gold and Silver Markets
After eight years of writing about the precious metals for Casey Research, the folks at Stansberry & Associates—who just recently purchased controlling interest in the company—decided that my ‘niche market’ column didn’t fit into their plans.
Since the time that Casey Research was kind enough to offer me a stand-alone column, it became their most highly-rated blog almost from the outset—and has remained that way up to this date...