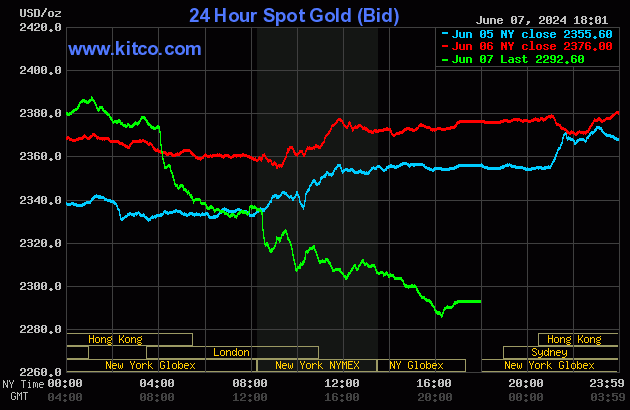
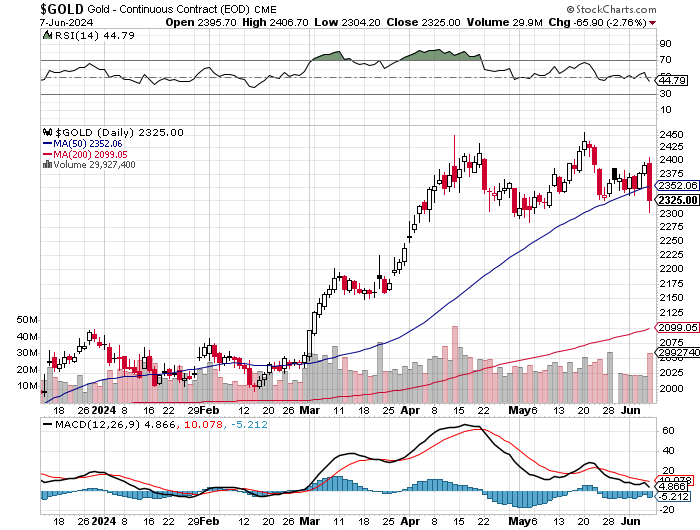
The gold price wandered a bit unevenly higher until a few minutes after 1 p.m. China Standard Time in Globex trading on their Friday afternoon -- and from there it was sold lower until it was light's out at 9 a.m. in London. It edged a bit higher between the noon BST silver fix and until the b.s. non-farm payroll number hit the tape at 8:30 a.m. in New York -- and 'da boyz' went back to work with a vengeance once more. Their efforts continued until 4:15 p.m. in after-hours trading -- and it managed to rally a bit from there until the market closed at 5:00 p.m. EDT.
The high and low ticks in gold were reported as $2,406.70 and $2,304.20 in the August contract. The June/August price spread differential in gold at the close in New York yesterday was $19.80...August/October was $22.60 -- and October/December was $22.70 an ounce.
Gold was closed on Friday afternoon in New York at $2,292.60 spot, down $83.40 from Thursday -- and 7 bucks off its Kitco-recorded low tick. Net volume was pretty humongous at around 302,000 contracts -- and there were just under 13,000 contracts worth of roll-over/switch volume on top of that ...mostly into October and December.
I saw that 269 gold, plus 10 silver contracts were traded in June yesterday, so we'll see what difference that makes in this evening's Daily Delivery and Preliminary Reports, if anything.
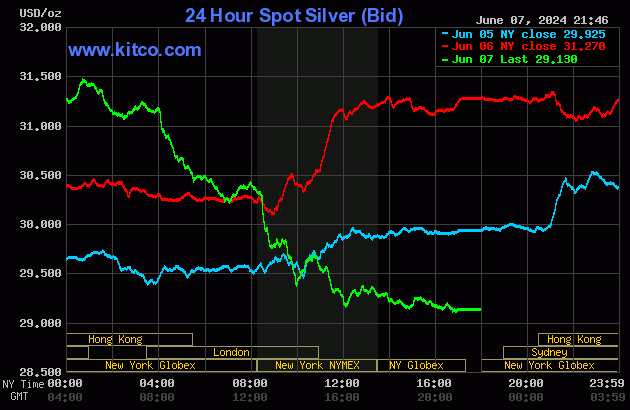
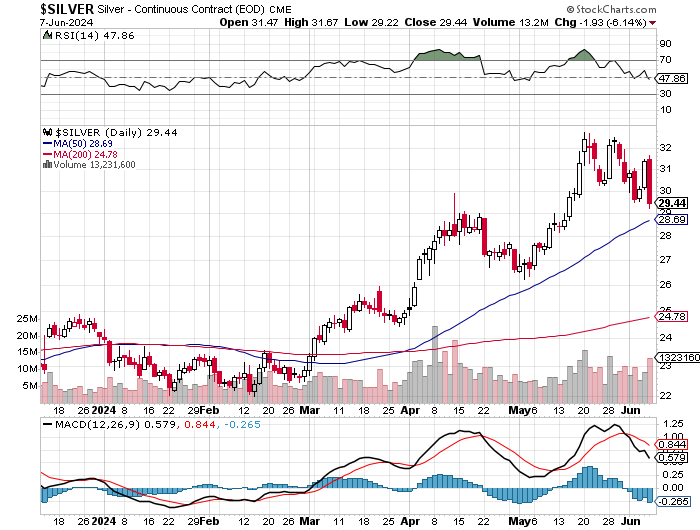
The silver price had a noticeable down/up move in early Globex trading on Friday, starting at 9 a.m. China Standard Time and ending at its 12:45 p.m. CST high tick of the day. The collusive commercial shorts wasted no time from there -- and its price path was managed in a very similar fashion as gold's... which lasted until 12 o'clock noon in COMEX trading in New York. From that juncture it had a broad and very quiet up/down move that lasted until shortly before the market closed at 5:00 p.m. EDT.
The high and low ticks in silver were recorded by the CME Group as $31.67 and $29.22 in the July contract...an intraday move of $2.45 the ounce. The July/September price spread differential in gold at the close in New York yesterday was 34.0 cents -- and September/December was 43.5 cents an ounce.
Silver was closed in New York on Friday afternoon at $29.13 spot, down $2.14 from Thursday...a 7% decline -- and only 4 cents off its Kitco-recorded low tick. Net volume was exceedingly heavy at a bit under 110,000 contracts -- and there were 30,000 contracts worth of roll-over/switch volume out of July and into future months in this precious metal...mostly into September, but with a decent amount into December as well.
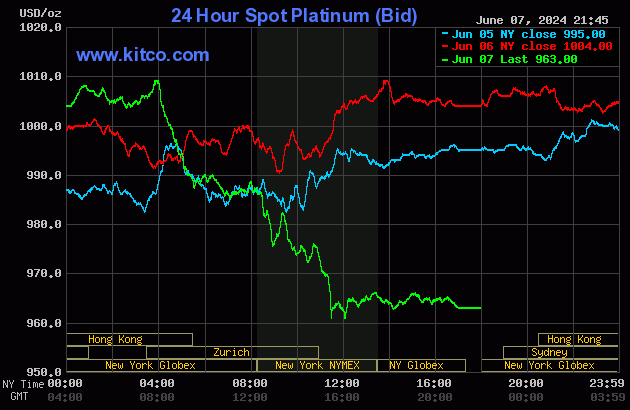
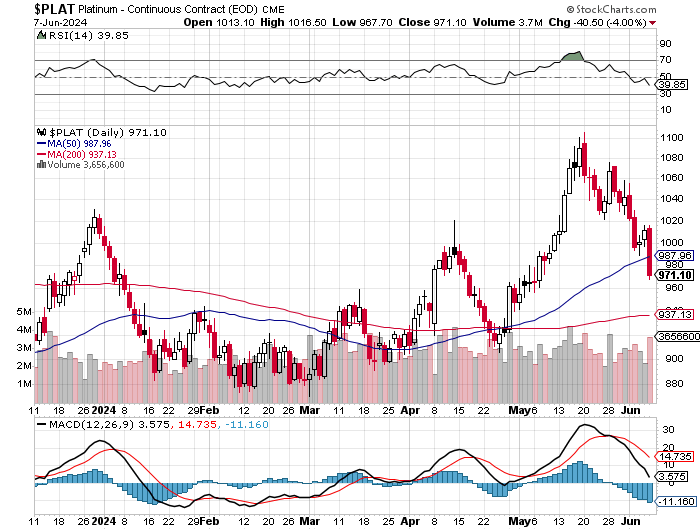
Platinum wandered quietly sideways to a bit higher until around 9:45 a.m. CEST in Globex trading in Zurich -- and at 10 a.m. on the dot [9 a.m. in London] its engineered price decline commenced along with silver and gold's. Its low tick was set at 11:30 a.m. in COMEX trading in New York and, like silver, had a very quiet and broad up/down move from there until the market closed at 5:00 p.m. EDT. Platinum was closed at $963 spot, down another 41 dollars.
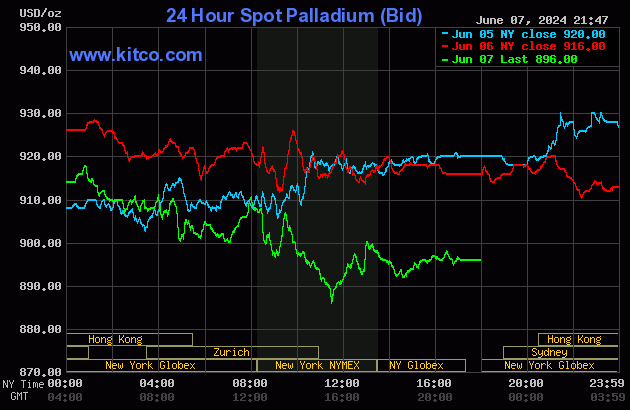
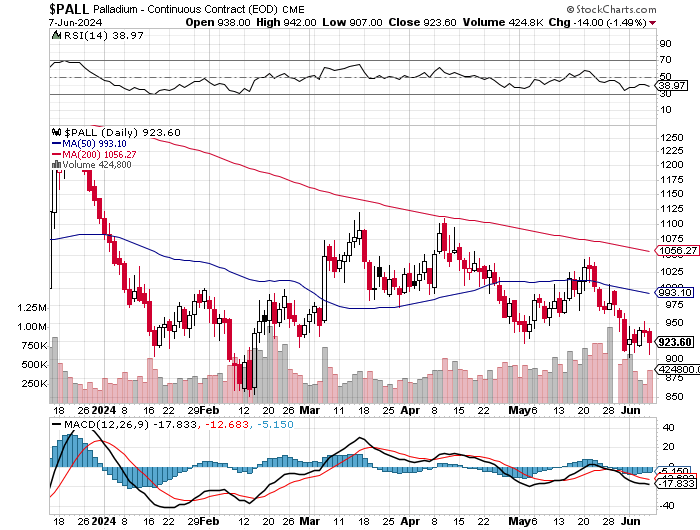
Palladium hit its high tick of the day very shortly after 9 a.m. China Standard Time in Globex trading on their Friday morning. From that point it was engineered quietly and very unevenly lower until 'da boyz' set its low at 11:35 a.m. in COMEX trading in New York. It was allowed to rally a bit until 1 p.m. EDT -- and then had a quiet down/up move that lasted until very shortly before trading ended at 5:00 p.m. EDT. Palladium was closed at $896 spot, down 20 bucks from Thursday.
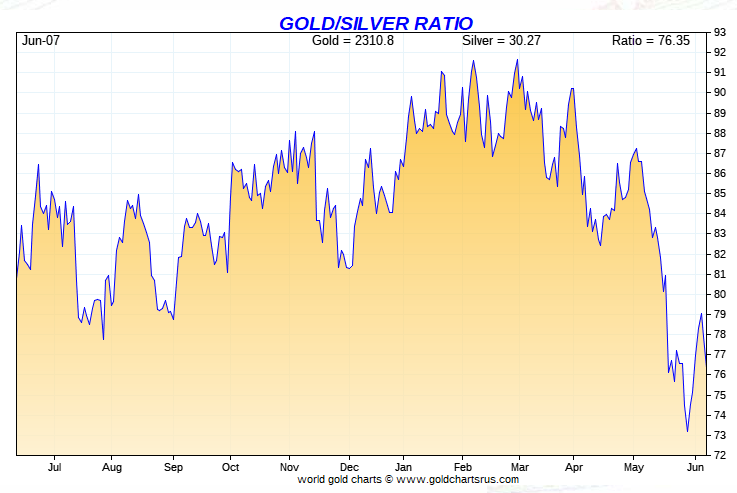
Based on the kitco.com spot closing prices in silver and gold posted above, the gold/silver ratio worked out to 78.7 to 1 on Friday....compared to 76.0 to 1 on Thursday.
Here's the 1-year Gold/Silver Ratio Chart...courtesy of Nick Laird and, for whatever reason, Friday's data point is not on it. Click to enlarge.
![]()
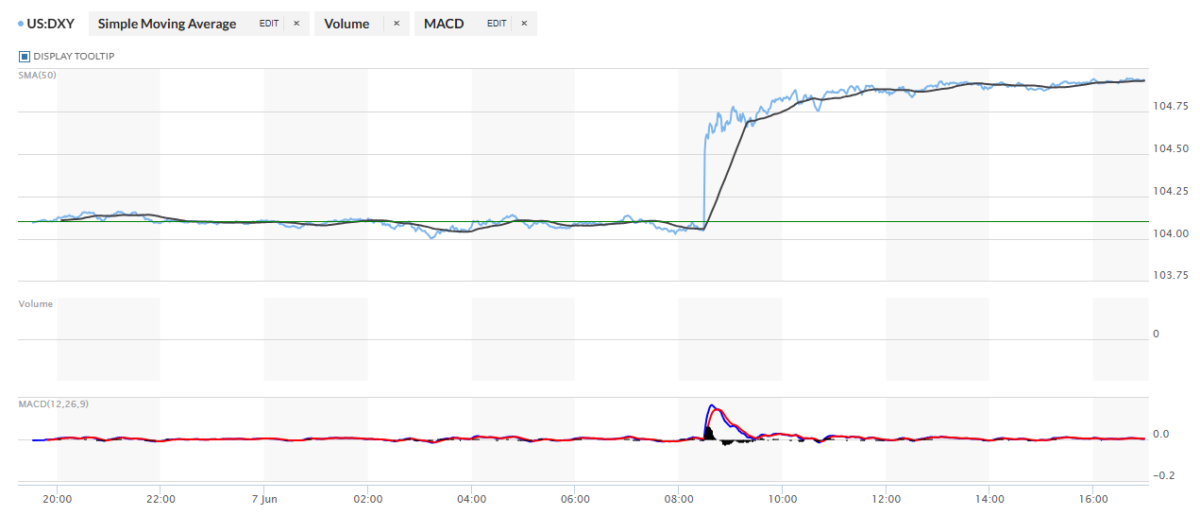
The dollar index closed very late on Thursday afternoon in New York at 104.10 -- and then opened lower by 1 basis point once trading commenced at 7:30 p.m. EST on Thursday evening, which was 7:30 a.m. China Standard Time on their Friday morning. From that juncture it traded almost ruler-flat until the powers-that-be goosed it higher on the non-farm payroll number at 8:30 a.m. in New York. Most of the big gains were in by 8:32 a.m. -- and from there it edged quietly higher at an ever-decreasing rate until around 1:05 p.m. EDT. It didn't do much after that.
The dollar index finished the Friday trading session in New York at 104.89 ...up 79 basis points from its close on Thursday -- and 5 basis points below its indicated close on the DXY chart below.
Here's the DXY chart for Friday...thanks to marketwatch.com as usual. Click to enlarge.
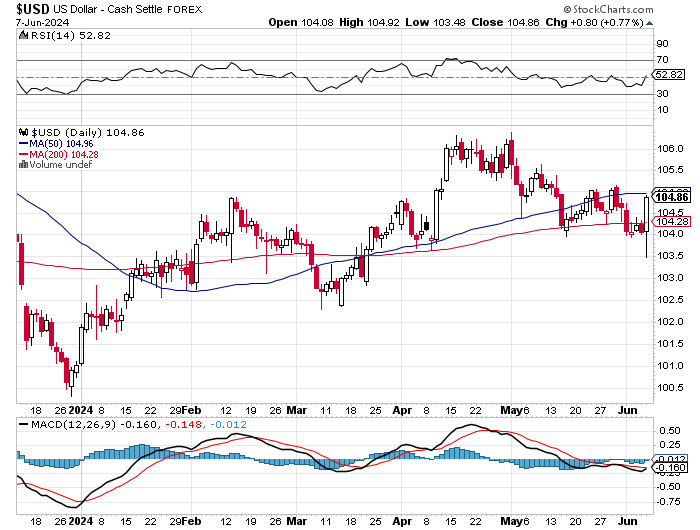
Here's the 6-month U.S. dollar index chart, courtesy of stockcharts.com as always. The delta between its close...104.86...and the close on the DXY chart above, was 3 basis points below its close on the DXY chart above. Click to enlarge.
The only obvious correlation between the dollar index and precious metal prices came at 8:30 a.m. in New York on that DXY ramp job -- and that correlation lasted for about ten minutes. Both before and after that time, it was all 'da boyz'.
U.S. 10-year Treasury: 4.4300%...up 0.1490/(+3.48%)...as of the 1:59 p.m. CDT close
Even after that big 'up' move in the 10-year yesterday, it still closed down by a bit on the week.
Here's the 5-year 10-year U.S. Treasury chart from the yahoo.com Internet site -- which puts the yield curve into a somewhat longer-term perspective. Click to enlarge.
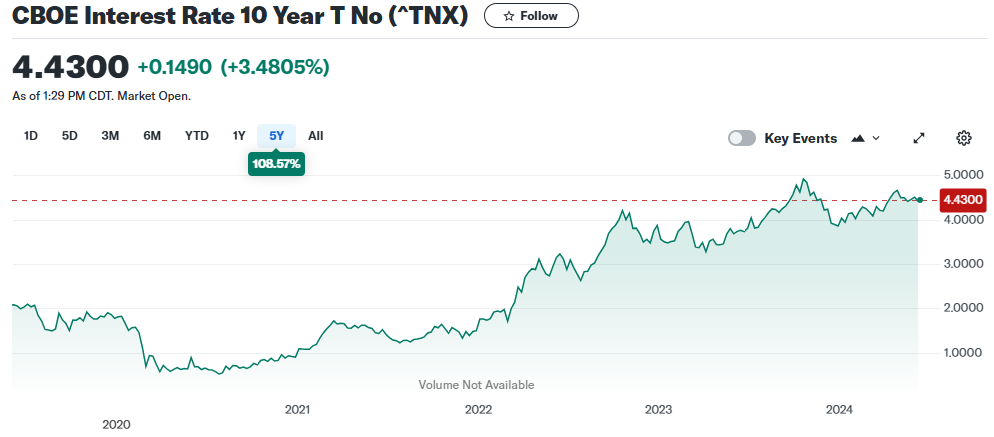
It's more than obvious that the Fed has been managing the yield curve since it hits 4.988% high back on 19 October 2023...as per the above chart. How long they can keep this up in the current inflationary environment is unknown.
![]()
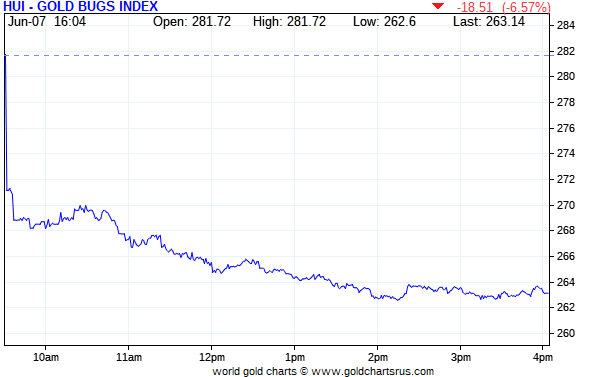
The gold stocks gapped down big during the first five minutes of trading once it began at 9:30 a.m. EDT in New York on Friday morning. They didn't do much from there until 10:30 a.m. -- and then gradually faded until around 2 p.m. They didn't do much after that. The HUI closed down a hefty 6.57 percent.
Here's Nick's new 1-year Silver Sentiment Index chart, updated with Friday's candle -- and they were pounded into the dirt to the tune of 7.41 percent. Click to enlarge.
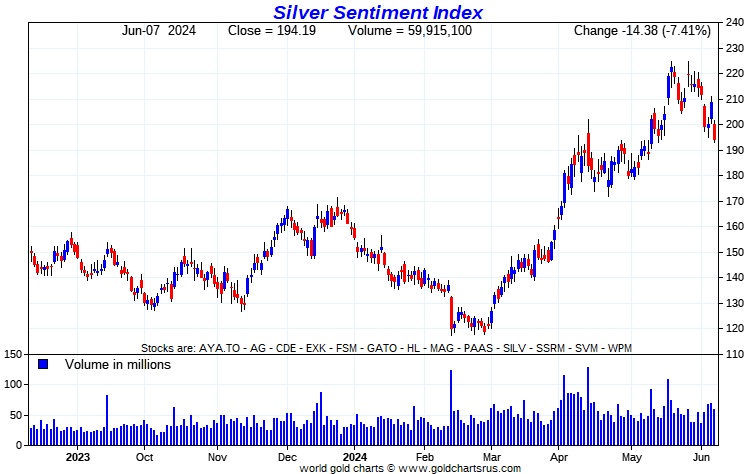
There were obviously no stars yesterday, unless you consider SSR Mining down only 4.39 percent as one -- and the pooch with the most fleas was Coeur Mining, closing down 9.31 percent.
Considering how badly silver got trashed on Friday...down 7 percent...their underlying equities got off easy.
There was this news from Silvercorp Metals yesterday...which is really old news.
The reddit.com/Wallstreetsilver website, now under 'new' but not improved management, is linked here. The link to two other silver forums are here -- and here.
![]()
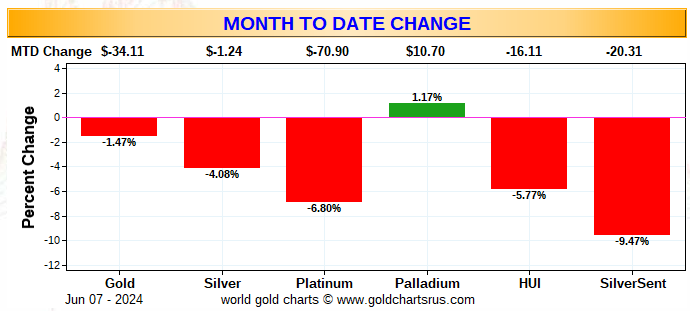
Here are the two of the usual three charts that appear in every weekend missive. They show the changes in gold, silver, platinum and palladium in both percent and dollar and cents terms, as of their Friday closes in New York — along with the changes in the HUI and the new Silver Sentiment Index.
Here's the month-to-date chart, which doubles as the weekly chart for this week only -- and strangely enough, only palladium has been allow to close positive on the week. Because of the engineered price declines on Monday and Friday, everything gold and silver-related closed down big on the week. Click to enlarge.
Here's the year-to-date chart -- with both gold and silver solidly in positive territory...unless 'da boyz' have even more pain in store. With 13 stocks in the Silver Sentiment Index going forward, instead of the previous 7...the big loss by SSR Mining earlier this year is now down to a tiny percentage of the total...but it's still down about 50% from the beginning of the year. And because of the big engineered price declines in the precious metals, the shares aren't underperforming as much. At some point investor interest will return with a vengeance, but exactly when...like I keep saying...is the $64,000 question.
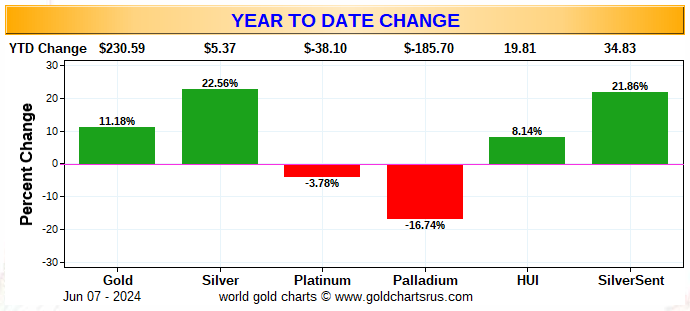
Of course -- and as I mention in this spot every Saturday -- and will continue to do so...is that if the silver price was sitting just below its all-time $50 high, like gold is currently just below its new all-time high of three weeks ago...it's a given that the silver equities would be outperforming their golden cousins by several orders of magnitude.
![]()
The CME Daily Delivery Report for Day 7 of June deliveries showed that 73 gold -- and 8 silver contracts were posted for delivery within the COMEX-approved depositories on Tuesday.
In gold, the two largest of the four short/issuers in total were Canada's BMO [Bank of Montreal] Capital and Wells Fargo Securities, issuing 54 and 12 contracts out of their respective house accounts. The two biggest long/ stoppers of the nine in total were Canada's Scotia Capital/Scotiabank and Wells Fargo Securities, picking up 35 and 15 contracts -- and all for their respective house accounts as well.
In silver, the two short/issuers were Advantage and JPMorgan, issuing 5 and 3 contracts out of their respective client accounts -- and Scotia Capital/ Scotiabank was the sole long/stoppers, which were all for its own account as usual, as it doesn't have a client account.
The link to Thursday's Issuers and Stoppers Report is here.
Month-to-date there have been 28,574 gold contracts issued/reissued and stopped -- and that number in silver is 1,113 contracts. In platinum it's 70 contracts -- and in palladium...90.
The CME Preliminary Report for the Friday trading session showed that gold open interest in June increased by 16 contracts, leaving 553 still open, minus the 73 contracts mentioned a bunch of paragraphs ago. Thursday's Daily Delivery Report showed that 121 gold contracts were actually posted for delivery on Monday, so that means that 121+16=137 more gold contracts just got added to the June delivery month.
Silver o.i. in June dropped by 198 contracts, leaving 125 still around, minus the 8 silver contracts mentioned a bunch of paragraphs ago. Thursday's Daily Delivery Report showed that 200 silver contracts were actually posted for delivery on Monday, so that means that 200-198=2 more silver contracts were added to June deliveries.
Total gold open interest on Friday declined by a net 13,838 COMEX contracts -- and I'm surprised it wasn't more. Total silver o.i. dropped, but only by a net 1,538 contracts. That was the third surprise of this kind in as many days, as I was expecting a number far larger than that considering the size of the engineered price decline -- and I'm not sure what to make of it...but it is very unusual. I'm sure that traders are putting on those uneconomic and market-neutral spread trades, which would mask what they're doing...but it would have to be a lot of them. Both these numbers are subject to some revisions by the time the CME gets around to posting the final figures on their Internet site later on Monday morning CDT.
![]()
After two days of deposits into GLD, there was a withdrawal from it yesterday, as an authorized participant removed 46,256 troy ounces of gold. And for the third time this week there was a deposit into SLV, as an a.p. added an impressive 3,197,481 troy ounces of silver.
There have been 7,366,562 troy ounces of silver added to SLV this week -- and it's a safe bet that it all came courtesy of JPMorgan & Friends.
In other gold and silver ETFs and mutual funds on Planet Earth on Friday, net of any changes in COMEX, GLD and SLV inventories...there were a net 128,562 troy ounces of gold added -- and a net 975,784 troy ounces of silver were added as well.
The largest two silver 'in' amounts were the 1,043,633 troy ounces that ended up at iShares/SVR -- and the 300,306 troy ounces that was deposited in Sprott's/PSLV. The largest 'out' amount were the 392,063 troy ounces that departed BullionVault.
There was no sales report from the U.S. Mint on Friday.
Month-to-date the mint has only sold what I reported on Tuesday...500 troy ounces of gold eagles -- and 500 one-ounce 24K gold buffaloes.
![]()
There was very little activity in gold over at the COMEX-approved depositories on the U.S. east coast on Thursday. Nothing was reported received -- and 9,806.050/305 kilobars were shipped out of Brink's, Inc. There was no paper activity, either -- and the link to this is here.
There was more very hefty activity in silver, as 608,857 troy ounces were reported received -- and 1,186,759 troy ounces were shipped out.
In the 'in' category, the largest amount was the one truckload/607,851 troy ounces that arrived at Loomis International...with the remaining 1,006 troy ounces/one good delivery bar getting dropped off at Delaware.
In the 'out' category, there were two truckloads shipped out...603,108 troy ounces from HSBC USA, with the other truckload departing JPMorgan. The remaining 2,978 troy ounces/3 good delivery bars left Delaware.
There was no paper action, either -- and the link to this, in troy ounces, is here.
It was pretty busy over at the COMEX-approved gold kilobar depositories in Hong Kong on their Thursday. They received 2,848 kilobars -- and shipped out 3,011 of them. Except for the 11 kilobars that arrived at Loomis International, the remaining in/out activity took place over at Brink's, Inc. as always. The link to this, in troy ounces, is here.
![]()
Here are the usual 20-year charts that show up in this space in every weekend column. They show the total amounts of physical gold and silver held in all know depositories, ETFs and mutual funds as of the close of business on Friday.
During the week just past, there were a net 614,000 troy ounces of gold added -- but a net 557,000 troy ounces of silver were removed. Click to enlarge.
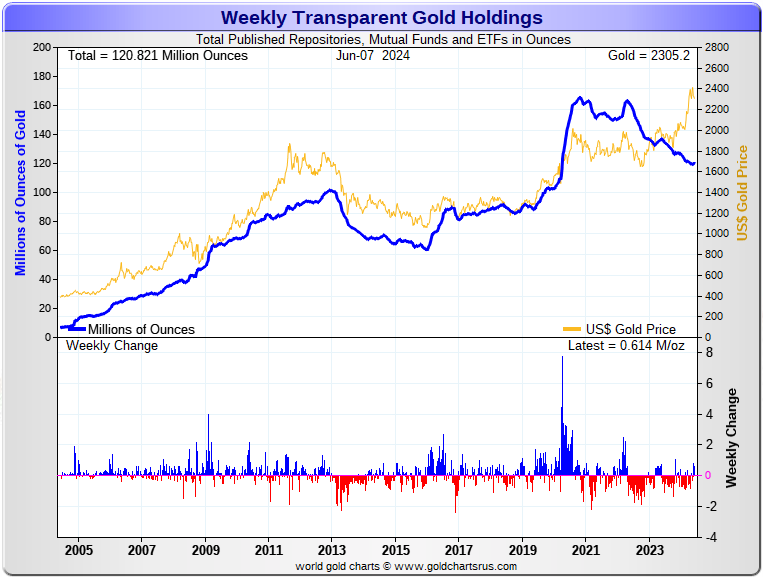
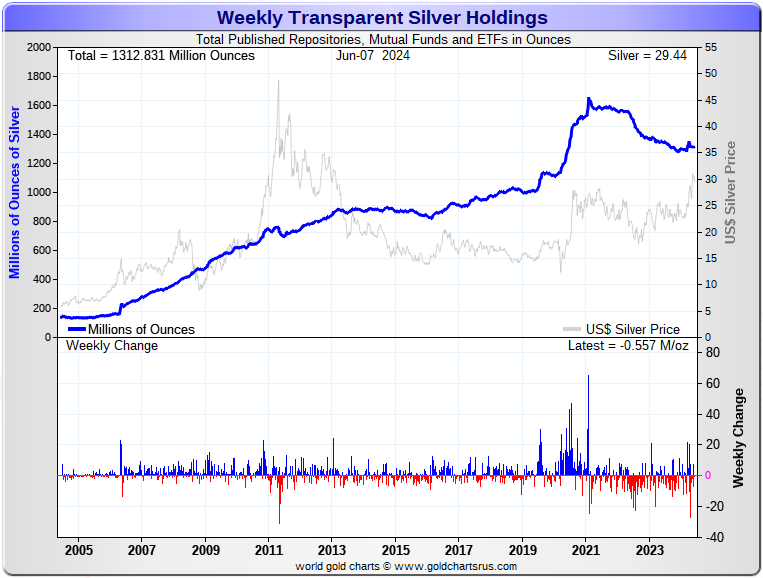
According to Nick Laird's data on his website, there were a net 1.421 million troy ounces of gold added -- but a net 1.028 million troy ounces of silver were withdrawn from all the world's known depositories, mutual funds and ETFs during the last four weeks.
Retail bullion sales are still pretty punk. Premiums vary. They're very high at Kitco...but somewhat to much lower in most other places. That will most likely change if gold and silver continue to power higher from here -- and physical shortages return. But we're a very long way from that at this point.
Then there's the huge quantities of silver that will be required by all the silver ETFs and mutual funds once institutional buying finally kicks in....which it has yet to do...although there were some signs of it this week. Adding to that demand will be the silver required to cover some or all of the short position in SLV.
And as Ted stated very recently, it would appear that JPMorgan has parted with well over 500 million troy ounces of the at least one billion troy ounces that they'd accumulated since 2011.
If they continue in this vein, they are going to have to cough up more ounces to feed this year's deficit...another 215 million of them according to that latest report from The Silver Institute...which would include the almost 120+ million ounces that India has purchased so far this year that we know of.
The physical demand in silver at the wholesale level continues unabated -- and that was on display again this week...as net withdrawals continued at the COMEX, but with big deposits into SLV and other ETFs and mutual funds. The amount of silver being physically moved, withdrawn or changing ownership seems to be hitting new heights with each passing week -- and that trend continued this week.
New silver has to be brought in from other sources [JPMorgan] to meet the ongoing demand for physical metal. This will continue until available supplies are depleted...which will be the moment that JPMorgan & Friends stop providing silver to feed this deepening structural deficit, now in its fourth year.
The vast majority of precious metals being held in these depositories are by those who won't be selling until the silver price is many multiples of what it is today.
Sprott's PSLV is the third largest depository of silver on Planet Earth with 171 million troy ounces -- and some distance behind the COMEX, where there are 295 million troy ounces being held...minus the silver mentioned in the next paragraph.
It's now been proven beyond a shadow of a doubt that 103 million troy ounces of that amount in the COMEX is actually held in trust for SLV by JPMorgan according to a letter Ted received from the CFTC earlier this year. That brings JPMorgan's actual silver warehouse stocks down to around the 27 million troy ounce mark...quite a bit different than the 129.6 million they indicate they have.
But PSLV is still some distance behind SLV, as they are the largest silver depository, with 421 million troy ounces as of Friday's close.
The latest short report from May 24, showed that the short position in SLV increased by 19.05 percent...from 18.52 million shares sold short...up to 22.05 million shares sold short. BlackRock issued a warning a few years ago to all those short SLV, that there might come a time when there wouldn't be enough metal for them to cover. That would only be true if JPMorgan decides not to supply it to whatever entity requires it...which is most certainly a U.S. bullion bank, or perhaps more than one.
The next short report will be posted on The Wall Street Journal's website early Tuesday evening on June 11.
Then there's that other little matter of the 1-billion ounce short position in silver held by Bank of America in the OTC market...with JPMorgan & Friends on the long side. Ted says it hasn't gone away -- and he's also come to the conclusion that they're short around 25 million ounces of gold with these same parties as well. The latest report for the end of Q4/2023 from the OCC came out about two months ago now -- and Ted said back then that very little, if anything, had changed.
![]()
The Commitment of Traders Report, for positions held at the close of COMEX trading on Tuesday, was not what I was expecting to see...or hoping for. Despite the big engineered decline in silver during the reporting week, the commercial net short position rose by a bit -- and the Big 4 went even further short. There was also a smallish increase in the commercial net short position in gold -- and all of that plus more was because of an increase in the Big 4 short position as well.
Of course this COT Report in silver is somewhat 'yesterday's news' after what's happened since the Tuesday cut-off -- and particularly after the shenanigans on Friday.
In silver, the Commercial net short position increased by 448 COMEX contracts, or 2.240 million troy ounces of the stuff.
They arrived at that number by decreasing their long position by 4,650 COMEX contracts -- and also reduced their short position by 4,202 contracts. It's the difference between those two numbers that represent their change for the reporting week.
Under the hood in the disaggregated COT Report, there were some pretty impressive changes. The Managed Money traders reduced their net long position, but only by 3,424 COMEX contracts...which they accomplished by reducing their long position by 5,334 contracts, but also reduced their short position by 1,910 contracts -- and I suspect that this big drop in the gross net short position was due to that Managed Money trader selling some of his most recently placed shorts for a profit.
The Managed Money traders remain net long silver by 34,331 COMEX contracts, which is still a painfully bearish number.
But on the other hand, the Other Reportables and Nonreportable/small traders added to their net long positions during the reporting week...the former by 2,644 COMEX contracts -- and the latter by 1,228 contracts.
Doing the math: 2,644 plus 1,228 minus 3,424 equals 448 COMEX contracts, the change in the Commercial net short position.
The Commercial net short position in silver now stands at 81,520 COMEX contracts, or 407.60 million troy ounces of silver...up those 448 contracts from the 81,072 COMEX contracts, or 405.36 million troy ounces they were short in last week's COT Report. This remains the largest commercial net short position in silver since very early April of 2020.
The surprise was that the Big 4 shorts...now all bullion banks I suspect... increased their net short position by 1,614 contracts, up to 54,136 contracts during the reporting week...from the 52,496 contracts they were short in last Friday's COT Report...almost entirely reversing their decrease from a week ago.
The Big '5 through 8' shorts decreased their net short position, them by a749 contracts...from the 27,727 contracts in last week's report, down to 26,978 contracts in this week's COT Report. This remains an ultra bearish number for them...their third highest short position on record.
The Big 8 commercial shorts in total increased their overall net short position from 80,223 contracts, up to 81,114 COMEX contracts week-over-week...an increase of 891 COMEX contracts in total.
To make up the difference between the change in the Commercial net short position...an increase of 448 contracts -- and what the Big 8 shorts did...an increase of 891 contracts... Ted's raptors, the small commercial traders other than the Big 8, were buyers of 443 contracts...which is no change at all.
A few weeks ago when the gross short position of the Managed Money traders blew out by almost 5,000 contracts, I attributed that to this one rogue trader 'doubling down' on his existing 8,000 or so contracts he was already short and in the hole on big time. I suspect that the 1,910 contract decline in the gross Managed Money short position was him covering some of his newly acquired shorts at a profit. This most likely had the effect of him dropping out of the Big 4 category -- and that was why it rose by 1,640 contracts during the reporting week.
Taking that to its logical conclusion means that the Big 4 'commercial' short position, which is most likely a pure number now, didn't do much this past week. That one lone Managed Money trader most likely sits in the top spot of the Big '5 through 8' category.
Here's Nick's 9-year COT chart for silver, updated with the above data. Click to enlarge.
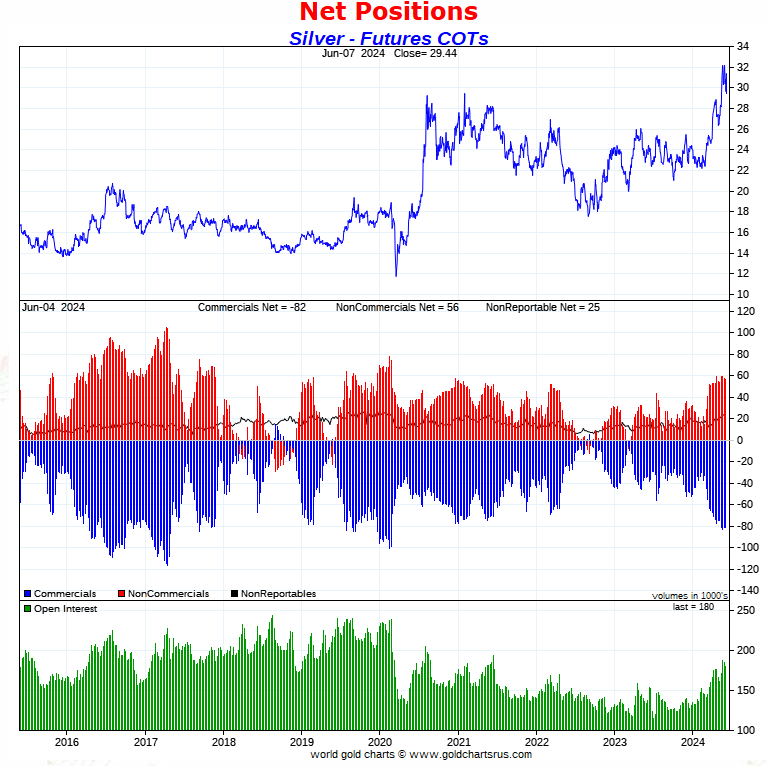
What changes there were in the Big 4/8 commercial short category did little to relieve the wildly bearish set-up that still exists in the COMEX future market -- and I was more than taken aback by the fact that a $2+ dollar price drop in silver had almost no discernible effect on the Big 4/8 short position...except for that one Managed Money trader that currently and temporarily infects them.
But with Friday's bear raid, its a reasonable assumption to make that the above COT Report for silver is yesterday's news in some respects. Of course I thought that of this COT Report and looked what we ended up getting.
All Friday's big engineered drop in silver did, was take back all of the gains silver put on in the July contract since the Tuesday cut-off...plus a bit more. Silver's 50-day moving average is still 75 cents below Friday's close -- and if 'da boyz' can blow it through that price, then we'll see some serious Managed Money selling.
![]()
In gold, the commercial net short position rose by 4,981 COMEX contracts, or 498,100 troy ounces of the stuff.
They arrived at that number by reducing their long position by 25,763 contracts -- and also reduced their short position by 20,782 COMEX contracts. It's the difference between those two numbers that represents their change for the reporting week.
Under the hood in the Disaggregated COT Report, the Managed Money traders increased their net long position by 3,471 contracts...which they accomplished by reducing their long position by 1,884 contracts...but also reduced their short position by 5,355 contracts. It's the difference between those two numbers that represents their change for the reporting week.
The traders in the Other Reportables category were net buyers...increasing their net long position by 2,754 contracts...mostly by increasing their short position by 2,467 COMEX contracts.
The traders in the Nonreportable/small trader category were, like the Managed Money traders, net buyers...increasing their net long position by a hefty 4,264 contracts.
Doing the math: 3,471 plus 4,264 minus 2,754 equals 4,981 COMEX contracts, the change in the commercial net short position.
The commercial net short position in gold now sits at 265,931 COMEX contracts/26.593 million troy ounces of the stuff...up those 4,981 contracts from the 260,950 COMEX contracts/26.095 million troy ounces they were short in the May 31 COT Report. This is the largest commercial net short position in gold since mid April of 2022.
The Big 4 shorts increased their net short position by a very hefty 10,885 COMEX contracts...from the 169,900 contracts, up to 180,785 contracts... which is a monstrously bearish number -- and the most bearish in years.
But the Big '5 through 8' shorts decreased their net short position...from the 75,727 contracts they held short in the May 31 COT Report, down to 70,703 contracts held short in the current COT Report...still some distance away from a bullish number -- and a decrease of 5,024 COMEX contracts week-over-week.
The Big 8 short position rose from 245,627 contracts/24.563 million troy ounces, up to 251,488 contracts/25.149 million troy ounces...an increase of 5,861 COMEX contracts.
Ted's raptors, the small commercial traders other than the Big 8 shorts, decreased their short position by 880 contracts...but are still net short 14,443 COMEX contracts, which is a lot for them.
Here's Nick Laird's 9-year COT Report chart for gold, updated with the above data. Click to enlarge.
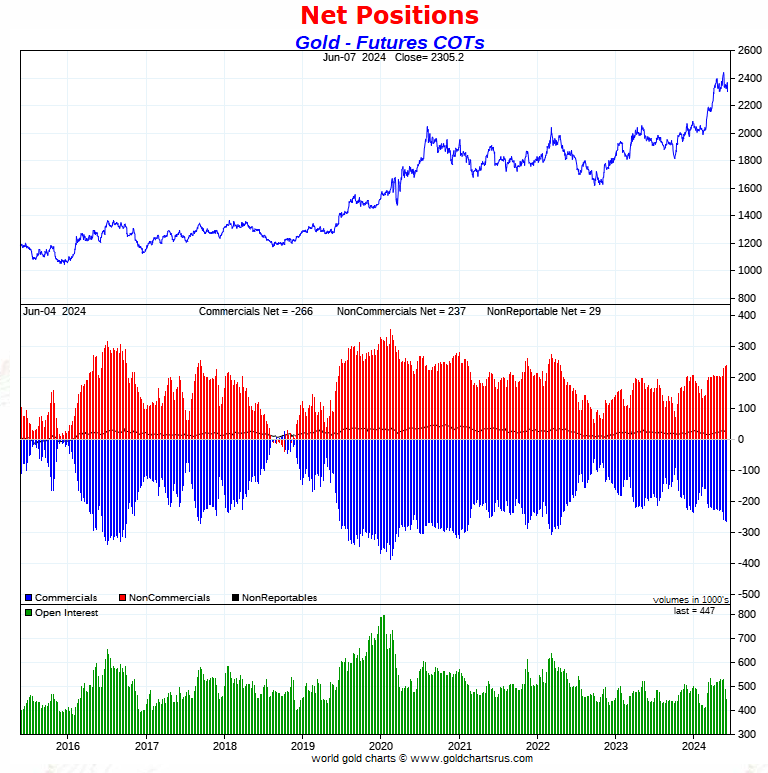
I was not at all amused by the big increase in the Big 4 short position during the reporting week. But after yesterday's collusive price smash, blowing gold convincingly through its 50-day moving average in the process, this COT Report for gold is very much 'yesterday's news'.
So, this current on-and-off 'wash, rinse & spin' cycle was back on in spades yesterday -- and it is entirely unknown how long this one will last. But, like you, I was more than taken aback by how ferocious it was. The collusive commercial shorts were the most aggressive that I've ever seen them... keeping both silver and gold under almost constant price pressure...even in after-hours trading.
I don't recall silver being down over two bucks in one day -- and gold down over $90 at its low tick.
Next week's COT Report should prove more than interesting -- and there are still two more trading sessions left in the reporting week before the cut-off at the COMEX close on Tuesday.
![]()
In the other metals, the Managed Money traders in palladium, increased their net short position by a further and very hefty 1,901 COMEX contracts... the biggest one-week increase I can remember -- and are net short palladium by a jaw-dropping 14,355 contracts...57.6 percent of total open interest -- and the highest on record. All of the other four categories in the Disaggregated COT Report are net long palladium...the Swap Dealers in the commercial category in particular.
In platinum, the Managed Money traders reduced their net long position by 5,149 contracts during the reporting week -- but still remain net long platinum by 13,416 COME contracts. The traders in the Producer/Merchant category are mega net short 29,098 COMEX contracts -- and the Swap Dealers in the commercial category are now back on the long side in platinum for the first time in a month -- and are net long 975 COMEX contracts. The traders in both the Other Reportables and Nonreportable/small traders categories remain net long platinum by very decent amounts...especially the Other Reportables.
It's the world's bank in the Producer/Merchant category that are 'The Big Shorts' in platinum, as per yesterday Bank Participation Report -- and are even more short now than they were a month ago. I'll have all of that a bit further down.
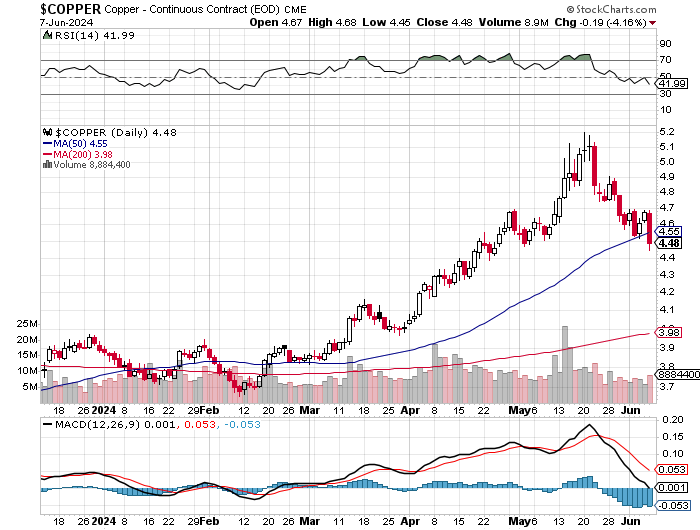
In copper, the Managed Money traders decreased their net long position for the second week in a row...this time by 7,938 COMEX contracts -- but remain net long copper by 55,050 COMEX contracts...about 1.376 Billion pounds of the stuff as of yesterday's COT Report...down from the 1.575 Billion pounds they were net long copper in last week's report.
Copper, like platinum, continues to be a wildly bifurcated market in the commercial category. The Producer/Merchant category is net short 86,605 copper contracts/2.165 Billion pounds -- while the Swap Dealers are net long 11,893 COMEX contracts/297 million pounds of the stuff.
Whether this means anything or not, will only be known in the fullness of time. Ted says it doesn't mean anything as far as he's concerned, as they're all commercial traders in the commercial category. However, this bifurcation has been in place for as many years as I can remember -- and that's a lot.
In this vital industrial commodity, the world's banks...both U.S. and foreign... are net long 10.2 percent of the total open interest in copper in the COMEX futures market as shown in the June Bank Participation Report that came out yesterday...up from the 8.7 percent they were net long in May's.
At the moment it's the commodity trading houses such as Glencore and Trafigura et al., along with some hedge funds, that are net short copper in the Producer/Merchant category, as the Swap Dealers are net long, as pointed out above.
The next Bank Participation Report is due out on Friday, July 5.
![]()
Here’s Nick Laird’s “Days to Cover” chart, updated with the COT data for positions held at the close of COMEX trading on Tuesday, June 4. It shows the days of world production that it would take to cover the short positions of the Big 4 — and Big '5 through 8' traders in every physically traded commodity on the COMEX. Click to enlarge.
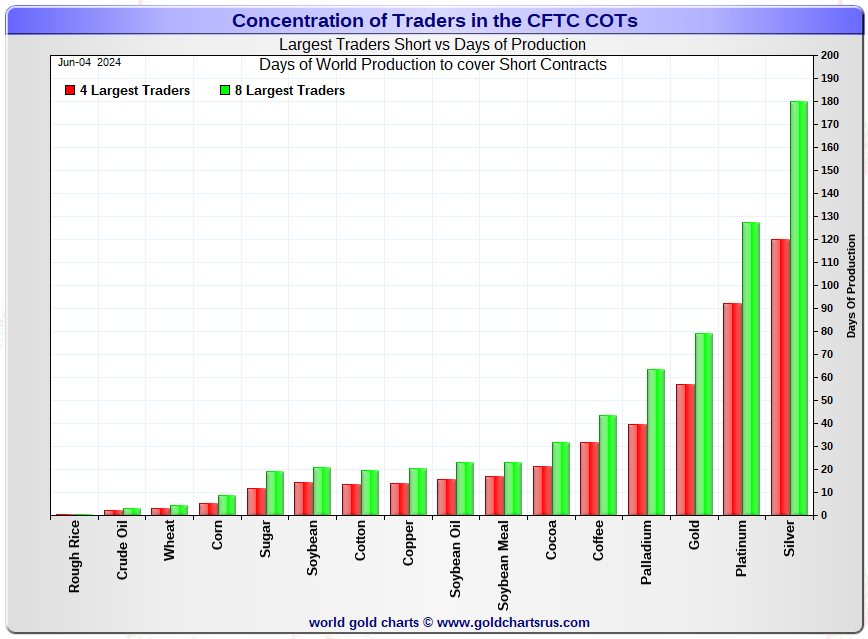
In this week's data, the Big 4 traders are short about 120 days of world silver production...up about 4 days from last week's report. The ‘5 through 8’ large traders are short an additional 60 days of world silver production...down 2 days from last week, for a total of about 180 days that the Big 8 are short -- and obviously up 2 days from last week's report.
Those 180 days that the Big 8 traders are short, represents 6 months of world silver production, or 405.57 million troy ounces/81,114 COMEX contracts of paper silver held short by these eight mostly commercial traders. Several of the largest of these are now non-banking entities, as per Ted's discovery a year or so ago. June's Bank Participation Report that came out yesterday continues to confirm that this is still the case -- and not just in silver, either.
The small commercial traders other than the Big 8 commercial shorts...are short something over 10,000 COMEX contracts...once that Managed Money trader's short position is factored out.
But that short position held by that lone managed money trader that currently [and temporarily] inhabits the Big 8 short category. Whether they cover for a profit during this current 'wash, rinse & spin' cycle, or are forced to cover in a panic, booking big losses on rising prices, is still an unknown. But they did cover some at a profit during this past reporting week, as per the above COT Report.
In gold, the Big 4 are short about 57 days of world gold production...up 4 days from last week's COT Report. The '5 through 8' are short an additional 22 days of world production, down 2 days from last week...for a total of 79 days of world gold production held short by the Big 8 -- and obviously up 2 days from last Friday's COT Report.
The Big 8 commercial traders are short 45.1 percent of the entire open interest in silver in the COMEX futures market as of yesterday's COT Report, up a bit from the 43.4 percent that they were short in the May 31 COT Report -- and something over the 50 percent mark once their market-neutral spread trades are subtracted out. That percentage gain was partially caused by a small drop in silver's total open interest during the week...4,992 COMEX contracts...which affects the calculation.
In gold, it's 56.2 percent of the total COMEX open interest that the Big 8 are short, up huge from the 50.6 percent they were short in the May 31 COT Report -- and a bit under the 65 percent mark once their market-neutral spread trades are subtracted out...an enormous amount. That increase was entirely due to gold's open interest falling by 37,942 contracts during the reporting week...most of which was those uneconomic and market-neutral spread trades being removed going into First Notice Day...plus two days worth of June deliveries. These deliveries reduce open interest by the number of contracts delivered, which was over 25,000 during those first two days.
Ted is still of the opinion that Bank of America is short about one billion ounces of silver in the OTC market, courtesy of JPMorgan & Friends. He's also of the opinion that they're short 25 million ounces of gold as well. And with the latest report from the OCC in hand from two months ago, he's still of that mind.
As reported further up, the short position in SLV now sits at 22.05 million shares as of last Friday's short report...up 19.05% from the 18.52 million shares sold short in the prior report. The next short report is due out on Tuesday, June 11.
The situation regarding the Big 4/8 commercial short position in gold and silver remains obscene and grotesquely bearish as of yesterday's COT Report -- and mostly remains so despite yesterday's price shenanigans.
As Ted has been pointing out ad nauseam, the resolution of the Big 4/8 short positions will be the sole determinant of precious metal prices going forward -- which should be totally obvious to all by now, but most remain oblivious to that fact -- and if they are aware of it, are careful never to mention it in the public domain.
![]()
The June Bank Participation Report [BPR] data is extracted directly from yesterday's Commitment of Traders Report. It shows the number of futures contracts, both long and short, that are held by all the U.S. and non-U.S. banks as of this past Tuesday’s cut-off in all COMEX-traded products.
For this one day a month we get to see what the world’s banks have been up to in the precious metals. They’re usually up to quite a bit -- and they certainly were again this past month.
[The June Bank Participation Report covers the four-week time period from May 7 to June 4 inclusive]
In gold, 5 U.S. banks are net short 94,466 COMEX contracts, up a further 15,710 contracts from the 78,746 contracts that these same 5 U.S. banks were short in May's BPR. This is the largest short position that the U.S. banks have held since May of 2020.
Also in gold, 24 non-U.S. banks are net short 72,437 COMEX contracts, up 7,757 contracts from the 64,680 contracts that 23 non-U.S. banks were short in May's BPR. This is the biggest short position in gold that these non-U.S. banks have held since April 2022.
At the low back in the August 2018 BPR...these same non-U.S. banks held a net short position in gold of only 1,960 contacts -- so they've been back on the short side in an enormous way ever since.
Although some of the largest U.S. and foreign bullion banks are in the Big 8 short category in gold, some of the hedge fund/commodity trading houses are short even more grotesque amounts of gold than the banks. It's also a strong possibility that the BIS could be short gold in the COMEX futures market as well.
As of June's Bank Participation Report, 29 banks [both U.S. and foreign] are net short 37.2 percent of the entire open interest in gold in the COMEX futures market...up from the 27.0 percent that 28 banks were net short in the May BPR.
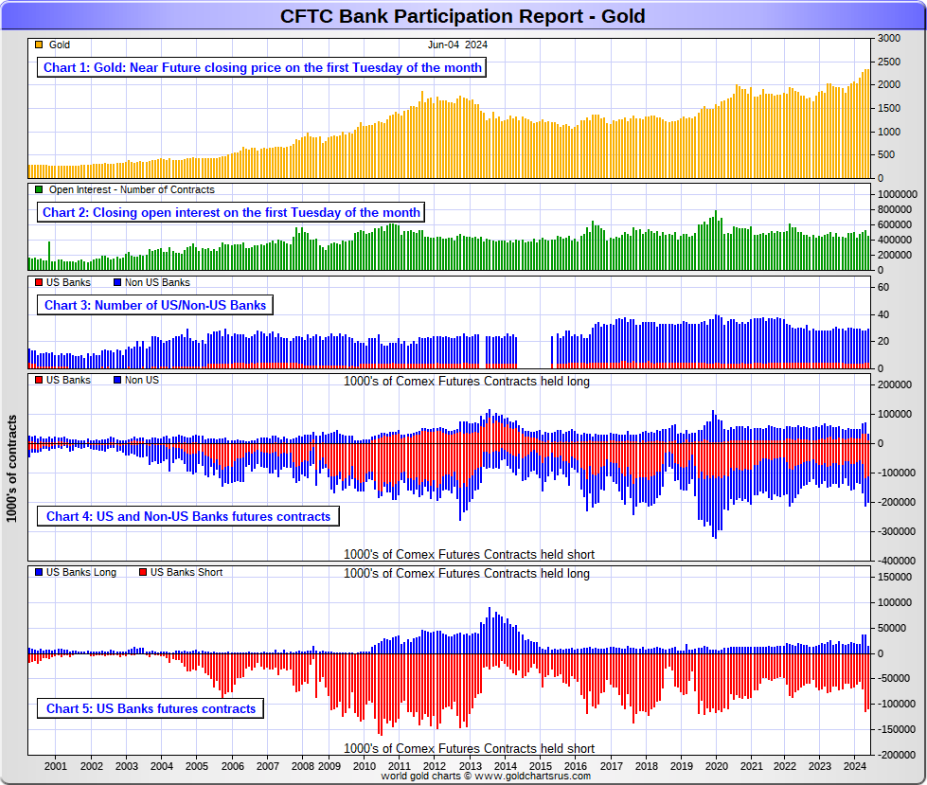
Here’s Nick’s BPR chart for gold going back to 2000. Charts #4 and #5 are the key ones here. Note the blow-out in the short positions of the non-U.S. banks [the blue bars in chart #4] when Scotiabank’s COMEX short position was outed by the CFTC in October of 2012. Click to enlarge.
In silver, 5 U.S. banks are net short 35,707 COMEX contracts, up from the 28,206 contracts that these same 5 U.S. banks were short in the May BPR... the largest short position they've held since April 2022.
The biggest short holders in silver of the four U.S. banks in total, would be Citigroup, Wells Fargo and Bank of America.
And, like in gold, I have my suspicions about the Exchange Stabilization Fund's role in all this...although, also like in gold, not directly.
Also in silver, 20 non-U.S. banks are net short 36,107 COMEX contracts, up 2,589 contracts from the 33,518 contracts that these same 20 non-U.S. banks were short in the May BPR...their largest short position since March 2020.... when they were short 42,666 COMEX contracts.
I would suspect that HSBC, Barclays and Standard Chartered hold by far the lion's share of the short position of these non-U.S. banks...as do some of Canada's banks as well. And, like in gold, the BIS could also be actively shorting silver as well. The remaining short positions divided up between the other 15 or so non-U.S. banks are immaterial — and have always been so. The same can be said of most of the 23 non-U.S. banks in gold.
As of June's Bank Participation Report, 25 banks [both U.S. and foreign] are net short 40.0 percent of the entire open interest in the COMEX futures market in silver — up from the 38.2 percent that those same 25 banks were net short in the May BPR.
This is the largest short position the world's bullion banks have held in silver since February of 2019, as per the chart below.
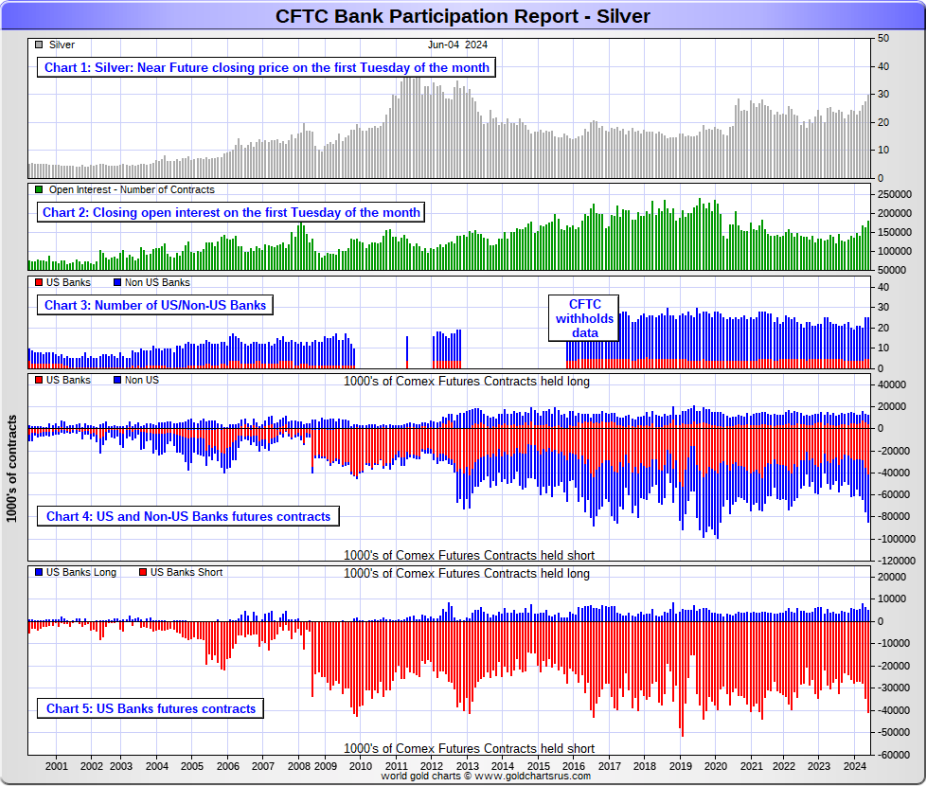
Here’s the BPR chart for silver. Note in Chart #4 the blow-out in the non-U.S. bank short position [blue bars] in October of 2012 when Scotiabank was brought in from the cold. Also note August 2008 when JPMorgan took over the silver short position of Bear Stearns—the red bars. It’s very noticeable in Chart #4—and really stands out like the proverbial sore thumb it is in chart #5. Click to enlarge.
In platinum, 4 U.S. banks are net short 13,973 COMEX contracts in the June BPR, up 3,138 contracts from the 10,835 contracts that 5 U.S. banks were short in the May BPR.
At the 'low' back in September of 2018, these U.S. banks were actually net long the platinum market by 2,573 contracts. So they have a very long way to go just to get back to market neutral in platinum...if they ever intend to, that is. They look permanently stuck on the short side to me, a fact that I point out regularly.
Also in platinum, 20 non-U.S. banks increased their net short position by 3,148 contracts...up to 9,964 contracts, from the 6,816 contracts that 18 non-U.S. banks were net short in the May BPR. Back in December's BPR, these non-U.S. banks were net short a microscopic 35 platinum contracts...so they're back on the short side in a big way.
Platinum remains the big commercial shorts No. 2 problem child after silver...but a very distant No. 2 down the list. How it will ultimately be resolved is unknown, but most likely in a paper short squeeze, as the known stocks of platinum are minuscule compared to the size of the short positions held -- and that's just the short positions of the world's banks I'm talking about here.
Of course there's now a structural deficit in it [and palladium] as well.
And as of June's Bank Participation Report, 24 banks [both U.S. and foreign] were net short 24.9 percent of platinum's total open interest in the COMEX futures market, up a bit from the 21.9 percent that 23 banks were net short in May's BPR.
Here's the Bank Participation Report chart for platinum. Click to enlarge.

In palladium, 5 U.S. banks are net long a record 4,411 COMEX contracts in the June BPR, up 1,269 contracts from the 3,142 contracts that 4 U.S. banks were net long in the May BPR.
Also in palladium, 12 non-U.S. banks are net long 939 COMEX contracts, up from the 632 contracts that 14 non-U.S. banks were net long in the May BPR.
And as I've been commenting on for almost forever, the COMEX futures market in palladium is a market in name only, because it's so illiquid and thinly-traded. Its total open interest in yesterday's COT Report was only 24,911 contracts...compared to 96,267 contracts of total open interest in platinum...179,854 contracts in silver -- and 447,488 COMEX contracts in gold.
But I should point out that open interest in palladium has been on a slow but steady increase over the last few years, because I remember when it was less than 9,000 contracts.
As I say in this spot every month, the only reason that there's a futures market at all in palladium, is so that the Big 8 commercial traders can control its price. That's all there is, there ain't no more.
As of this Bank Participation Report, 17 banks [both U.S. and foreign] are net long 21.5 percent of the entire COMEX open interest in palladium ...up from the 14.7 percent of total open interest that 18 banks were net long in the May BPR.
For the last 3+ years, the world's banks have not been involved in the palladium market in a material way. And with them still net long, it's all hedge funds and commodity trading houses that are left on the short side. The Big 8 commercial shorts, none of which are banks, are short 46.8 percent of total open interest in palladium as of yesterday's COT Report.
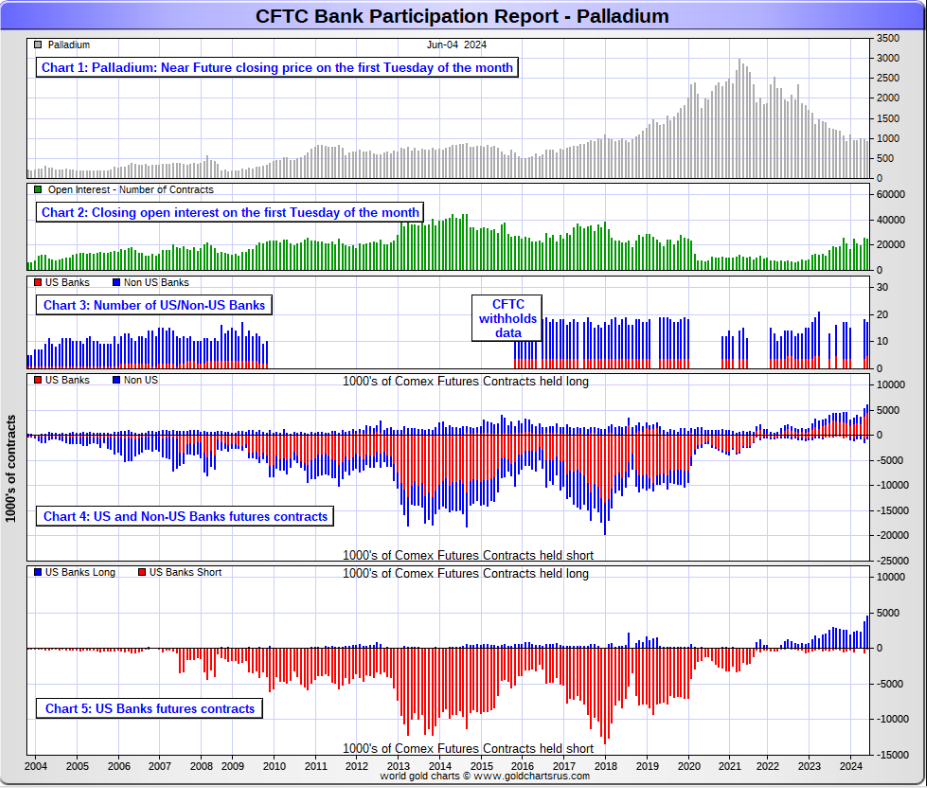
Here’s the palladium BPR chart. Although the world's banks are net long at the moment, it remains to be seen if they return as big short sellers again at some point like they've done in the past. Click to enlarge.
Excluding palladium for obvious reasons, and almost all of the non-U.S. banks in gold, silver...only a small handful of the world's banks, most likely no more than 5 or so in total -- and mostly U.S.-based...along with the BIS perhaps... continue to have meaningful short positions in the other three precious metals.
As I pointed out above, some of the world's commodity trading houses and hedge funds are also mega net short the four precious metals...far more short than the U.S. banks in some cases. They have the ability to affect prices if they choose to exercise it...which I'm sure they're doing at times. But it's still the collusive commercial shorts at Ground Zero of the price management scheme.
And as has been the case for years now, the short positions held by the Big 4/8 traders, is the only thing that matters...especially the short positions of the Big 4...or maybe only the Big 1 or 2. How this is ultimately resolved [as Ted keeps pointing out] will be the sole determinant of precious metal prices going forward.
The Big 8 commercial traders, which now includes even Ted's raptors...the small commercial traders other than the Big 8...continue to have an iron grip on their respective prices...which was on full display yesterday -- and it will remain that way until they either relinquish control voluntarily, are told to step aside...or get overrun.
Considering the current state of affairs of the world as it stands today -- and the structural deficit in silver -- and now most likely the other three precious metals as well, the chance that these big bullion banks and commodity trading houses could get overrun at some point, is not zero -- and certainly within the realm of possibility if things go totally non-linear.
But...as Ted keeps reminding us from time to time...if they do finally get overrun, it will be for the very first time...which obviously wasn't allowed to happen this past week, either.
I have an average number of stories, articles and videos for you today.
![]()
CRITICAL READS
U.S. adds a much-better-than-expected 272,000 jobs in May, but unemployment rate edges up to 4%
The U.S. economy added far more jobs than expected in May, countering fears of a slowdown in the labor market and likely reducing the Federal Reserve’s impetus to lower interest rates.
Nonfarm payrolls expanded by 272,000 for the month, up from 165,000 in April and well ahead of the Dow Jones consensus estimate for 190,000, the Labor Department’s Bureau of Labor Statistics reported Friday.
At the same time, the unemployment rate rose to 4%, the first time it has breached that level since January 2022. Economists had been expecting the rate to stay unchanged at 3.9% from April.
The increase came even though the labor force participation rate decreased to 62.5%, down 0.2 percentage point. The survey of households used to compute the unemployment rate showed that the level of people who reported holding jobs fell by 408,000.
Well, dear reader, you can believe this fairy tale if you wish...but I'll pass on it. I thought the number would be 'massaged to perfection'...but nothing like this. This news item put in an appearance on the cnbc.com Internet site at 8:31 a.m. EDT -- and was updated about an hour later. I thank Swedish reader Patrik Ekdahl for today's first story. Another link to it is here. The Zero Hedge spin on this is headlined "Inside the Most Ridiculous Jobs Report in Years" -- and linked here.
![]()
Shock Decline in Credit Card Debt is First Since Covid Crash, as Card APRs Hit New All-Time High
On a day when the jobs report was a "pick your adventure" in economic analysis, and signaled either a very strong job market (if you looked at the Establishment survey) or a dire one (if you looked at the Household survey and peaked even a bit below the surface), moments ago we got the tie-breaker in the form of the latest Consumer credit data, and it confirmed our fears: the consumer has hit a brick wall.
According to the Federal Reserve's monthly consumer credit report, in April total consumer credit rose $6.4 billion, far below the median estimate of $10 billion, but more notably, the March number was shocking revised from $6.3BN to a negative $1.1BN, the biggest drop since last August when Biden enacted his unconstitutional student debt relief.
And while the reason behind the dramatic revision to the March print was due to a plunge in non-revolving credit, the result of even more student debt cancellations which however were only apparent in retrospect, with April reverting somewhat back to normal at $6.9 billion, if well below the recent monthly average of $12 billion...
... what was the real shocker in today's print was the April revolving credit print, i.e., credit card debt. At -$0.5BN, it followed last month's puny $1.7BN, and was the first negative number since the covid crisis!
To get a sense just how rare it is to get a negative credit card debt monthly change, consider that in the six years prior to the covid crash, the U.S. had recorded just 5 months of negative prints, and all tended to precede major drawdowns in the economy. We expect no less this time.
This multi-chart Zero Hedge news item was posted on their Internet site at 3:29 p.m. on Friday afternoon EDT -- and another link to it is here.
![]()
Summer of Discontent and Instability -- Doug Noland
It was another important week – and I’m not referring to Nvidia’s market cap surpassing Apple’s to reach $3.0 TN (or Roaring Kitty’s podcast touting GameStop attended by 600,000). There were market-surprising/shocking election results in Mexico, India, and South Africa. Volatility was notable across international markets. The ECB and Bank of Canada cut rates this week, with markets seeing the global central bank community’s easing cycle now underway. And Friday, another stronger-than-expected Non-Farm Payrolls report rattled the bond market. Could there possibly be a common thread?
The Mexican peso sank 7.2% this week, with over half the loss on post-election Monday. Mexican stocks (S&P/BMV Index) were slammed 6.1% in Monday trading. Indian (Nifty50) equities were hit 5.9% in Tuesday’s session.
Highly speculative (and levered) markets don’t mix so well with voter acrimony. Importantly, speculative Bubbles and public enmity are not coincidental. They are inevitable consequences of inflationism and monetary disorder. Given enough time, policies so revered by the markets will be viewed with increasing disdain by the masses. Wealth inequalities become only more pronounced late in the cycle, creating a sprawling divergence between market euphoria and deepening public dissatisfaction. Political class market embracement/accommodation at some point shifts to the appeasement of ever more powerful populist movements. Markets this week at least acknowledge the unfolding power-shift to disgruntled electorates.
Booming markets have a way of disregarding corrosive fundamental factors. Especially in today’s backdrop, there are competing narratives: the golden era of markets and capitalism versus increasingly vulnerable historic global Bubbles. Overwhelming evidence supporting the latter ensures ample hedging and shorting – fuel for recurring squeezes and rallies. It all becomes too alluring, with short-term speculation coming to dominate. Irrespective of underlying fundamental trends, speculative markets will innately gravitate to opportunities associated with bullish narratives.
June 4 – Bloomberg (Maria Elena Vizcaino, Vinícius Andrade and Michael O'Boyle): “For the last two years, the world’s fund managers had a recipe to mint money in Mexico. Borrow anywhere interest rates were low, pile into Mexican assets — and clean up as the peso marched higher and higher. Virtually overnight, it’s no longer such a sure thing. The landslide victory by Claudia Sheinbaum in the presidential election on Sunday has rattled markets by promising to significantly strengthen the hand of the nation’s ruling leftist party in legislation.”
The global “periphery” is acutely vulnerable. EM countries have added enormous amounts of debt over recent years, and we should assume that much of it was purchased by speculators with borrowed money. It’s certainly possible that so-called “carry trades” total in the Trillions.
Count me skeptical of the view that inflation and growth are on the descent. Sure, there are ample signs of weakness to support the thesis that the Fed will soon have the all clear to begin cutting rates. The household sector has added significant debt, and a rising number of consumers face financial stress. Of course, an inflationary economic environment will burden major cross-sections of the population.
But that’s the overarching issue: inflation remains a major force. And one of this cycle’s greatest inflationary manifestations is a gross inequitable distribution of wealth. The lower and much of the middle class suffer from higher prices, while the wealthier see their wealth continue to inflate.
Doug's weekly commentary is always worth reading -- and this one put in an appearance on his website just before midnight PDT on Friday -- and another link to it is here. Gregory Mannarino's post market close rant for Friday is linked here -- and runs for 21 minutes.
![]()
Judge Napolitano interviews Colonel Lawrence Wilkerson re Scott Ritter vs. the State Department
This 31-minute video interview, which I haven't had a chance to watch all of yet, was posted on the youtube.com Internet site on Friday afternoon -- and it comes to us courtesy of Guido Tricot. I suspect that it's worthwhile video -- and another link to it is here.
![]()
This 16-minute video interview is definitely worth your time -- and it was posted on the brighteon.com Internet site on Thursday. I thank Roy Stephens for pointing it out -- and another link to it is here.
![]()
Gold drops as jobs data dashes Fed rate-cut hopes, China pauses buying
Gold fell the most since April as surprise strength in a key U.S. jobs report dashed hopes that the Federal Reserve will be able to start lowering borrowing costs soon.
Billion slumped as much as 2.6% while Treasury yields and the dollar surged after the U.S. government’s May employment report showed job growth exceeded expectations and wages were hot.
“A strong jobs report reversed a great deal of the rate cut excitement that had built during the past week,” said Ole Hansen, head of commodity strategy at Saxo Bank AS. “This report removes hopes for earlier rate cuts, with sticky wage growth and robust employment in need of high rates to cool.”
Fed officials have said they need more evidence that inflation is easing toward the central bank’s 2% target as they consider when to cut rates, while investors are looking for conviction of a soft landing that would justify US rate cuts. Lower borrowing costs typically boost gold, which doesn’t pay interest.
After surging to a record above $2,450 an ounce, bullion has traded in a fairly narrow range amid the uncertainty over the Fed’s rate trajectory. Swap traders now no longer fully price in a rate cut before December.
If you believe these were the reasons that gold 'fell' yesterday...I have a bridge for you at a very good price. This Bloomberg story from 6:23 a.m. PDT on Friday morning was picked up by yahoo.com -- and I found it embedded in a GATA dispatch. Patrik Ekdahl contributed to this story as well. Another link to it is here.
![]()
Vietcombank opens four more gold stores as gold price decreases
Vietcombank has opened four additional stores to sell gold, bringing the total number of stores operated under the commercial bank to ten, five in Hà Nội and five in HCM City to date.
Vietcombank, one of the four large commercial banks with state capital in Việt Nam, has served more than 1,500 customers since their gold stores were opened, selling nearly 10,000 taels of gold, according to Lê Hoàng Tùng, Vietcombank's deputy director-general.
He said on top of adding additional gold stores, the bank will keep improving its protocols, product and service quality to speed up transactions, in an effort to support the State Bank of Vietnam's directive to close the gap between domestic and international gold prices.
"In accordance with the central bank's guidance, efforts to narrow the gap between domestic and international gold prices can lead to gold prices going down further. Residents must remain extremely cautious while making purchases of the precious metal," he said.
This gold-related news item, filed from Hà Nội , showed up on the vietnamnews.vn Internet site on Friday -- and I found it on Sharps Pixley. Another link to it is here.
![]()
The CARTOON & the QUOTE

![]()
The WRAP
"Understand this. Things are now in motion that cannot be undone." -- Gandalf the White
![]()
Today's pop 'blast from the past' is from the soundtrack of the 1980 musical fantasy film Xanadu. It spent four weeks at No. 1 on the U.S. Billboard Hot 100. The song -- and the singer, are instantly recognizable. The link is here. Of course there's a bass cover to this -- and it's far more complex than even I imagined it might be -- and that's linked here.
Today's classical 'blast from the past' is Pyotr Ilyich Tchaikovsky's Piano Concerto No. 1 in B♭ minor, Op. 23 which he composed between November 1874 and February 1875. It was revised in 1879 and again in 1888. It was first performed on October 25, 1875, in Boston by virtuoso pianist Hans von Bülow.
Although the premiere was a success with the audience, the critics were not so impressed. One wrote that the piece was "hardly destined...to become classical". But as Rex Reed once said..."Nobody ever built a monument to a critic." Of course, it is one of the most popular of Tchaikovsky's compositions and among the best known of all piano concerti.
Here's the incomparable and incredibly gifted Anna Fedorova doing the honours with the Nordwestdeutsche Philharmonie at the Concertgebouw in Amsterdam back on 14 October 2018. Maestro Yves Abel conducts -- and the link to it is here.
![]()
Exactly thirty minutes after the Shanghai Gold Exchange closed for the start of the long weekend in China, which was 9 a.m. BST in London, the collusive commercial traders, most likely knowing the non-farm payrolls number in advance, began their assault on the precious metals....gold, silver and platinum in particular.
And except for a minor pause between the 12 o'clock noon BST London silver fix -- and 8:30 a.m. in New York, they were ruthless in their efforts...closing gold lower by 3.5 percent -- and silver by double that amount. As I pointed out in the title of today's column, it was most certainly premeditated.
They closed gold well below its 50-day moving average...but the best they could do in silver was take back all of Wednesday's and Thursday's gains...plus a bit more. And as I pointed out earlier, they now have silver back to within 75 cents of its 50-day moving average.
Platinum got bombed as well and, like gold, was closed well below its 50-day moving average...but its 200-day remains a long way down from there.
Palladium was closed lower too, but with the managed money traders holding a record short position in it as of yesterday's Bank Participation Report, one has to wonder who benefits from beating it lower, as every other group of traders is very net long this precious metal.
Copper got smoked by 19 cents and, like gold and platinum, was closed back below its 50-day moving average at $4.48/pound. 'Da boyz' have it down 72 cents from its May 20 high tick.
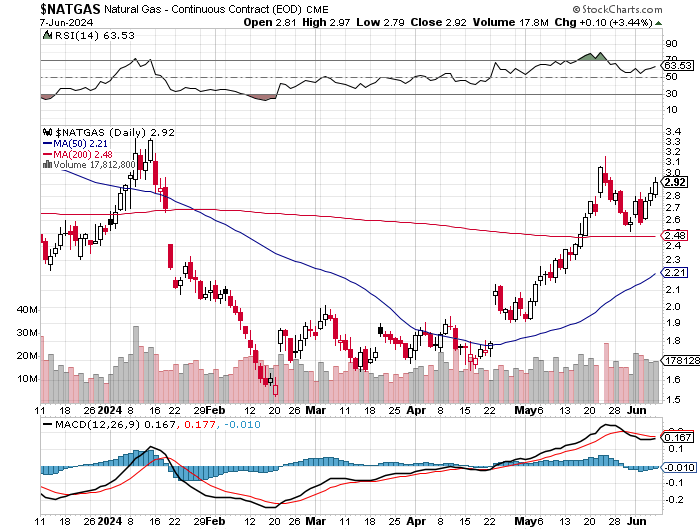
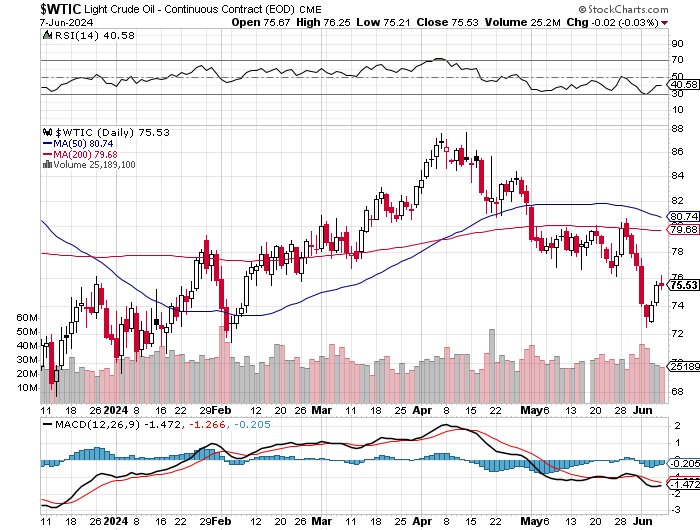
Natural gas [chart included] was the only one allowed to close higher on the day. It finished the Friday trading session in New York at $2.92/1,000 cubic feet...up a dime from Thursday. WTIC closed down an inconsequential 2 cents yesterday at $75.53/barrel.
Here are the 6-month charts for the Big 6+1 commodities...courtesy of stockcharts.com as always and, if interested, their COMEX closing prices in their current front months on Friday should be noted. Click to enlarge.
So this current 'on again, off again' 'wash, rinse & spin' cycle was 'on' again on Friday -- and the commercial traders certainly weren't taking any prisoners. How much there's left to go is unknown -- and I'm sure that even the Big 4/8 shorts don't know how successful they'll be with this iteration. They certainly pulled out all the stops yesterday -- and we'll just have to see how things develop as the days progress.
As mentioned in my COT discussion further up, despite the price pain on Friday, both silver and gold remain hugely bearish from a COMEX futures market perspective -- and there's a lot of low-hanging Managed Money fruit in both precious metals for the collusive commercial traders to pluck...a bunch of which got picked yesterday.
I'm sure on this price smash that both India and China will be buyers...India on Monday -- and possibly China on Tuesday, as their markets are closed for the Dragon Boat Festival on Monday. My thanks to Hugh Stout for pointing that out.
But all eyes should be focused on the growing signs of an expanded conflict in the Russia/Ukraine war...as the NATO members are sounding more bellicose with each passing day. You would be wise not to ignore this growing threat -- and there's no question in my mind that the western globalist power elite are attempting to stop, then reverse what is most certainly going to be a Russian victory in the Ukraine. The humiliation of the impending Ukrainian defeat is more than these psychopathic elitists can handle. But they poke the Russian bear at their peril, as Putin, Lavrov and Medvedev have made perfectly clear on many occasions recently.
All the commentator interviews posted in my column this week...Colonel Douglas Macgregor, Scott Ritter and Professor Jeffery Sachs et al. have painted a very clear picture of how quickly this could spin out of control to the detriment of all life on earth.
As events unfold -- and tensions continue to ratchet up, there's no question that gold and silver will quickly return as the asset class par excellence. It's my opinion -- and Ted's as well, that this is 'da boyz' absolute last swing for the fences before things turn ugly...both at home and abroad.
As always, I'm still 'all in' -- and will remain so until whatever end.
I'm done for the day -- and the week -- and I'll see you here on Tuesday.
Ed
About the author

SUBSCRIBE: https://edsteergoldsilver.com/

Ed Steer’s Daily Analysis of the Gold and Silver Markets
After eight years of writing about the precious metals for Casey Research, the folks at Stansberry & Associates—who just recently purchased controlling interest in the company—decided that my ‘niche market’ column didn’t fit into their plans.
Since the time that Casey Research was kind enough to offer me a stand-alone column, it became their most highly-rated blog almost from the outset—and has remained that way up to this date...